. 2023 Nov 15;133(22):e163802.
doi: 10.1172/JCI163802.

A paracrine circuit of IL-1β/IL-1R1 between myeloid and tumor cells drives genotype-dependent glioblastoma progression

Affiliations

A paracrine circuit of IL-1β/IL-1R1 between myeloid and tumor cells drives genotype-dependent glioblastoma progression

Zhihong Chen et al. J Clin Invest. .

Abstract

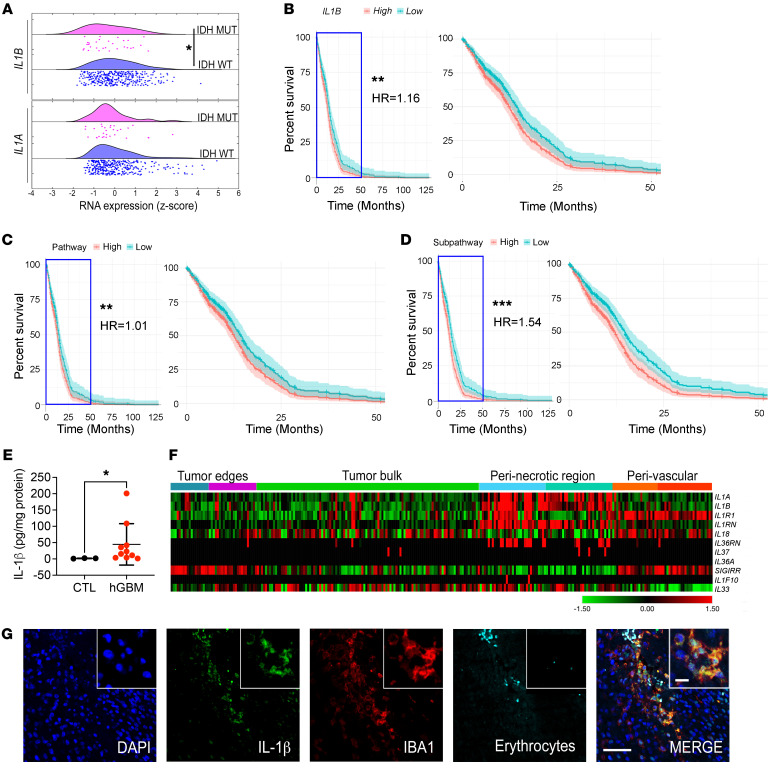
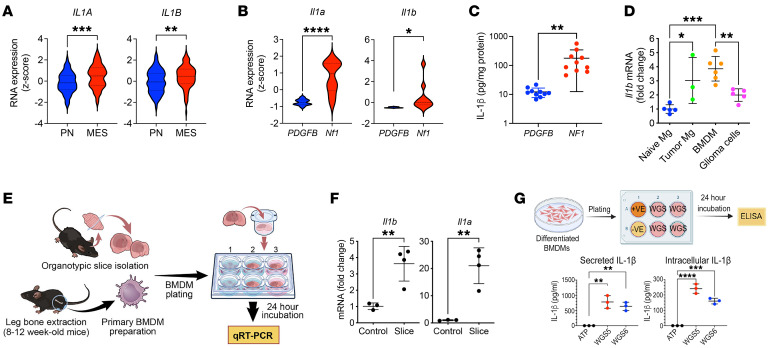
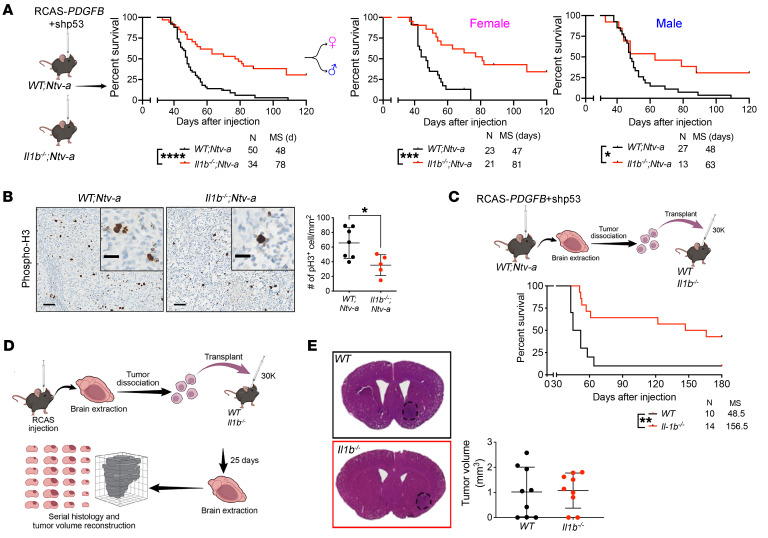
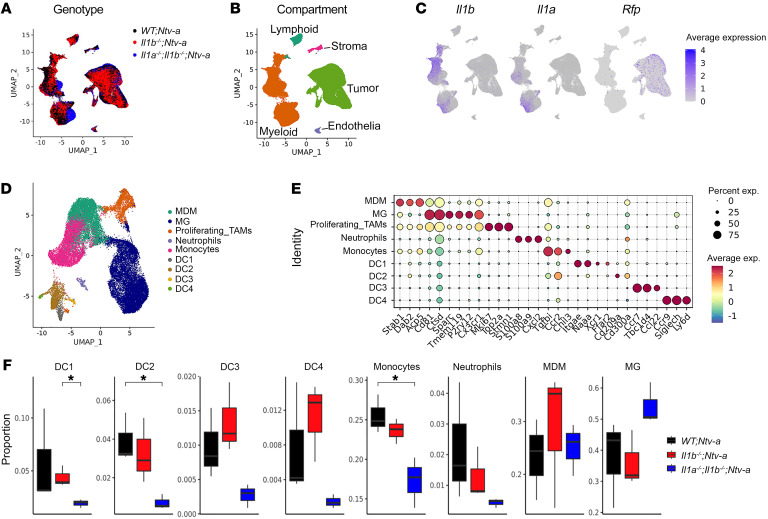
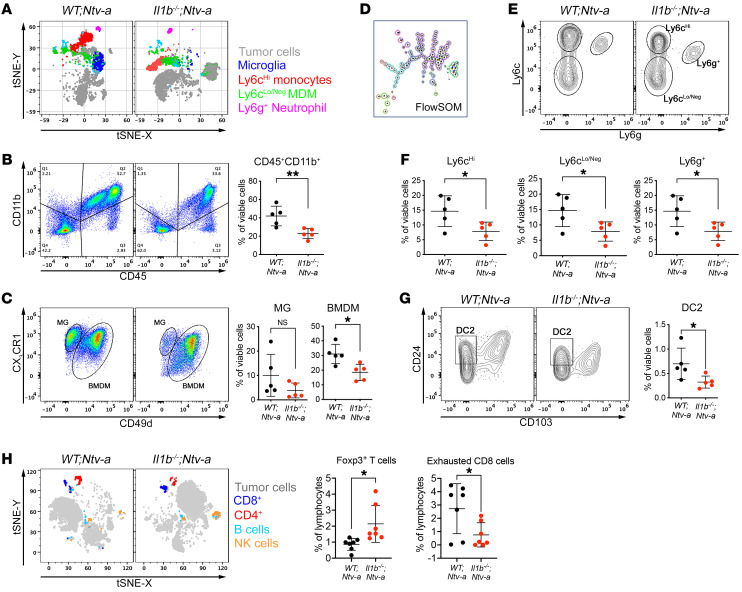
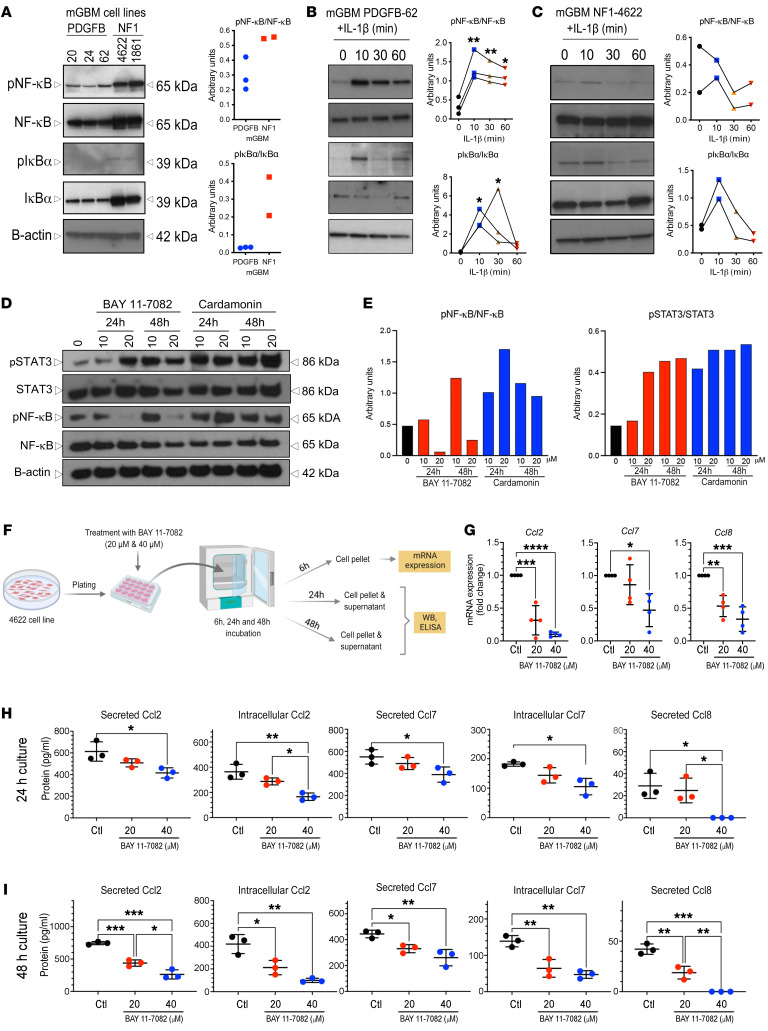
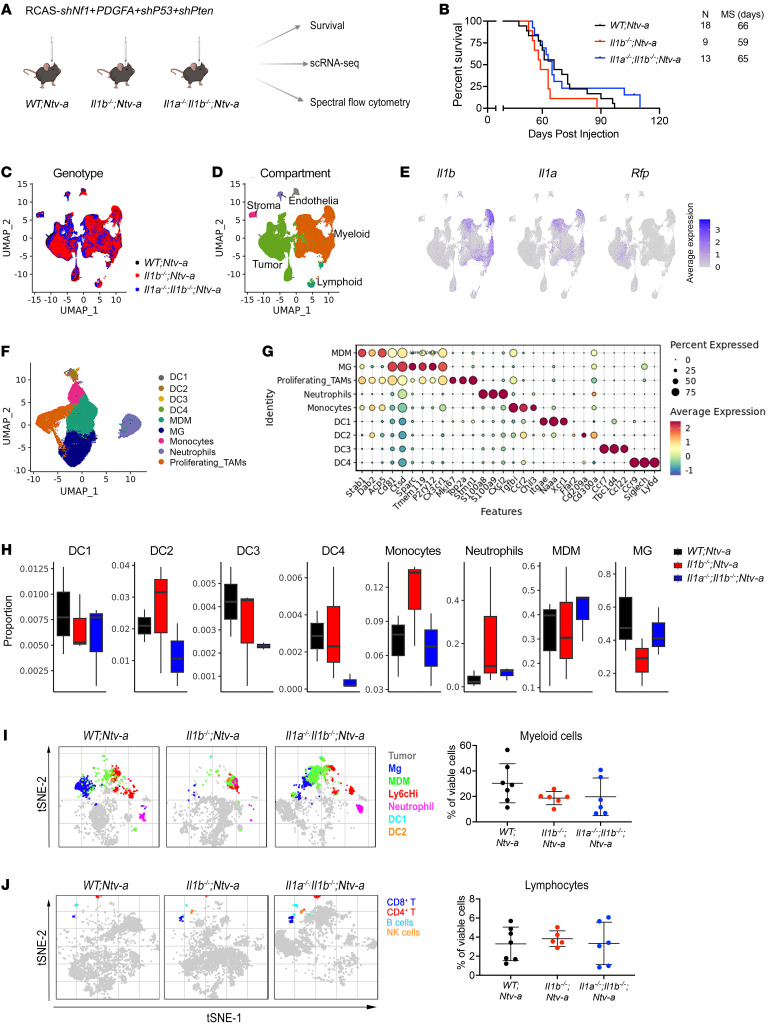
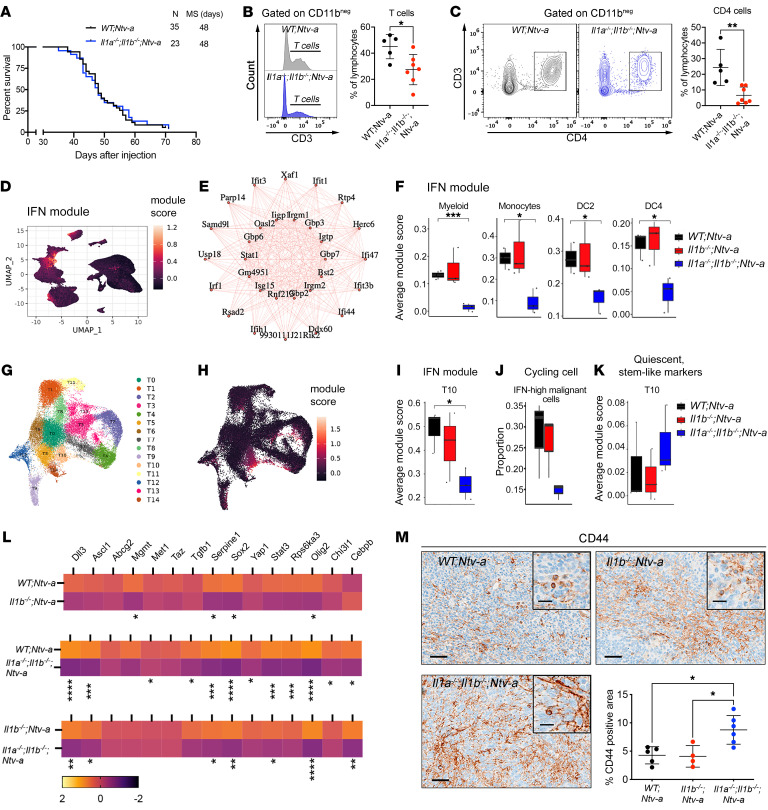
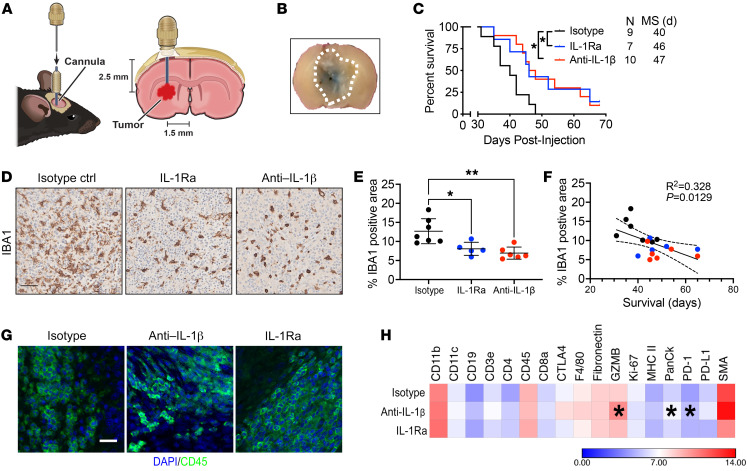
Monocytes and monocyte-derived macrophages (MDMs) from blood circulation infiltrate glioblastoma (GBM) and promote growth. Here, we show that PDGFB-driven GBM cells induce the expression of the potent proinflammatory cytokine IL-1β in MDM, which engages IL-1R1 in tumor cells, activates the NF-κB pathway, and subsequently leads to induction of monocyte chemoattractant proteins (MCPs). Thus, a feedforward paracrine circuit of IL-1β/IL-1R1 between tumors and MDM creates an interdependence driving PDGFB-driven GBM progression. Genetic loss or locally antagonizing IL-1β/IL-1R1 leads to reduced MDM infiltration, diminished tumor growth, and reduced exhausted CD8+ T cells and thereby extends the survival of tumor-bearing mice. In contrast to IL-1β, IL-1α exhibits antitumor effects. Genetic deletion of Il1a/b is associated with decreased recruitment of lymphoid cells and loss-of-interferon signaling in various immune populations and subsets of malignant cells and is associated with decreased survival time of PDGFB-driven tumor-bearing mice. In contrast to PDGFB-driven GBM, Nf1-silenced tumors have a constitutively active NF-κB pathway, which drives the expression of MCPs to recruit monocytes into tumors. These results indicate local antagonism of IL-1β could be considered as an effective therapy specifically for proneural GBM.

Keywords: Brain cancer; Cancer immunotherapy; Immunology; Macrophages; Oncology.


Figures

Figure 1
Figure 1. High IL1B expression in patients with IDH-WT GBM is associated with reduced survival.
(A) IL1A and IL1B expression in IDH-WT (n = 372) and IDH-Mut (n = 30) patient samples from TCGA data sets. Unpaired Student’s t test. (BD) Survival curves grouped by high and low total expression (relative to median) of the IL1B gene (B), IL-1 pathway (C), or a selected IL-1 subpathway (D, described in Supplemental Figure 1), fit using Cox’s proportional hazards regression models (zoomed curves on the right). P values and HRs were derived from the Cox’s proportional hazards model including expression as a continuous covariate and adjusting for sex and age. (E) IL-1β ELISA in human IDH-WT GBM samples (n =10). CTL, adjacent normal brain tissues (n = 3). Unpaired Student’s t test. (F) Expression of IL1 family members in various regions of human GBM tissues as defined by the IVYGap database (n = 36: PN = 10, CL = 12, MES = 8, other = 6) following laser capture microdissection and RNA-Seq. (G) Representative images of immunofluorescence staining of IL-1β (green), IBA1 (red), erythrocytes (cyan), and nuclei (visualized with DAPI, blue). Scale bars: 100 μm; 20 μm (insets). *P < 0.05; **P < 0.01; ***P < 0.001.
Figure 2
Figure 2. IL1B expression is increased in human MES GBM and Nf1-silenced murine GBM.
(A) IL1A and IL1B RNA expression in PN (n = 69) and MES (n = 106) human GBM patient samples from TCGA. Two-tailed Student’s t test. (B) qPCR for Il1a and Il1b RNA expression from murine PDGFB-driven (n = 10) and Nf1-silenced (n = 10) GBM samples. Two-tailed Student’s t test. (C) IL-1β in PDGFB-driven (n = 10) and Nf1-silenced (n = 10) murine GBM tissues by ELISA. Two-tailed Student’s t test. (D) qPCR of Il1b expression in FACS-sorted cells from naive brain (n = 5) and PDGFB-driven tumors (n = 3 to 6). One-way ANOVA with Tukey’s post hoc comparisons. (E) Diagram illustrating the coculturing system of primary murine BMDM and PDGFB-driven tumor slices. (F) qPCR of Il1a and Il1b expression in BMDMs cocultured with tumor slices (n = 3 and 4 respectively). Two-tailed Student’s t test. (G) IL-1β expression from BMDM cocultured with primary PN glioma stem-like cells (WGS, n = 3 each group). One-way ANOVA with Tukey’s post hoc comparisons. *P < 0.05; **P < 0.01; ***P < 0.001; ****P < 0.0001.
Figure 3
Figure 3. TME-derived IL-1β regulates PDGFB-driven murine GBM growth.
(A) Kaplan-Meier survival curves of PDGFB-driven tumors generated in WT;Ntv-a and Il1b–/–;Ntv-a mice. Survival curves were also created stratified by sex. Curves were compared by log-rank (Mantel-Cox) test or Gehan-Breslow-Wilcoxon test (not shown). MS, median survival. n = number of mice. (B) Representative pH3 IHC images of PDGFB-driven tumors generated in WT;Ntv-a (n = 7) and Il1b–/–;Ntv-a mice (n = 5). Two-tailed Student’s t test. Scale bars: 50 μm; 20 μm (insets). (C) Kaplan-Meier survival curves of primary PDGFB-driven Il1b WT tumors in Il1b–/– and WT recipient animals. Mantel-Cox and Gehan-Breslow-Wilcoxon tests. (D) Schematic illustration of orthotopic transplant of primary PDGFB-driven Il1 WT tumors into WT and Il1b–/– recipient animals to determine the effects on tumor volume during early tumor evolution. (E) Comparison of tumor volumes during early tumor evolution between tumors transplanted in WT (n = 9) and Il1b–/– (n = 9) recipient animals.*P < 0.05; ***P < 0.001; ****P < 0.0001.
Figure 4
Figure 4. scRNA-Seq reveals reduction in inflammatory monocytes in Il1b–/–;Ntv-a mice.
(A) UMAP dimensionality reduction of the scRNA-Seq data of tumors isolated from WT;Ntv-a (black, n = 3), Il1b–/–;Ntv-a (red, n = 3), and Il1a–/–;Il1b–/–;Ntv-a (blue, n = 3) mice. (B) UMAP of single cells in A colored by annotated cell class. (C) Il1a, Il1b, and Rfp expression overlayed on the same UMAP coordinates. (D) UMAP dimensionality reduction of myeloid cells in the tumors subclustered and colored by annotated myeloid subtypes. (E) Dot plot of selected marker genes defining different myeloid subtypes. (F) Composition of myeloid cell subpopulations in tumors generated in WT;Ntv-a, Il1b–/–;Ntv-a and Il1a–/–;Il1b–/–;Ntv-a mice. Two-tailed Student’s t test.*P < 0.05.
Figure 5
Figure 5. Il1b ablation reduces the influx of inflammatory monocytes and DC2s into tumors.
(A) t-Distributed stochastic neighbor embedding (tSNE) plots of spectral flow cytometry illustrating the tumor cell/myeloid composition in WT;Ntv-a (n = 5) and Il1b–/–;Ntv-a mice (n = 5) bearing PDGFB-driven GBM. (B and C) Gating strategy for myeloid cells, discriminating between resident brain MG and BMDM, with corresponding quantification dot graphs. Two-tailed Student’s t test. (D) Illustration of FlowSOM differentiating subtypes of BMDMs. (E) Representative contour plots for gating monocytes (Ly6chi), differentiated macrophages (Ly6clo/Neg), and neutrophils (Ly6g+). (F) Quantification of myeloid cell subtypes depicted in E. Two-tailed Student’s t test. (G) Representative plots and quantification of DC2 populations in WT;Ntv-a and Il1b–/–;Ntv-a mice bearing PDGFB-driven GBM. Two-tailed Student’s t test. (H) tSNE plots and quantification of lymphoid cells by spectral flow cytometry (n = 7 for both groups). Two-tailed Student’s t test.*P < 0.05; **P < 0.01.
Figure 6
Figure 6. IL-1β induces NF-κB pathway activation in PDGFB-driven GBM cell cultures.
(A) Immunoblot showing NF-κB pathway components in both PDGFB-driven (n = 3) and Nf1-silenced (n = 2) mGBM cultures in vitro. (B and C) NF-κB pathway components in response to IL-1β treatment of PDGFB-driven GBM cells (B) or Nf1-silenced GBM cells (C) in FBS-containing medium. Quantification with triplicate experiments. ANOVA test. n = 3; n = 2, respectively. (D) Western blot and quantifications (E) showing STAT-3 and NF-κB phosphorylation in MES cell lines in the presence of NF-κB pathway inhibitors. (F) Schematic illustration of MES cell line cultured in the presence of an NF-κB pathway inhibitor with MCP expression examined by quantitative reverse-transcriptase PCR (qRT-PCR) or ELISA. (G) MCP mRNA expression examined by qRT-PCR. One-way ANOVA with Tukey’s post hoc comparisons. n = 4 for each group. (H) Expression of MCPs at the protein level examined by ELISA for 24 hours (H) or 48 hours (I) after NF-κB inhibitor treatment. One-way ANOVA with Tukey’s post hoc comparisons. n = 3 for each group. One-way ANOVA with Tukey’s post-hoc comparisons.*P < 0.05; **P < 0.01; ***P < 0.001; ****P < 0.0001.
Figure 7
Figure 7. scRNA-Seq and Aurora immune phenotyping of Nf1 mGBM generated in Il1b–/–;Ntv-a and Il1a–/–;Il1b–/–;Ntv-a mice.
(A) Schematic illustration of experimental design. (B) Kaplan-Meier survival curves of Nf1-silenced tumors generated in WT;Ntv-a, Il1b–/–;Ntv-a, and Il1a–/–Il1b–/–;Ntv-a mice. Survival curves were also created when mice were stratified by sex. Curves were compared by log-rank (Mantel-Cox) test; no significance was found. (C) UMAP dimensionality reduction of the scRNA-Seq data of tumors isolated from WT;Ntv-a (black, n = 3), Il1b–/–;Ntv-a (red, n = 3), and Il1a–/–;Il1b–/–;Ntv-a (blue, n = 3) mice. (D) UMAP of single cells in C colored by annotated broad cell classes. (E) Il1a, Il1b, and Rfp expression overlayed on the same UMAP coordinates. (F) UMAP dimensionality reduction of myeloid cells in the tumors subclustered and colored by annotated myeloid subtypes. (G) Dot plot of selected marker genes defining myeloid subtypes. (H) Composition of myeloid cell subpopulations in tumors generated in WT;Ntv-a, Il1b–/–;Ntv-a and Il1a–/–;Il1b–/–;Ntv-a mice. (I and J) tSNE plots of myeloid cells (I) and lymphocytes (J) and their quantification as examined by spectral flow cytometry for each genotype. n = 7, 6, and 6, respectively.
Figure 8
Figure 8. Genetic ablation of Il1a/b has no impact on the survival of PDGFB-driven GBM-bearing mice.
(A) Kaplan-Meier survival curves of PDGFB-driven tumors generated in WT;Ntv-a and Il1a–/–;Il1b–/–;Ntv-a mice. (B) Histogram and quantification of CD3+ T cells examined by spectral flow cytometry. Two-tailed Student’s t test. n = 5 and 7, respectively. (C) Plots of CD4+ T cells and quantification examined by spectral flow cytometry. Two-tailed Student’s t test. (D) UMAP dimensionality reduction of all cells examined by scRNA-Seq and colored by expression of the IFN module derived by WGCNA. (E) Interconnected graph showing the top 30 most coexpressed genes in the IFN module. (F) Sample-averaged distributions of IFN module score in myeloid cell types grouped by genotype (n = 3 each group). Two-tailed Student’s t test. (G) UMAP dimensionality reduction of tumor cells, colored by assignment to 15 tumor clusters. (H) IFN module score overlayed on the same UMAP coordinates. (I) Sample-averaged distributions of IFN module score in cluster T10 grouped by genotype. (J) Per sample distributions of proportion of cycling cells in high IFN module score cells (IFN module score > 0) across malignant cells grouped by genotype. (K) Sample-averaged distributions of quiescent, stem-like module score in cluster T10 grouped by genotype. (L) qPCR analysis of expression of genes associated with stemness signatures in tumors generated in WT;Ntv-a, Il1b–/–;Ntv-a, and Il1a–/–;Il1b–/–;Ntv-a mice. n = 10 each group. Two-tailed Student’s t test. (M) IHC analysis of CD44 with quantification (n = 5, 4, and 6, respectively). One-way ANOVA with Tukey’s post-hoc test. Scale bars: 50 μm; 20 μm (insets). *P < 0.05; **P < 0.01; ***P < 0.001.
Figure 9
Figure 9. Intratumoral anti–IL-1β antibody or IL-1Ra administration prolongs survival of GBM-bearing mice.
(A) Illustration of experimental design. (B) Trypan blue dye used to visualize drug delivery efficiency. Dotted line outlines tumor. (C) Kaplan-Meier survival curves of PDGFB-driven tumor-bearing WT;Ntv-a mice following treatment with vehicle anti–IL-1β antibody or IL1R antagonist. Mantel-Cox test. n = number of mice. (D) Representative IBA1 IHC images of tumors from vehicle-, anti–IL-1β antibody, or IL1R antagonist-treated tumor-bearing mice. (E) Quantification of IBA1-positive tumoral areas. One-way ANOVA, Tukey’s multiple comparison test. n = 7, 5, and 6, respectively. (F) IBA1 expression correlates with survival of tumor-bearing mice. Colors of data points match the genotypes depicted in E. (G) Photomicrographs of tumors stained≈with DAPI (blue) and CD45 (green) to guide ROI selection for NanoString GeoMx multiplexed protein quantification. Scale bars: 25 μm. (H) Quantification of protein expression by GeoMx assay. Heatmap color intensity indicates log2 expression. Student’s t test compared with isotype controls. n = 4 mice per group.*P < 0.05; **P < 0.01.

Comment in

References

    1. Stupp R, et al. Radiotherapy plus concomitant and adjuvant temozolomide for glioblastoma. N Engl J Med. 2005;352(10):987–996. doi: 10.1056/NEJMoa043330. - DOI - PubMed
    1. Chen Z, et al. Cellular and molecular identity of tumor-associated macrophages in glioblastoma. Cancer Res. 2017;77(9):2266–2278. doi: 10.1158/0008-5472.CAN-16-2310. - DOI - PMC - PubMed
    1. Kaffes I, et al. Human Mesenchymal glioblastomas are characterized by an increased immune cell presence compared to Proneural and classical tumors. Oncoimmunology. 2019;8(11):e1655360. doi: 10.1080/2162402X.2019.1655360. - DOI - PMC - PubMed
    1. Wang Q, et al. Tumor evolution of glioma-intrinsic gene expression subtypes associates with immunological changes in the microenvironment. Cancer Cell. 2018;33(1):152. doi: 10.1016/j.ccell.2017.12.012. - DOI - PMC - PubMed
    1. Hara T, et al. Interactions between cancer cells and immune cells drive transitions to mesenchymal-like states in glioblastoma. Cancer Cell. 2021;39(6):779–792. doi: 10.1016/j.ccell.2021.05.002. - DOI - PMC - PubMed

Publication types