. 2023 Sep 21;21(9):e3002303.
doi: 10.1371/journal.pbio.3002303. eCollection 2023 Sep.

Highlighter: An optogenetic system for high-resolution gene expression control in plants

Affiliations

Highlighter: An optogenetic system for high-resolution gene expression control in plants

Bo Larsen et al. PLoS Biol. .

Abstract

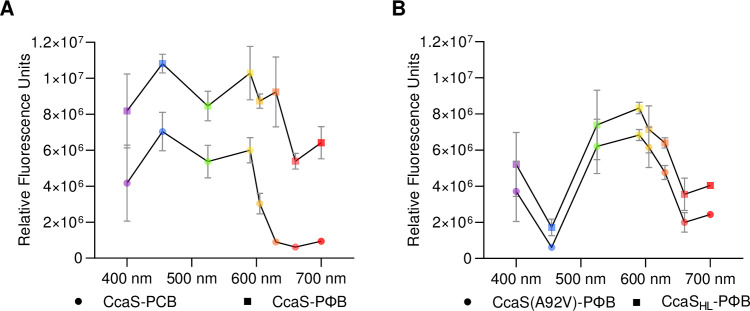
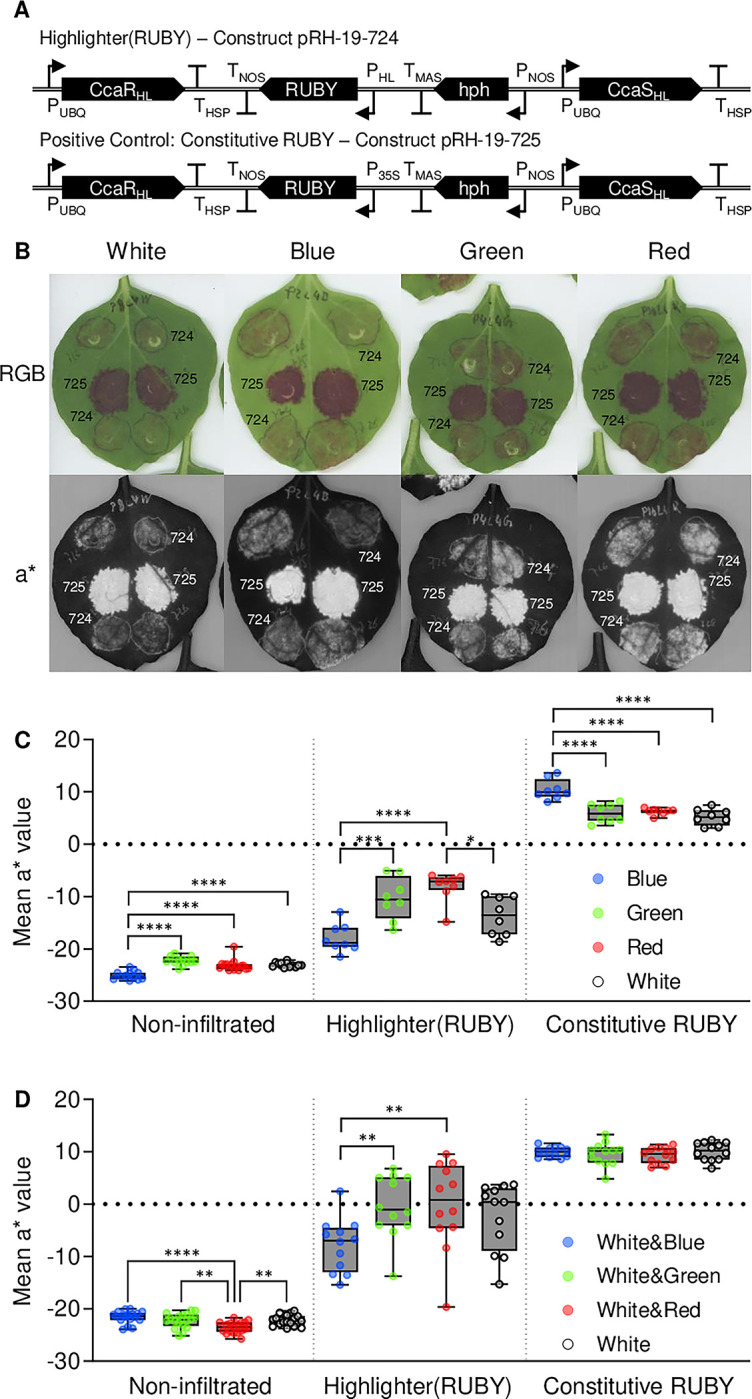
Optogenetic actuators have revolutionized the resolution at which biological processes can be controlled. In plants, deployment of optogenetics is challenging due to the need for these light-responsive systems to function in the context of horticultural light environments. Furthermore, many available optogenetic actuators are based on plant photoreceptors that might crosstalk with endogenous signaling processes, while others depend on exogenously supplied cofactors. To overcome such challenges, we have developed Highlighter, a synthetic, light-gated gene expression system tailored for in planta function. Highlighter is based on the photoswitchable CcaS-CcaR system from cyanobacteria and is repurposed for plants as a fully genetically encoded system. Analysis of a re-engineered CcaS in Escherichia coli demonstrated green/red photoswitching with phytochromobilin, a chromophore endogenous to plants, but also revealed a blue light response likely derived from a flavin-binding LOV-like domain. We deployed Highlighter in transiently transformed Nicotiana benthamiana for optogenetic control of fluorescent protein expression. Using light to guide differential fluorescent protein expression in nuclei of neighboring cells, we demonstrate unprecedented spatiotemporal control of target gene expression. We implemented the system to demonstrate optogenetic control over plant immunity and pigment production through modulation of the spectral composition of broadband visible (white) light. Highlighter is a step forward for optogenetics in plants and a technology for high-resolution gene induction that will advance fundamental plant biology and provide new opportunities for crop improvement.


Conflict of interest statement

The authors have declared that no competing interests exist.

Figures

Fig 1
Fig 1. Schematic representation of the Highlighter system and function.
Highlighter is the CcaS-CcaR system repurposed for in planta function. The repurposed CcaS, CcaR and synthetic promoter are denoted with subscript “HL.” Upon exposure to activating light conditions, CcaSHL phosphorylates CcaRHL, which triggers enhanced binding to its cognate promoter, PHL, to induce expression of a target gene of interest. CcaSHL and CcaRHL are expressed as a single transcriptional unit from a promoter-terminator expression cassette through use of a F2A30 ribosomal skipping sequence. NLS, nuclear localization signal; TAD, transcription activation domain.
Fig 2
Fig 2. Chromatic response of CcaS-CcaR system variants in E. coli.
(A) Chromophore-dependent photoswitching behavior of the CcaS-CcaR system in E. coli with PCB and PΦB with unmodified CcaS and CcaR proteins. System output in response to light stimuli was quantified via sfGFP fluorescence and presented as RFUs; RFUs are defined as the mean estimated sfGFP fluorescence from cell cultures with OD600 nm = 0.2. Bacterial cultures were exposed to light stimuli (approximately 10 μmol m-2 s-1) generated using LEDs with peak wavelength emissions around 400 nm, 455 nm, 525 nm, 590 nm, 605 nm, 630 nm, 660 nm, and 695 nm. (B) System responses for CcaS(A92V) and CcaSHL co-produced with PΦB. Symbols are colored according to light treatment and depict mean fluorescence from 3 replicate experiments, each comprising 3 biological replicates for each light treatment. SEM are presented for each light treatment. The underlying data for panels A and B is in S1 Data. LED, light-emitting diode; PCB, phycocyanobilin; RFU, relative fluorescence unit; sfGFP, superfolder green fluorescent protein.
Fig 3
Fig 3. Deployment of Highlighter in N. benthamiana leaves for controlling fluorescent protein levels with monochromatic light and darkness.
N. benthamiana leaves were infiltrated with A. tumefaciens for delivery of Highlighter(YFP) and kept in darkness overnight before receiving continuous treatments for approximately 3 days with blue, green, and red light or darkness. Light was delivered with LEDs (100 μmol m-2 s-1) with peak wavelength emissions λ ~ 455 nm, 525 nm, and 660 nm, respectively. (A) Representative confocal images demonstrating nuclear YFP and RFP fluorescence in light-treated samples, alongside merged images of the YFP and RFP fluorescence and finally the calculated YFP/RFP ratios (ratiometric). (B) Quantification of YFP/RFP ratios in light-treated samples. (C) Relative gene expression levels in light-treated samples. In (B) and (C), means and SEM are presented for 3 biological independent experiments. Individual experimental means are depicted with circles colored according to light treatment. n per mean, i.e., per circle, in (B) is 22 to 168 nuclei from 3 to 4 infiltrated spots across 3 to 4 leaves. In (C), for each biological replica mean, leaf material from 4 infiltrated spots across 4 leaves were combined and analyzed using quadruple technical qPCR replicates. Highlighter(YFP) Vector ID: pBL413-024-257 (S1 Table). * P < 0.05 and ** P < 0.01. Leaves were spot infiltrated with OD600 nm = 0.4 A. tumefaciens cultures. The underlying data for panels B and C is available in S2 Data. LED, light-emitting diode; YFP, yellow fluorescent protein.
Fig 4
Fig 4. Transcriptional behavior of the Highlighter system in N. benthamiana leaves during light-dark cycling and system reversibility.
(A) Quantification of YFP target gene transcript levels during light-dark cycling in N. benthamiana leaves transiently transformed with Highlighter(YFP). Prior to subjecting infiltrated leaves to light-dark cycling, the leaves were kept dark overnight and pretreated for 2 days with monochromatic blue light, red light, or kept in darkness. The samples then continued their previous light treatments for 12 h, before being dark treated for 8 h, and were returned to their original light treatments for another 12 h. The gray column in the graph denotes the dark treatment. (B) Highlighter system reversibility test. N. benthamiana leaves infiltrated with Highlighter(YFP) or the Highlighter control construct for constitutive YFP expression were kept dark overnight and red light treated for 2 days with monochromatic red light before (at 0 h) being subjected to monochromatic blue light. Means and SEM are presented for 3 biological independent experiments for each time point. For each treatment and time point, in each of the biological replicates, leaf material from 4 infiltrated spots across 4 leaves were combined for analysis using quadruple technical qPCR replicates. Highlighter(YFP) Vector ID: pBL413-024-257; Constitutive YFP Vector ID: pBL413-024-259 (S1 Table). Leaves were spot infiltrated with OD600 nm = 0.4 A. tumefaciens cultures. The underlying data for panels A and B is in S3 Data. YFP, yellow fluorescent protein.
Fig 5
Fig 5. High-resolution control of target gene induction in N. benthamiana leaves using laser illumination.
After infiltration with Agrobacterium for delivery of Highlighter(YFP) (A) or the constitutive YFP expression control (B), samples were kept in the dark overnight prior to continuous blue light treatment with LEDs (100 μmol m-2 s-1). Samples were blue light treated until 2.5 days post infiltration to minimize target gene expression and then subjected to blue and red light treatments with lasers (initiation of laser treatments are defined as 0 h in (C)); 442 nm blue and 633 nm red lasers were used to irradiate the area outlined in blue and red, respectively. Images in (A) and (B) are ratiometric representations of the YFP/RFP ratios observed after 38 h of light treatment (five 7 h light treatments interrupted by confocal imaging). Images are sum projections of z-stacks spanning multiple cell layers. Cellular resolution measurements of individual nuclear YFP/RFP ratios for Highlighter(YFP) are available in S6 Fig. (C) Temporal quantification of YFP/RFP ratios for laser-based target gene induction in (A) and (B). Highlighter(YFP) data is represented with triangles and data for constitutive YFP expression is represented with squares. Mean and SEMs are presented for each time point. The first time point where there is a significant difference between the nuclear YFP/RFP ratios in the 442 nm and 633 nm treated Highlighter(YFP) infiltrated area is marked with *** (P = 0.0003). (D) Temporal quantification of YFP target gene transcript levels during blue or red light treatments. Again, samples were kept in the dark overnight and treated continuously with blue light until 2.5 days post infiltration (here defined as 0 h) to minimize target gene expression levels. Infiltrated leaves were then exposed to blue and red LED light treatments (λ ~ 455 nm and 660 nm, respectively, 100 μmol m-2 s-1) for 36 h and leaf tissue was sampled every 12 h. Means and SEM are presented in (D) for 3 biological independent experiments. For each time point in each of the biological replicates in (D), leaf material from 4 infiltrated spots across 4 leaves were combined for analyzed using quadruple technical qPCR replicates. The first time point with a significant difference between the relative gene expression levels in blue and red treated Highlighter(YFP) samples is marked with ** (P = 0.0015). Highlighter(YFP) Vector ID: pBL413-024-257; Constitutive YFP Vector ID: pBL413-024-259 (S1 Table). Leaves were spot infiltrated with OD600 nm = 0.4 A. tumefaciens cultures. The underlying data for panels C and D is in S4 Data. LED, light-emitting diode; YFP, yellow fluorescent protein.
Fig 6
Fig 6. Highlighter controlled immune responses in transiently transformed N. benthamiana leaves.
(A) Highlighter constructs used to assert control over immune responses in N. benthamiana leaves in response to light treatment. In Highlighter(NRC4D478V), construct 375, NRC4D478V is under control of the Highlighter system, via PHL, whereas the Highlighter construct for constitutive NRC4D478V expression, construct 378, is a positive control used for normalization. The Highlighter construct missing CcaRHL, construct 381, is a negative control construct used for background subtraction. (B) Representative images of HR-induced fluorescence in response to NRC4D478V expression under blue, green, orange, and red light; λ ~ 455 nm, 525 nm, 630 nm, and 660 nm, respectively. LUT is the Fire LUT, ImageJ. Strong UV-fluorescent signals are observed at the center of Agrobacterium-infiltrated spots due to tissue damage from the syringe infiltration and is also clearly observed in (C). (C) Images of leaves in (B) for demonstrating HR-associated cell death progression. Images in panels B and C were acquired approximately 4 DPI. (D) Quantification of HR regulated by Highlighter-controlled NRC4D478V expression under blue, green, orange, and red LED light (λ ~ 455 nm, 525 nm, 630 nm, and 660 nm, 100 μmol m-2 s-1 light intensity). HRfluorescence=InducibleconstructfluorescenceNegativecontrolfluorescencePositivecontrolfluorescenceNegativecontrolfluorescence (E) Highlighter control of HR levels in white light regimes supplemented with blue, green, or red light. Enriched white light regimes were defined as 50 μmol m-2 s-1 light from a 5,700 K white light LED channel supplemented with 50 μmol m-2 s-1 light from blue, green, or red channels with λ ~ 455 nm, 525 nm, and 660 nm, 100 μmol m-2 s-1 total light intensity. Mean and SEM are presented for each treatment and symbols represent average HR responses from 3 to 5 biological repeats; n per biological average is 3 to 12 for monochromatic data in (D) and 5–14 for enriched white light data (E). * P < 0.05 and ** P < 0.01. Highlighter(NRC4D478V) Vector ID: pBL413-037-375; Constitutive NRC4D478V Vector ID: pBL413-037-378; Highlighter(NRC4D478V) ΔCcaRHL Vector ID: pBL413-037-381 (S1 Table). Leaves were spot infiltrated with OD600 nm = 0.2 A. tumefaciens cultures. The underlying data for panels D and E is in S5 Data. DPI, days post infiltration; HR, hypersensitive response; LED, light-emitting diode.
Fig 7
Fig 7. Comparison of Highlighter controlled expression of the betalain-producing RUBY reporter in monochromatic and broad-spectrum white light conditions.
N. benthamiana leaves were infiltrated with the betalain-producing Highlighter(RUBY) reporter construct (Vector ID pRH-19-724 (S1 Table)) and a positive control for constitutive RUBY expression (Vector ID pRH-19-725 (S1 Table)). Plants were moved from darkness to monochromatic light or broad-spectrum white light treatments after 12 h. Monochromatic light treatments were 100 μmol m-2 s-1 blue (λ ~ 455 nm), green (λ ~ 525 nm), and red (λ ~ 660 nm) light. White light and modulated white treatments were similarly either 100 μmol m-2 s-1 white light (5,700 K) or mixes of 50 μmol m-2 s-1 white light with 50 μmol m-2 s-1 light from the aforementioned blue, green, and red light LEDs. Hence, the light intensities in all applied light regimes were 100 μmol m-2 s-1. (A) Infiltrated leaves treated with white light or monochromatic blue, green, or red light. Representative images are presented in RGB color space in the top row and their respective a* component, i.e., the red versus green component of the Commission Internationale de l´Eclairage L*a*b* color space (CIELAB), are presented in the row below. (B, C) Quantification of mean a* values for non-infiltrated spots, Highlighter(RUBY) infiltrated spots, and spots infiltrated with a constitutive RUBY expression control. The monochromatic and mixed light experiments were completed 2 and 3 times, respectively, with similar results. Box and whiskers plots, min to max, are presented for each treatment and symbols represent average a* values from infiltrated spots. The white light and monochromatic data in (B) comprises 8 to 15 infiltrated spots per light treatment. The white light and modulated white light data in (C) comprises 12 to 18 infiltrated spots per light treatment. Statistics are Tukey’s multiple comparisons test, ** P < 0.05 and *** P < 0.01 and **** P < 0.001. Leaves were spot infiltrated with OD600 nm = 0.4 A. tumefaciens cultures. The underlying data for panels C and D is in S6 Data. LED, light-emitting diode.

Similar articles

Cited by

References

    1. Aldridge S, Teichmann SA. Single cell transcriptomics comes of age. Nat Commun. 2020. Aug 27;11(1):4307. doi: 10.1038/s41467-020-18158-5 ; PMCID: PMC7453005. - DOI - PMC - PubMed
    1. Shaw R, Tian X, Xu J. Single-Cell Transcriptome Analysis in Plants: Advances and Challenges. Mol Plant. 2021. Jan 4;14(1):115–126. doi: 10.1016/j.molp.2020.10.012 Epub 2020 Nov 2. . - DOI - PubMed
    1. Rowe JH, Jones AM. Focus on biosensors: Looking through the lens of quantitative biology. Quantitative Plant Biology. Cambridge University Press; 2021;2:e12. - PMC - PubMed
    1. Walia A, Waadt R, Jones AM. Genetically Encoded Biosensors in Plants: Pathways to Discovery. Annu Rev Plant Biol. 2018. Apr 29;69:497–524. doi: 10.1146/annurev-arplant-042817-040104 . - DOI - PubMed
    1. Chen X, Yang Z. Biosensors for Single-Cell Analysis. Academic Press; 2021. Chapter 3. Biosensors for single-cell metabolomics characterization. p. 37–70. doi: 10.1016/B978-0-323-89841-6.00001–3 ISBN: 978-0-323-89841-6. - DOI

Publication types

Supplementary concepts