. 2023 Sep 26;120(39):e2300348120.
doi: 10.1073/pnas.2300348120. Epub 2023 Sep 21.

Peptidergic modulation of motor neuron output via CART signaling at C bouton synapses

Affiliations

Peptidergic modulation of motor neuron output via CART signaling at C bouton synapses

Panagiotis E Eleftheriadis et al. Proc Natl Acad Sci U S A. .

Abstract

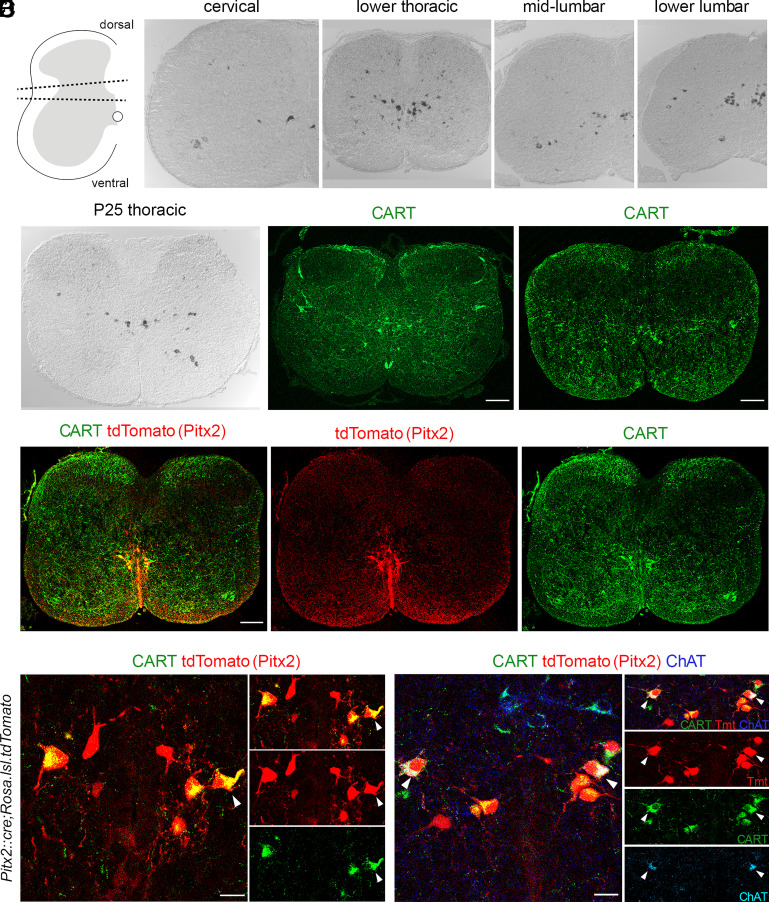
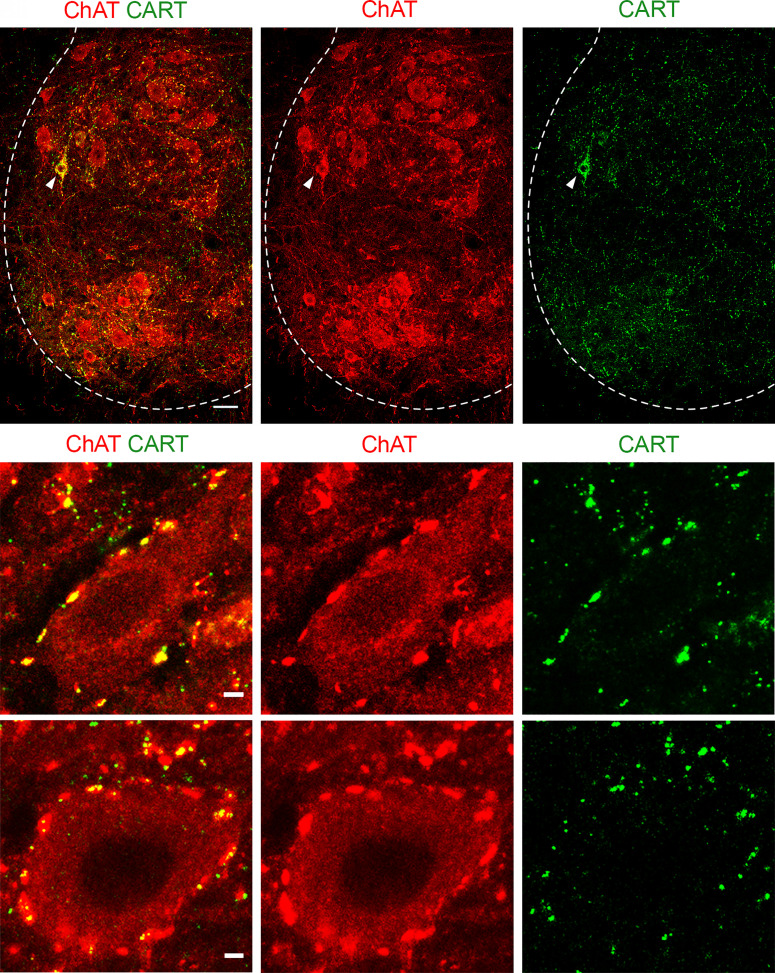
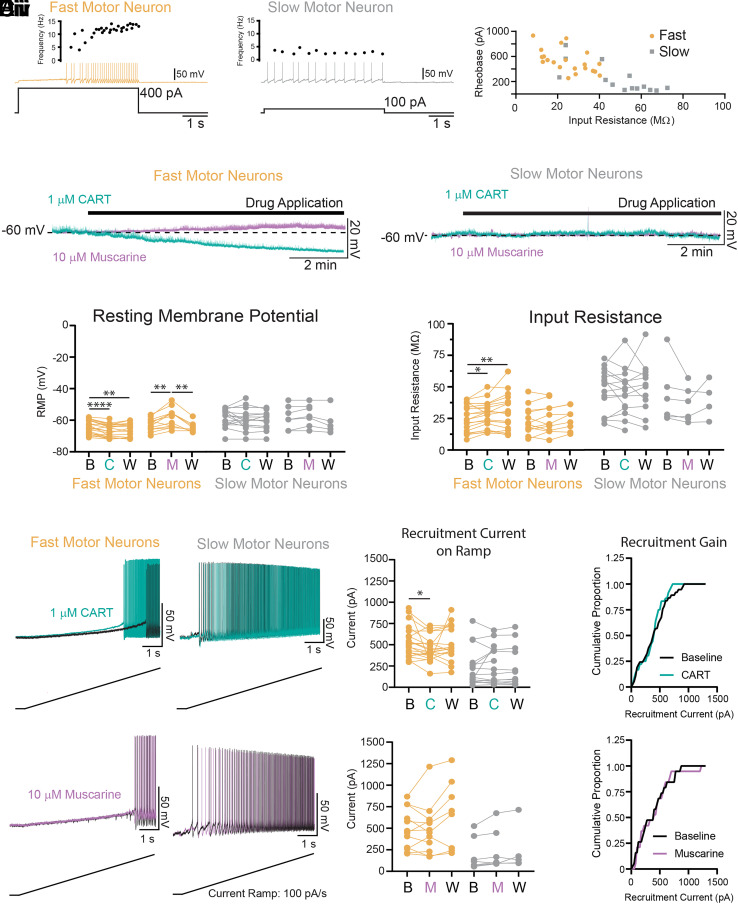
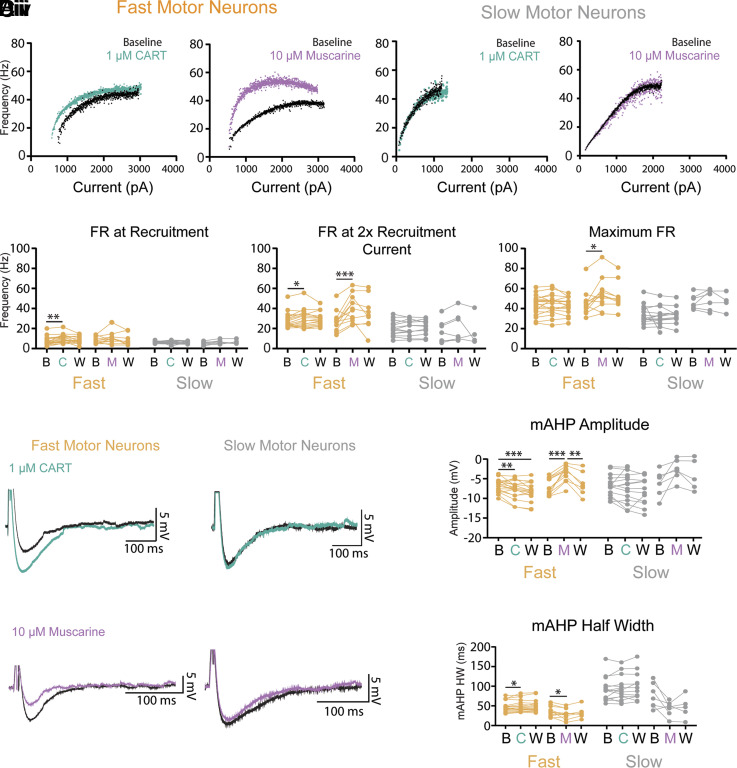
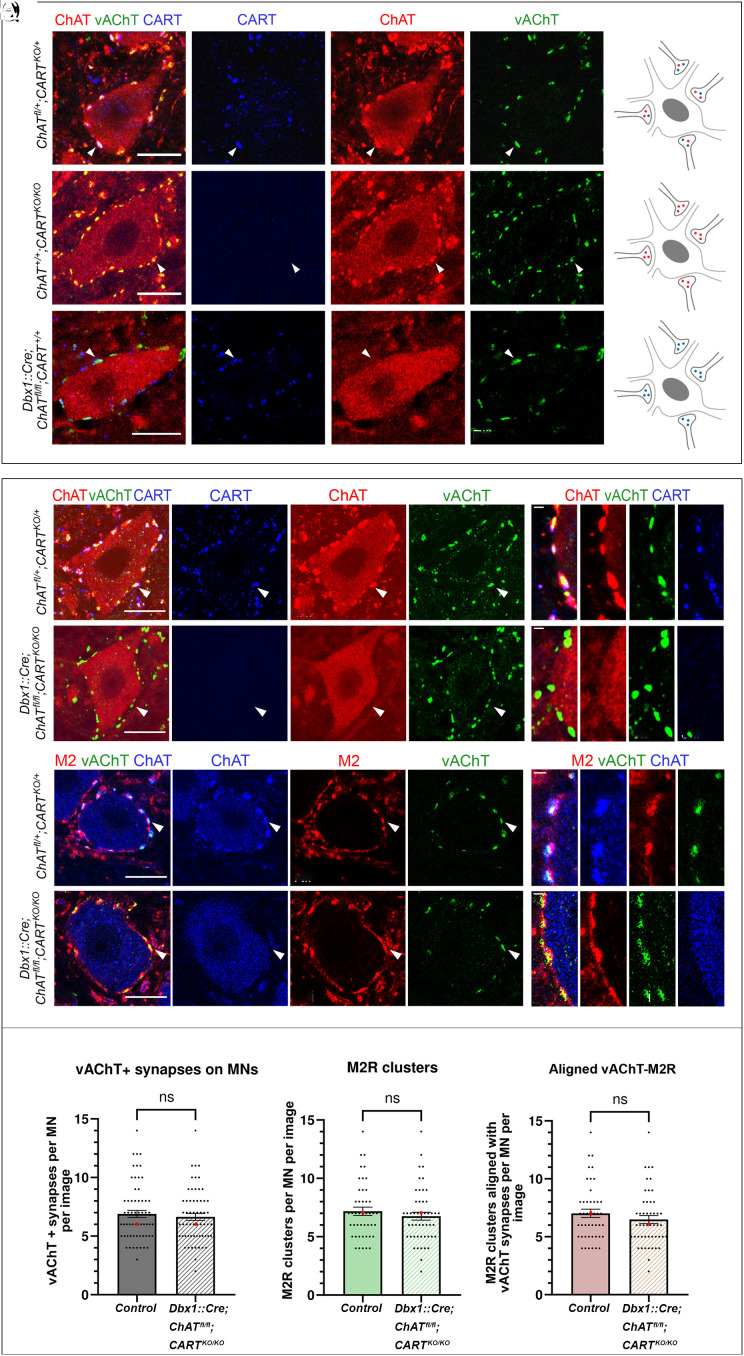
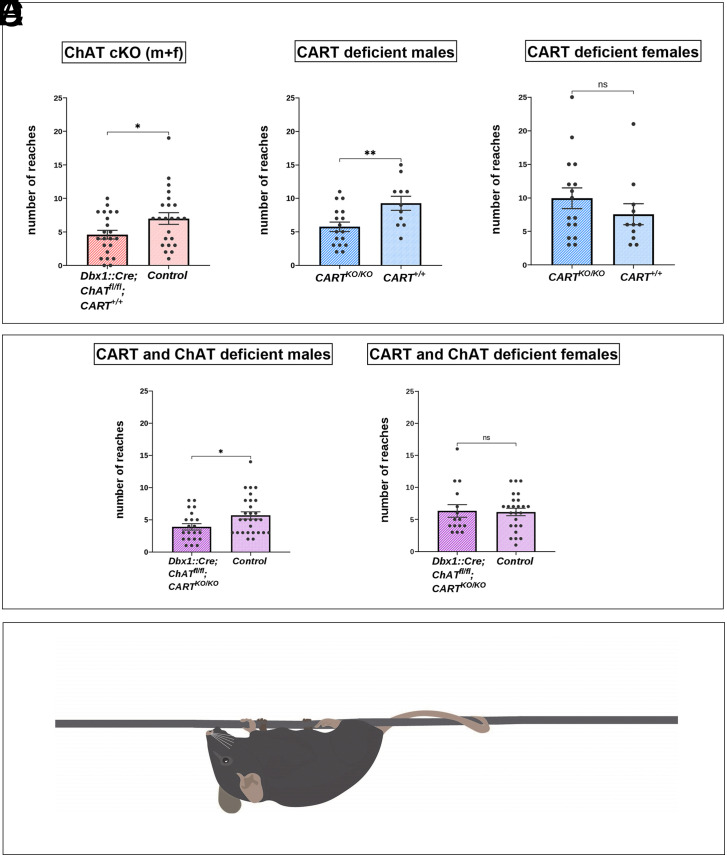
The intensity of muscle contraction, and therefore movement vigor, needs to be adaptable to enable complex motor behaviors. This can be achieved by adjusting the properties of motor neurons, which form the final common pathway for all motor output from the central nervous system. Here, we identify roles for a neuropeptide, cocaine- and amphetamine-regulated transcript (CART), in the control of movement vigor. We reveal distinct but parallel mechanisms by which CART and acetylcholine, both released at C bouton synapses on motor neurons, selectively amplify the output of subtypes of motor neurons that are recruited during intense movement. We find that mice with broad genetic deletion of CART or selective elimination of acetylcholine from C boutons exhibit deficits in behavioral tasks that require higher levels of motor output. Overall, these data uncover spinal modulatory mechanisms that control movement vigor to support movements that require a high degree of muscle force.

Keywords: C boutons; acetylcholine; cocaine and amphetamine regulated transcript; motor control; spinal cord.


Conflict of interest statement

The authors declare no competing interest.

Figures

Fig. 1.
Fig. 1.
CART and Pitx2 expression in the spinal cord partially overlap. (A) Schematic representation of the tissue dissected for the ventral vs. dorsal horn microarray screen. Tissue between dotted lines was discarded. (ΒE) Cart mRNA detection in all levels of P8 mouse spinal cord as revealed by in situ hybridization. (F) Cart mRNA detection in P25 spinal cord. The presence of Cart mRNA is mainly concentrated in the pericentral canal region as well as in some motor neuron somata. (G and H) CART neuropeptide detection in spinal cord cross sections of P8 (G) and P0 mice (H). (IIii) Partial codetection (yellow) of CART (green) and tdTomato (red) in the Pitx2 expressing neurons from spinal cords of Pitx2::Cre;Rosa.lsl.tdTomato mice (P0). (J, Ji and Jiii) High magnification of the pericentral canal region (J), cropped neurons presented in separate panels [merge-Ji, tdTomato (red)-Jii, CART (green)-Jiii]. Some tdTomato+ neurons coexpress CART (tdTomato+/CART+ neurons), only one is indicated by a white arrowhead for simplicity; tdTomato+/CART− neurons are also observed (P0). (KKiv). V0c cholinergic neurons coexpress CART (tdTomato+/ChAT+/CART+, red/blue/green, respectively, white arrowheads, K). Cropped neurons presented in separate panels [merge-Ki, tdTomato (red)-Kii, CART (green)-Kiii, ChAT (Cyan)-Kiv]. Noncholinergic (V0g) Pitx2 neurons can be subdivided into CART expressing (tdTomato+/CART+/ChAT−, red and green) and non expressing (tdTomato+/CART−/ChAT−, red only) (P0). [Scale bars, 100 μm (GI), 20μm (J and K).]
Fig. 2.
Fig. 2.
CART detection in C bouton synapses and in a subset of spinal motor neurons. (A, Ai and Aii) Immunohistochemistry in P25 mice with antibodies against ChAT (red) and CART (green) reveals the presence of CART puncta in the motor neuron area, specifically on motor neuron membranes. CART immunoreactivity is also observed in a few motor neuron somata (white arrowhead). (Scale bar, 20 μm.) (B, Bi and Bii) Colocalization of ChAT (red) and CART (green) in the cholinergic C bouton synapses on motor neurons of P8 mice. (C, Ci and Cii) C bouton synapses of P25 mice also contain CART. (Scale bars, 2 μm (B and C).]
Fig. 3.
Fig. 3.
CART but not muscarine facilitates the recruitment of fast but not slow-type motor neurons. (Ai and Aii) Representative trace of fast (Ai: orange) and slow (Aii: gray) motor neurons identified with whole-cell patch-clamp electrophysiology. (Aiii) Scatter plot of input resistance and recruitment current (rheobase) demonstrate that fast motor neurons have a high rheobase and low input resistance, whereas slow-firing motor neurons have relatively low rheobase and high input resistance. (Bi and Bii) Representative traces depicting the effects of CART (1 μM; green) and muscarine (10 μM; purple) on the membrane potential of fast (Bi) and slow (Bii) motor neurons. (Ci) CART (C) and muscarine (M) produce opposing effects on the resting membrane potential (RMP) of fast (orange) motor neurons but do not alter the RMP of slow (gray) motor neurons. (Cii) CART (C) increases the input resistance of fast (orange) but not slow (gray) motor neurons. Muscarine (M) does not affect input resistance of fast or slow motor neurons. (Di and Dii) Representative trace of the subthreshold voltage trajectory and onset of repetitive firing during a slow depolarizing current ramp (applied at 100 pA/s) in fast (Di) and slow (Dii) motor neurons both before (black traces) and after application of 1 μM CART (green traces). (Diii) CART significantly reduces the recruitment current in fast (orange) but not slow motor neurons (gray). (Div) Cumulative proportion histogram of motor neuron recruitment currents depicts an increase in the recruitment gain of the sample of motor neurons studied before (black) and after CART (green). (Ei and Eii) Representative trace of the subthreshold voltage trajectory and onset of repetitive firing in fast (Ei) and slow (Eii) motor neurons both before (black traces) and after application of 10 μM muscarine (purple traces). (Eiii) Muscarine did not alter the recruitment current in fast (orange) or slow motor neurons (grey) and did not change the recruitment gain (Eiv). All measurement were made at baseline (B), following drug application [CART (C), muscarine (M)], and following a wash period with regular aCSF (W). Asterisks denote significance (*P < 0.05, **P < 0.01, ***P < 0.001. ****P < 0.0001) from Holm-Sidak post hoc following 2 factor (Repeated measures) ANOVA.
Fig. 4.
Fig. 4.
CART and muscarine modulate distinct components of frequency–current relationship and produce opposing control of mAHP in fast but not slow-type motor neurons. (Ai) Representative frequency–current plots depicting changes in FR during a slow (100 pA/s) depolarizing current ramp for fast motor neurons before (black) and after CART (green) or muscarine (purple). (Aii) Representative frequency–current plots depicting FR on current ramp for slow motor neurons before (black) and after CART (green) or muscarine (purple). (BiBiii) Effect of CART and muscarine on FR at recruitment, 2× recruitment current, and maximum. (Bi) CART significantly increases the FR of fast but not slow motor neurons at recruitment (minimum FR) and 2 times recruitment current (Bii) but does not alter maximal FR (Biii), whereas muscarine does not alter FR for fast motor neurons at recruitment (Bi), but does increase FR at 2 times recruitment current (Bii) and maximal FR (Biii). Neither CART nor muscarine alter FR of slow motor neurons. (Ci and Cii) Representative trace of the mAHP in fast (Ci) and slow (Cii) motor neurons both before (black traces) and after application of 1 μM CART (green traces). (Ciii and Civ) Representative trace of the mAHP in fast (Ciii) and slow (Civ) motor neurons both before (black traces) and after application muscarine (purple traces). (Di) CART significantly increases, whereas muscarine decreases the amplitude of the mAHP in fast motor neurons. Neither CART, nor muscarine, alter the mAHP amplitude of slow motor neurons. (Dii). CART significantly increases, whereas muscarine (M) decreases the half-width (HW) of the mAHP in fast motor neurons but do not alter the mAHP HW of slow motor neurons. All measurements were made at baseline (B), following drug application [CART (C), muscarine (M)], and following a wash period with regular aCSF (W). Asterisks denote significance (*P < 0.05, **P < 0.01, ***P < 0.001. ****P < 0.0001) from Holm-Sidak post hoc following 2 factor (Repeated measures) ANOVA.
Fig. 5.
Fig. 5.
Gross anatomy of C boutons remains unchanged after genetic elimination of CART and ChAT from the synapse. (AAiii) C boutons on somata of motor neurons of wild-type mice are marked by CART (blue) and the cholinergic markers ChAT (red) and vAChT (green). (B) Schematic representation of a motor neuron receiving C boutons containing acetylcholine (red) and CART (blue). (CCiii) ChAT (red) and vAChT (green) expression are not disrupted in C boutons of CARTKO/KO mice. (D) Schematic representation of a motor neuron receiving C boutons containing acetylcholine (red) only. (E–Eiii) CART (blue) and vAChT (green) expression are not disrupted following the genetic deletion of ChAT in V0c interneurons. (F) Schematic representation of a motor neuron receiving C boutons containing CART (blue) only. (GGiii) CART (blue), ChAT (red), and vAChT (green) are present in C boutons of herterozygous ChATfl/+;CARTKO/+ mice. The white arrowhead points to one representative triple-positive C bouton. (HHiii) High-magnification image showing the colocalization of CART (blue), ChAT (red), and vAChT (green) in individual C boutons. (IIiii) Despite the conditional knockout of ChAT and the complete knockout of Cart in Dbx1::Cre;ChATfl/fl;CARTKO/KO mice, the presynaptic components of C boutons remain intact, as evident by the presence of vAChT (green). The white arrowhead points to one CART−/ChAT− C bouton that expresses vAChT. (JJiii) High-magnification image showing the presence of vAChT (green) in individual C boutons that lack both ChAT and CART. (KKiii) The ChAT+/vAChT+ C boutons (blue and green respectively) on motor neurons of control ChATfl/+;CARTKO/+ mice are in close apposition to M2 muscarinic receptor clusters (red). The white arrowhead points to a ChAT+/M2+/vAChT+ C bouton. (LLiii) High-magnification image showing the alignment of the postsynaptic M2 muscarinic receptor (red) with the ChAT+/vAChT+ presynaptic part of the synapse (red and green respectively). (MMiii) Postsynaptic clustering of M2 receptors (red) with presynaptic vAChT (green) is unaltered in Dbx1::Cre;ChATfl/fl;CARTKO/KO double KO mice. The white arrowhead points to a vAChT+/M2+ synapse. (NNiii) High-magnification image showing the alignment of M2 postsynaptic muscarinic receptors (red) with the vAChT+ (green) C boutons in Dbx1cre/+;ChATfl/fl;CARTKO/KO mice. (OQ) No change was observed in the number of vAChT+ terminals (P = 0.6730, two-tailed), M2 muscarinic receptor clusters (P = 0.4402, two-tailed) or their alignment (P = 0.2880, two-tailed) despite the simultaneous elimination of ChAT and CART in C boutons. The bar charts represent the mean number of synapses per motor neuron with superimposed data points representing the data distribution. Data are presented as mean values (±SEM) and were combined from different sexes as no sex-dependent differences were observed. The median is also presented as a red dot superimposed in each graph. For panels OQ “image” corresponds to optical thickness of 1,208 μm. [Scale bars, 20 μm, (AM), 1 μm (HN).]
Fig. 6.
Fig. 6.
Behavioral effects of the complete KO of the Cart gene and the conditional KO of the ChAT gene in C boutons. Hanging wire test analysis (reaches method) for monitoring muscle strength in mice lacking ChAT in C boutons or CART or of both. Muscle strength is reflected by the number of times that each mouse reaches the end of the wire trying to escape after being positioned to suspend from the middle of a 55cm long wire (reaches). (A) Dbx1:Cre;ChATfl/fl mice (males and females combined) performed significantly fewer reaches than the control ChATfl/fl littermates (P = 0.031, two-tailed). (B) CART KO male mice performed significantly fewer reaches than the CART+/+ male mice (P = 0.008, two-tailed). (C) There were no significant differences between the CART KO female mice and the CART+/+ female mice in the number of reaches performed (P = 0.307, two-tailed). (D) Dbx1::Cre;ChATfl/fl;CARTKO/KO male mice performed significantly fewer reaches than the control male mice (P = 0.029, two-tailed). (E) There were no significant differences between the Dbx1::Cre;ChATfl/fl;CARTKO/KO female mice and the control female mice in the number of reaches performed (P = 0.872, two-tailed). Data are expressed as mean (±SEM). *P < 0.05, **P < 0.01. (F) Illustration of the mice in the starting position of the hanging wire test suspended by all four limbs from the middle of the wire in the behavioral apparatus.

References

    1. Gosgnach S., et al. , Delineating the diversity of spinal interneurons in locomotor circuits. J. Neurosci. 37, 10835–10841 (2017). - PMC - PubMed
    1. Goulding M., Circuits controlling vertebrate locomotion: Moving in a new direction. Nat. Rev. Neurosci. 10, 507–518 (2009). - PMC - PubMed
    1. Henneman E., Relation between size of neurons and their susceptibility to discharge. Science 126, 1345–1347 (1957). - PubMed
    1. Burke R. E., Levine D. N., Tsairis P., Zajac F. E., Physiological types and histochemical profiles in motor units of the cat gastrocnemius. J. Physiol. 234, 723–748 (1973). - PMC - PubMed
    1. Milner-Brown H. S., Stein R. B., Yemm R., Changes in firing rate of human motor units during linearly changing voluntary contractions. J. Physiol. 230, 371 (1973). - PMC - PubMed

Publication types

LinkOut - more resources