. 2023 Sep 21;19(9):e1011432.
doi: 10.1371/journal.pcbi.1011432. eCollection 2023 Sep.

A platform-independent framework for phenotyping of multiplex tissue imaging data

Affiliations

A platform-independent framework for phenotyping of multiplex tissue imaging data

Mansooreh Ahmadian et al. PLoS Comput Biol. .

Abstract

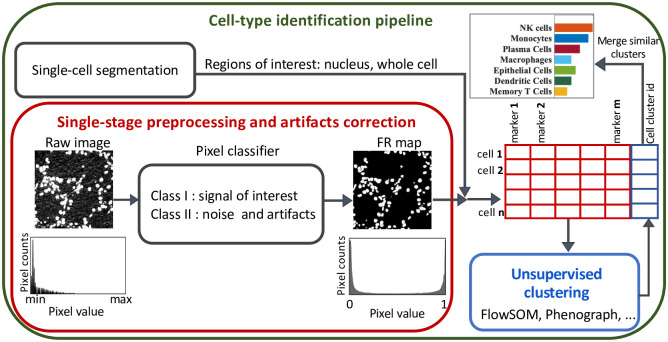
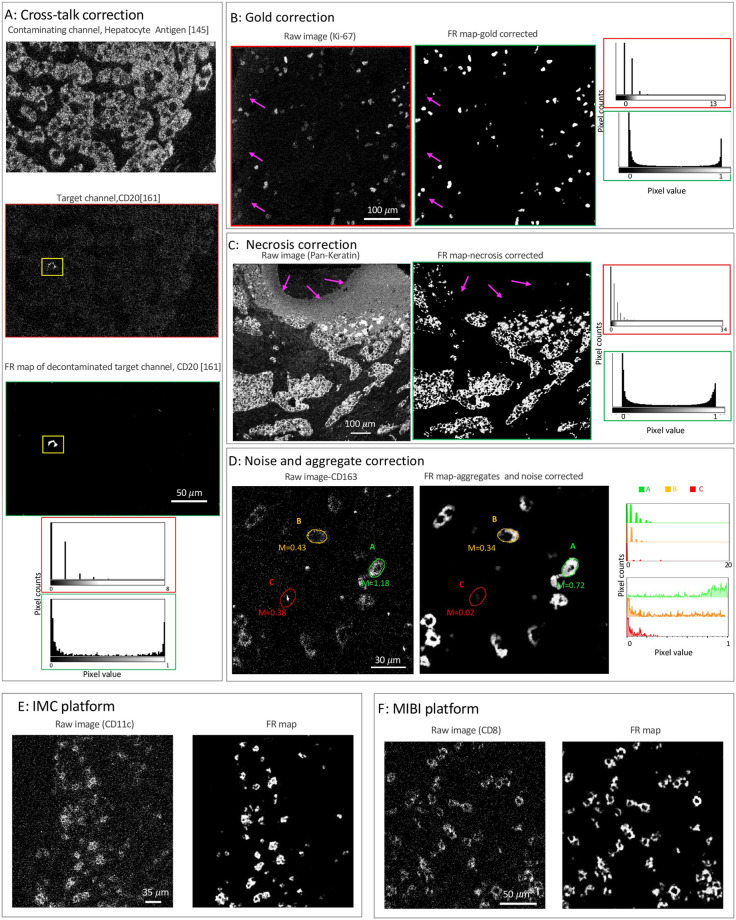
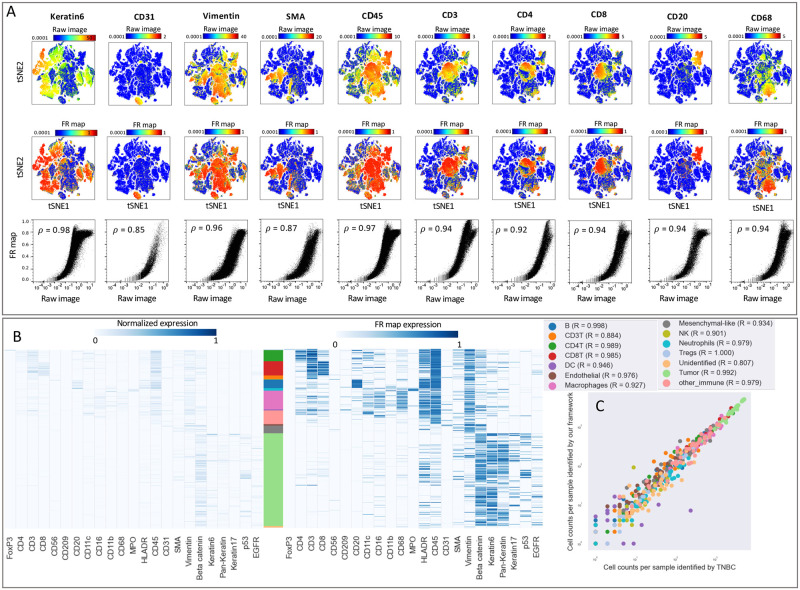
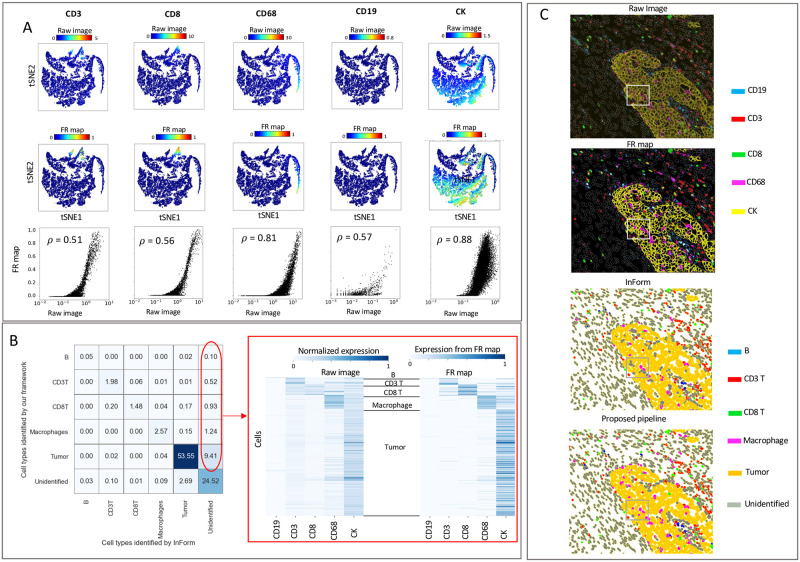
Multiplex imaging is a powerful tool to analyze the structural and functional states of cells in their morphological and pathological contexts. However, hypothesis testing with multiplex imaging data is a challenging task due to the extent and complexity of the information obtained. Various computational pipelines have been developed and validated to extract knowledge from specific imaging platforms. A common problem with customized pipelines is their reduced applicability across different imaging platforms: Every multiplex imaging technique exhibits platform-specific characteristics in terms of signal-to-noise ratio and acquisition artifacts that need to be accounted for to yield reliable and reproducible results. We propose a pixel classifier-based image preprocessing step that aims to minimize platform-dependency for all multiplex image analysis pipelines. Signal detection and noise reduction as well as artifact removal can be posed as a pixel classification problem in which all pixels in multiplex images can be assigned to two general classes of either I) signal of interest or II) artifacts and noise. The resulting feature representation maps contain pixel-scale representations of the input data, but exhibit significantly increased signal-to-noise ratios with normalized pixel values as output data. We demonstrate the validity of our proposed image preprocessing approach by comparing the results of two well-accepted and widely-used image analysis pipelines.


Conflict of interest statement

The authors have declared that no competing interests exist.

Figures

Fig 1
Fig 1. A general computational pipeline for cellular phenotyping of multiplex tissue imaging data.
We replaced image denoising and preprocessing with our proposed framework as shown in the red box. A pixel classifier is used to classify the pixels in the raw image into two classes: I- desired signal, or II- noise and artifacts. The output of the classifier are two feature representation maps, one for each class, with pixel values between 0 and 1. Marker expression within the border of each cell is then measured from the class I FR maps. The measured single-cell information data (a table with cells in rows and marker expression level in columns) is then used as the input for unsupervised clustering algorithms to identify the cell types.
Fig 2
Fig 2. Removal of various artifacts and noise from MIBI data.
A: An example of cross-channel contamination where a contaminating signal from hepatocyte antigen channel, the oxide of the metal Neodymium (145 m/z + 16 m/z, top), contaminates a target channel, CD20 with Dysprosium (161 m/z, middle). The contamination is removed in the FR map (bottom). The histograms of pixel values for the insets (highlighted in yellow) of the images are displayed both before and after artifacts correction. B: Section of Ki-67 marker from ovarian cancer tissue before (left) and after(right) gold removal (a MIBI platform artifact). C: Section of breast tissue stained with pan-cytokeratin antibodies before (left) and after (right) removal of necrotic tissue regions. Histograms of pixel values are included for all images (A-C) before and after artifacts correction. D: Section of ovarian cancer tissue stained with CD163 antibody before (left) and after noise and aggregates (right) correction. Corresponding histograms of pixel values for the pseudo-cells outlined in green, orange, and red are plotted before and after noise and aggregate correction. E: CD11c staining of lung tissue by IMC (left) and the corresponding FR map (right). F: CD8 staining of ovarian cancer tissue by MIBI (left) and the corresponding FR map (right). One classifier is trained for each of the individual raw images shown in panels A-F.
Fig 3
Fig 3. Our framework delineates cell type compositions in mass ion beam imaging data consistent with MAUI [2].
A: Marker expression measured per cell using the images (top row) and the FR maps (middle row) are overlaid on the tSNE plot for selected immune and tumor markers. The bottom row demonstrates correlation between marker expression per cell from raw images (x-axis) and FR maps (y-axis). The strength of these correlations are quantified using Spearman’s rank correlation coefficient. B: Marker expression is shown for cells clustered according to the TNBC study [2] and sorted by cell phenotype. Expression values for each marker are scaled from zero to one (left) or are measured from the FR maps (right). Stacked bar plot shows the abundance of each cell type in the dataset, with corresponding colors specified in the legends of panel C. C: Correlation between the frequency of each cell type per patient identified using MAUI in the TNBC study (x-axis) and our proposed framework (y-axis). Pearson coefficient is calculated for each cell type.
Fig 4
Fig 4. Our framework delineates cell-type composition in fluorescence imaging data consistent with inForm.
A: Signal intensities for selected immune and tumor markers measured for individual cells using the raw images (top row) or the FR maps (middle row) were overlaid on tSNE plots. Scatter plots (bottom row) demonstrating the correlation between signal intensity per cell from raw images (x-axis) and FR maps (y-axis). The strength of these correlations are quantified using Spearman’s rank correlation coefficient. B: Cell-cell comparison between the cell type identified by inForm (x-axis) and our framework (y-axis). Table entries indicate the percentage of cells in the dataset to compare the identified cell types by the baselines (columns) and our framework (rows). Heatmap of marker expression for the unidentified cluster by inForm (right); the expression level of markers per cell is measured using the raw image scaled between 0 and 1 (left) or measured from FR maps (right). In both heatmaps the expression level is computed as the summation of pixel values within the boundary of a cell divided by the total number of pixels comprising that cell. C: Color overlay of markers CD19, CD3, CD8, CD68, and CK (top); plots compare the stain from the raw image with the corresponding FR map (top). Pseudo-coloring of cell populations compares the predicted cell types by inForm with our framework (bottom).

References

    1. Angelo M, Bendall SC, Finck R, Hale MB, Hitzman C, Borowsky AD, et al.. Multiplexed ion beam imaging of human breast tumors. Nature medicine. 2014;20(4):436–42. doi: 10.1038/nm.3488 - DOI - PMC - PubMed
    1. Keren L, Bosse M, Marquez D, Angoshtari R, Jain S, Varma S, et al.. A structured tumor-immune microenvironment in triple negative breast cancer revealed by multiplexed ion beam imaging. Cell. 2018;174(6):1373–87. doi: 10.1016/j.cell.2018.08.039 - DOI - PMC - PubMed
    1. Giesen C, Wang HA, Schapiro D, Zivanovic N, Jacobs A, Hattendorf B, et al.. Highly multiplexed imaging of tumor tissues with subcellular resolution by mass cytometry. Nature methods. 2014;11(4):417–22. doi: 10.1038/nmeth.2869 - DOI - PubMed
    1. Goltsev Y, Samusik N, Kennedy-Darling J, Bhate S, Hale M, Vazquez G, et al.. Deep profiling of mouse splenic architecture with CODEX multiplexed imaging. Cell. 2018;174(4):968–81. doi: 10.1016/j.cell.2018.07.010 - DOI - PMC - PubMed
    1. Schürch CM, Bhate SS, Barlow GL, Phillips DJ, Noti L, Zlobec I, et al.. Coordinated cellular neighborhoods orchestrate antitumoral immunity at the colorectal cancer invasive front. Cell. 2020;182(5):1341–59. doi: 10.1016/j.cell.2020.07.005 - DOI - PMC - PubMed

Publication types

MeSH terms