. 2023 Dec 1;29(23):4958-4972.
doi: 10.1158/1078-0432.CCR-23-1122.

ATM Mutations Associate with Distinct Co-Mutational Patterns and Therapeutic Vulnerabilities in NSCLC

Affiliations

ATM Mutations Associate with Distinct Co-Mutational Patterns and Therapeutic Vulnerabilities in NSCLC

Natalie I Vokes et al. Clin Cancer Res. .

Abstract

Purpose: Ataxia-telangiectasia mutated (ATM) is the most frequently mutated DNA damage repair gene in non-small cell lung cancer (NSCLC). However, the molecular correlates of ATM mutations and their clinical implications have not been fully elucidated.

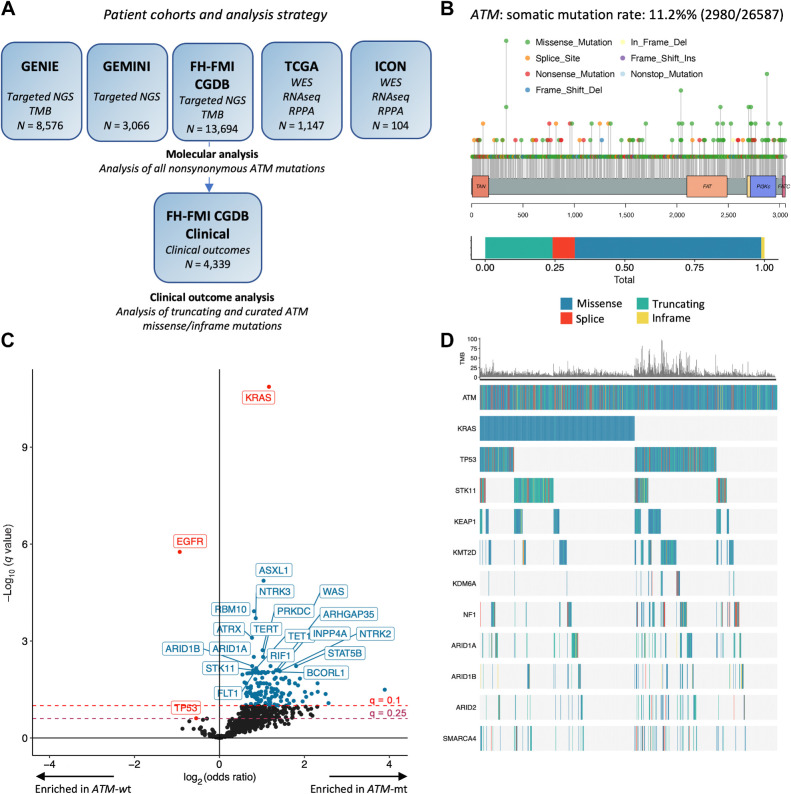
Experimental design: Clinicopathologic and genomic data from 26,587 patients with NSCLC from MD Anderson, public databases, and a de-identified nationwide (US-based) NSCLC clinicogenomic database (CGDB) were used to assess the co-mutation landscape, protein expression, and mutational processes in ATM-mutant tumors. We used the CGDB to evaluate ATM-associated outcomes in patients treated with immune checkpoint inhibitors (ICI) with or without chemotherapy, and assessed the effect of ATM loss on STING signaling and chemotherapy sensitivity in preclinical models.

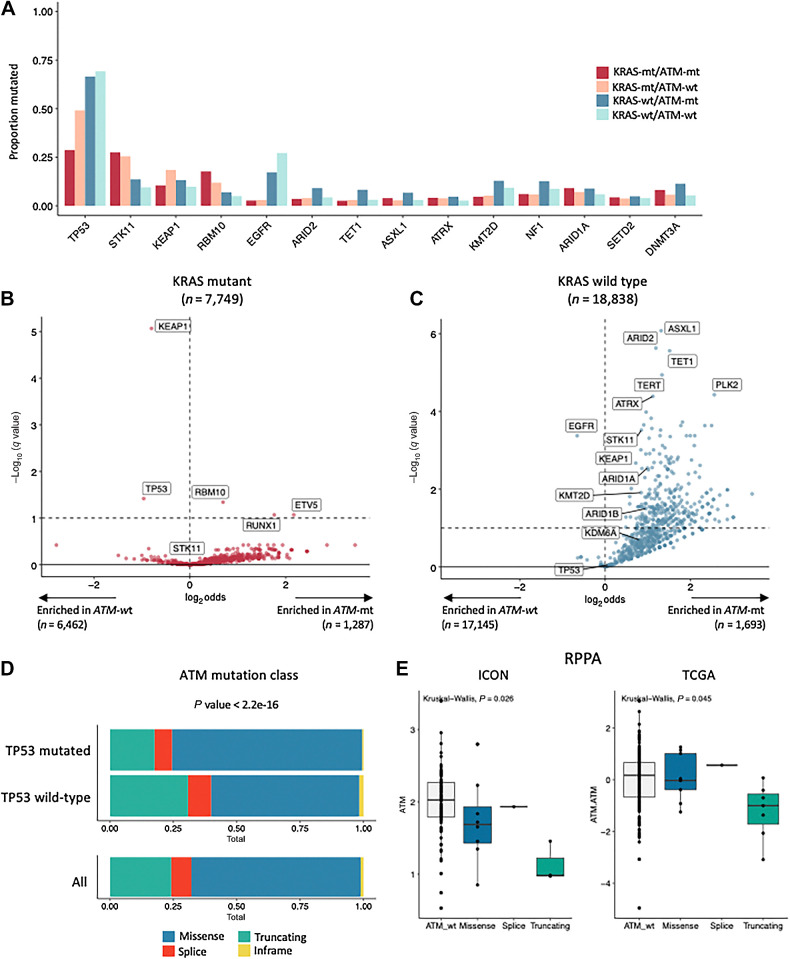
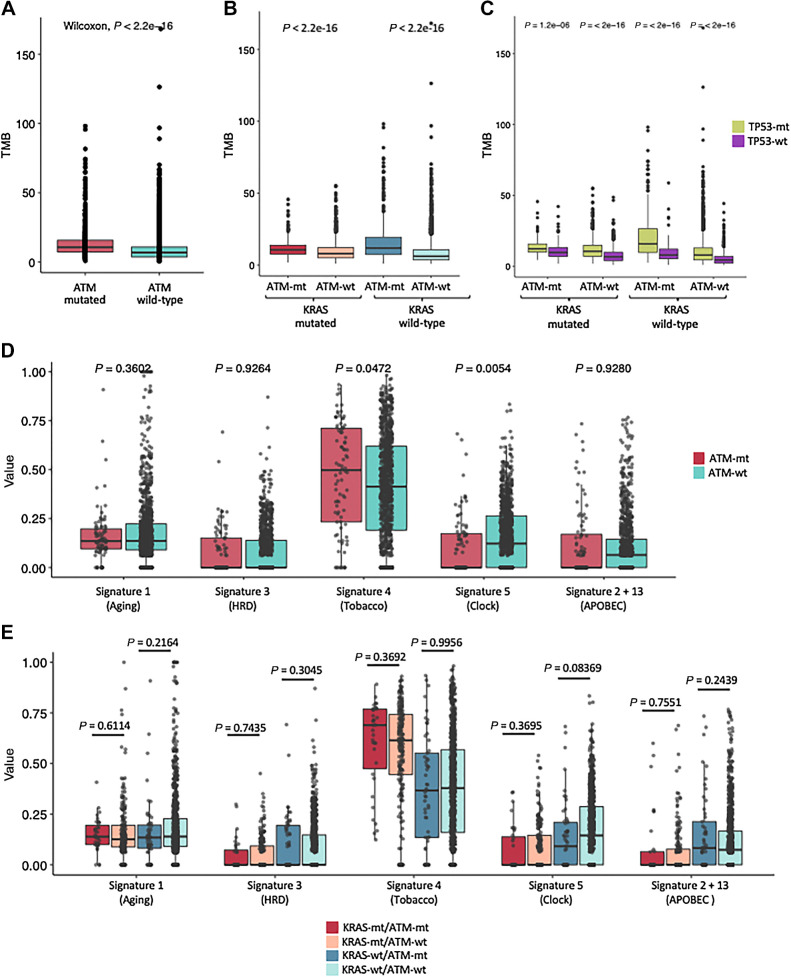
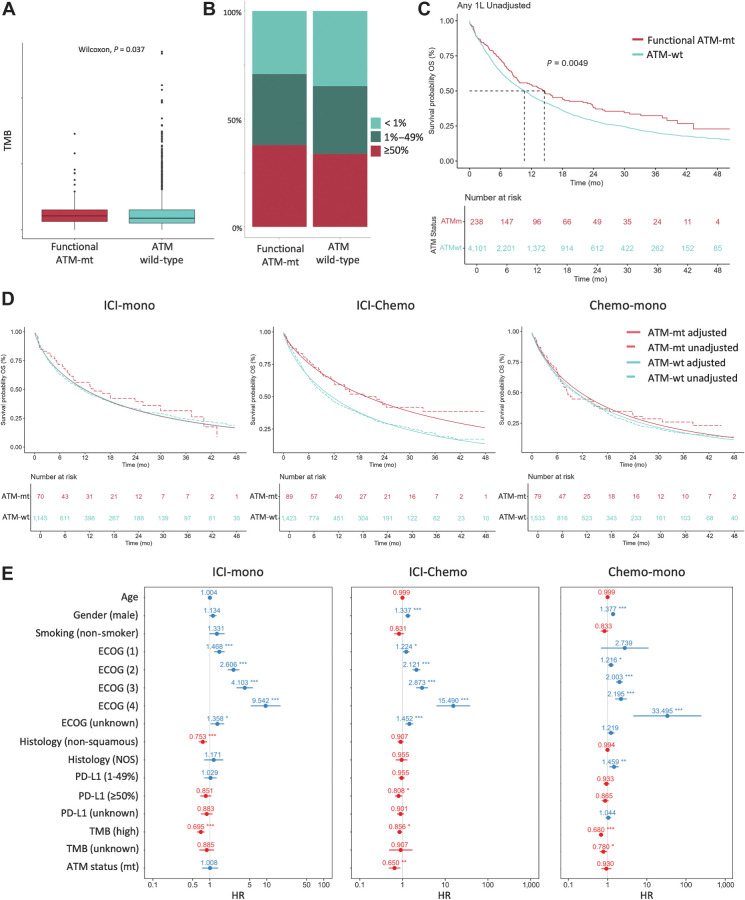
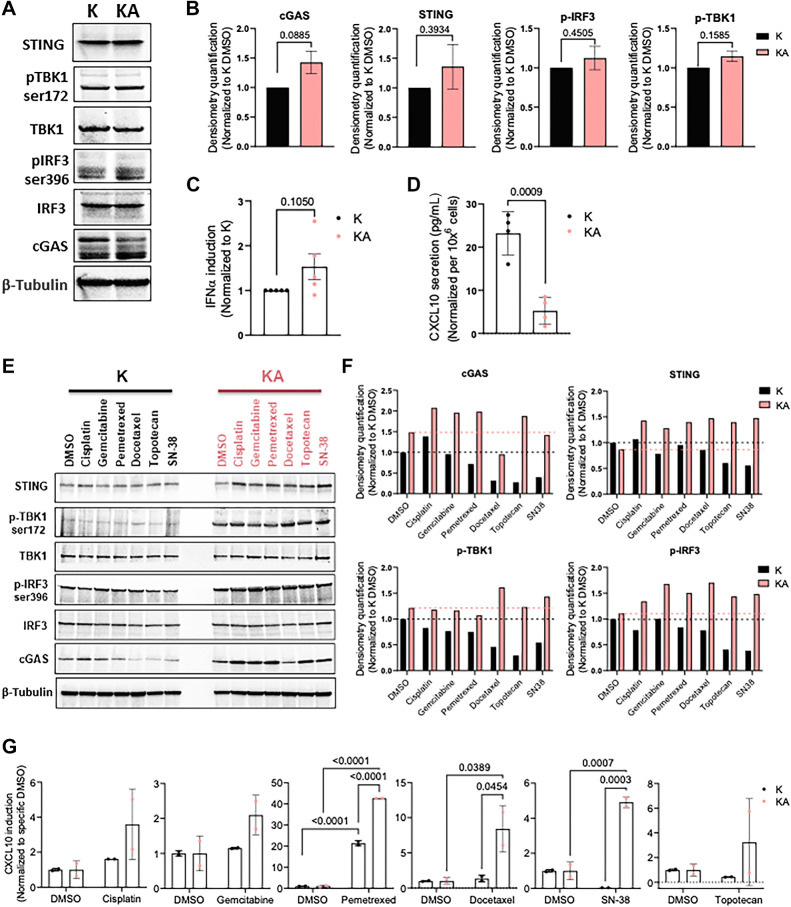
Results: Nonsynonymous mutations in ATM were observed in 11.2% of samples (2,980/26,587) and were significantly associated with mutations in KRAS, but mutually exclusive with EGFR (q < 0.1). KRAS mutational status constrained the ATM co-mutation landscape, with strong mutual exclusivity with TP53 and KEAP1 within KRAS-mutated samples. Those ATM mutations that co-occurred with TP53 were more likely to be missense mutations and associate with high mutational burden, suggestive of non-functional passenger mutations. In the CGDB cohort, dysfunctional ATM mutations associated with improved OS only in patients treated with ICI-chemotherapy, and not ICI alone. In vitro analyses demonstrated enhanced upregulation of STING signaling in ATM knockout cells with the addition of chemotherapy.

Conclusions: ATM mutations define a distinct subset of NSCLC associated with KRAS mutations, increased TMB, decreased TP53 and EGFR co-occurrence, and potential increased sensitivity to ICIs in the context of DNA-damaging chemotherapy.


Figures

Figure 1. Genomic landscape of ATM mutations in non–small cell lung cancer. A, Molecular cohorts and clinical sub-cohort used for analysis, along with the definition of ATM mutations used in the molecular and clinical analyses, respectively. B, Lollipop plot of ATM mutations, along with the distribution of mutation types within ATM. C, Enrichment analysis depicting genes more likely to be co-mutated with ATM (positive log odds ratio, x-axis) or mutually exclusive with ATM (negative log odds ratio) across all five molecular cohorts. The y-axis depicts negative log of the FDR-corrected P value. D, Representative co-mutation plot from the GENIE cohort to visualize ATM mutations, most frequently co-occurring mutations, and tumor mutational burden (TMB; n = 809 samples with ATM mutations). ATM-mt = ATM mutated, ATM-wt = ATM wild-type. Dashed maroon line represents q = 0.25 and dashed red line represents q = 0.1. KRAS, EGFR, and TP53 highlighted in red.
Figure 1.
Genomic landscape of ATM mutations in non–small cell lung cancer. A, Molecular cohorts and clinical sub-cohort used for analysis, along with the definition of ATM mutations used in the molecular and clinical analyses, respectively. B, Lollipop plot of ATM mutations, along with the distribution of mutation types within ATM. C, Enrichment analysis depicting genes more likely to be co-mutated with ATM (positive log odds ratio, x-axis) or mutually exclusive with ATM (negative log odds ratio) across all five molecular cohorts. The y-axis depicts negative log of the FDR-corrected P value. D, Representative co-mutation plot from the GENIE cohort to visualize ATM mutations, most frequently co-occurring mutations, and tumor mutational burden (TMB; n = 809 samples with ATM mutations). ATM-mt = ATM mutated, ATM-wt = ATM wild-type. Dashed maroon line represents q = 0.25 and dashed red line represents q = 0.1. KRAS, EGFR, and TP53 highlighted in red.
Figure 2. KRAS constrains the ATM co-mutation landscape across molecular cohorts. A, Proportion of samples with mutations in the genes indicated on the x-axis, stratified by ATM/KRAS co-mutation status, proportions aggregated across cohorts. B and C, Enrichment analysis depicting genes more likely to be co-mutated with ATM (positive log odds ratio, x-axis) or mutually exclusive with ATM (negative log odds ratio) in (B) KRAS-mutated samples or (C) KRAS wild-type samples. Data from cohorts aggregated via meta-analysis. D, Proportion of ATM mutation variant class in TP53 mutated versus wild-type across all cohorts; variant class across all ATM mutations shown below for reference. E, ATM protein expression by reverse phase protein array (RPPA) stratified by ATM mutation variant class in the ICON and TCGA cohorts.
Figure 2.
KRAS constrains the ATM co-mutation landscape across molecular cohorts. A, Proportion of samples with mutations in the genes indicated on the x-axis, stratified by ATM/KRAS co-mutation status, proportions aggregated across cohorts. B and C, Enrichment analysis depicting genes more likely to be co-mutated with ATM (positive log odds ratio, x-axis) or mutually exclusive with ATM (negative log odds ratio) in (B) KRAS-mutated samples or (C) KRAS wild-type samples. Data from cohorts aggregated via meta-analysis. D, Proportion of ATM mutation variant class in TP53 mutated versus wild-type across all cohorts; variant class across all ATM mutations shown below for reference. E, ATM protein expression by reverse phase protein array (RPPA) stratified by ATM mutation variant class in the ICON and TCGA cohorts.
Figure 3. Genomic features of ATM mutant non–small cell lung cancer. Tumor mutational burden (TMB) in the GENIE cohort in (A) ATM-mutant (ATM-mt) versus ATM wild-type (ATM-wt) samples; B, TMB, stratified by ATM/KRAS co-mutation status. C, TMB stratified by ATM/KRAS co-mutation status, further stratified by TP53 mutation status. D and E, Mutational signature proportion in the TCGA dataset, stratified by (D) ATM and (E) ATM/KRAS mutation status; HRD, homologous repair deficit.
Figure 3.
Genomic features of ATM mutant non–small cell lung cancer. Tumor mutational burden (TMB) in the GENIE cohort in (A) ATM-mutant (ATM-mt) versus ATM wild-type (ATM-wt) samples; B, TMB, stratified by ATM/KRAS co-mutation status. C, TMB stratified by ATM/KRAS co-mutation status, further stratified by TP53 mutation status. D and E, Mutational signature proportion in the TCGA dataset, stratified by (D) ATM and (E) ATM/KRAS mutation status; HRD, homologous repair deficit.
Figure 4. Association between ATM and immune checkpoint inhibitor (ICI) outcomes. A, Tumor mutational burden (TMB) in patients with functional ATM mutations (ATM-mt) versus wild-type (ATM-wt) samples in the FH-FMI CGDB Clinical Cohort. ATM mutations defined as truncating, splice site, or select curated mutations. B, PD-L1 expression in ATM-mt versus ATM-wt samples. C, Overall survival (OS) in ATM-mt versus ATM-wt samples across the entire FH-FMI CGDB clinical cohort. D, OS in ATM-mt versus ATM-wt samples, stratified by treatment with ICI-monotherapy (ICI-mono), ICI with chemotherapy (ICI-chemo), or chemotherapy monotherapy (Chemo-mono). Dashed lines represent unadjusted values and solid lines represent multivariable adjustment. E, Forest plot for multivariable analysis of clinical features, ATM status, and OS, stratified by treatment. Points represent hazard ratio and lines 95% confidence interval. Red values indicate an association with improved outcome (HR < 1), blue with a negative outcome (HR > 1), and stars are placed next to statistically significant P values. *, P < 0.05; **, P < 0.01; ***, P < 0.001.
Figure 4.
Association between ATM and immune checkpoint inhibitor (ICI) outcomes. A, Tumor mutational burden (TMB) in patients with functional ATM mutations (ATM-mt) versus wild-type (ATM-wt) samples in the FH-FMI CGDB Clinical Cohort. ATM mutations defined as truncating, splice site, or select curated mutations. B, PD-L1 expression in ATM-mt versus ATM-wt samples. C, Overall survival (OS) in ATM-mt versus ATM-wt samples across the entire FH-FMI CGDB clinical cohort. D, OS in ATM-mt versus ATM-wt samples, stratified by treatment with ICI-monotherapy (ICI-mono), ICI with chemotherapy (ICI-chemo), or chemotherapy monotherapy (Chemo-mono). Dashed lines represent unadjusted values and solid lines represent multivariable adjustment. E, Forest plot for multivariable analysis of clinical features, ATM status, and OS, stratified by treatment. Points represent hazard ratio and lines 95% confidence interval. Red values indicate an association with improved outcome (HR < 1), blue with a negative outcome (HR > 1), and stars are placed next to statistically significant P values. *, P < 0.05; **, P < 0.01; ***, P < 0.001.
Figure 5. ATM loss enhances STING signaling activation with chemotherapy. A, Western blot analysis and (B) quantification of expression of the indicated STING signaling proteins in ATM-proficient (K) and ATM-deficient (KA) cells. Graphs show average of 2–3 independent Western blots. α-Tubulin was used as a loading control. C, Quantification of IFNα mRNA expression assessed by RT-PCR in K and KA cell lines. D, ELISA quantification of CXCL10 protein secretion in K and KA cell lines normalized by 106 cells. E, Western blot analysis and (F) quantification of expression of the indicated STING signaling proteins in ATM--proficient K and ATM-deficient (KA) cells after DMSO, 10 μmol/L cisplatin, 40 nmol/L gemcitabine, 50 nmol/L pemetrexed, 500 nmol/L docetaxel, 400 nmol/L topotecan or 300 nmol/L SN-38 treatments for 48 hours. α-Tubulin was used as a loading control. G, ELISA quantification of CXCL10 protein secretion normalized by 106 cells in K and KA cell lines after DMSO, 10 μmol/L cisplatin, 40 nmol/L gemcitabine, 50 nmol/L pemetrexed, 500 nmol/L docetaxel, 400 nmol/L topotecan or 300 nmol/L SN-38 treatments for 48 hours. Graphs show relative induction normalized to DMSO non-treated K or KA cells, respectively. All data are presented as mean ± standard error of the mean (error bars) for each group.
Figure 5.
ATM loss enhances STING signaling activation with chemotherapy. A, Western blot analysis and (B) quantification of expression of the indicated STING signaling proteins in ATM-proficient (K) and ATM-deficient (KA) cells. Graphs show average of 2–3 independent Western blots. α-Tubulin was used as a loading control. C, Quantification of IFNα mRNA expression assessed by RT-PCR in K and KA cell lines. D, ELISA quantification of CXCL10 protein secretion in K and KA cell lines normalized by 106 cells. E, Western blot analysis and (F) quantification of expression of the indicated STING signaling proteins in ATM--proficient K and ATM-deficient (KA) cells after DMSO, 10 μmol/L cisplatin, 40 nmol/L gemcitabine, 50 nmol/L pemetrexed, 500 nmol/L docetaxel, 400 nmol/L topotecan or 300 nmol/L SN-38 treatments for 48 hours. α-Tubulin was used as a loading control. G, ELISA quantification of CXCL10 protein secretion normalized by 106 cells in K and KA cell lines after DMSO, 10 μmol/L cisplatin, 40 nmol/L gemcitabine, 50 nmol/L pemetrexed, 500 nmol/L docetaxel, 400 nmol/L topotecan or 300 nmol/L SN-38 treatments for 48 hours. Graphs show relative induction normalized to DMSO non-treated K or KA cells, respectively. All data are presented as mean ± standard error of the mean (error bars) for each group.

Similar articles

Cited by

References

    1. Lavin MF. Ataxia-telangiectasia: from a rare disorder to a paradigm for cell signalling and cancer. Nat Rev Mol Cell Biol 2008;9:759–69. - PubMed
    1. Derheimer FA, Kastan MB. Multiple roles of ATM in monitoring and maintaining DNA integrity. FEBS Lett 2010;584:3675–81. - PMC - PubMed
    1. Taylor AMR, Harnden DG, Arlett CF, Harcourt SA, Lehmann AR, Stevens S, et al. . Ataxia telangiectasia: a human mutation with abnormal radiation sensitivity. Nature 1975;258:427–9. - PubMed
    1. Lavin MF, Shiloh Y. The genetic defect in ataxia-telangiectasia. Annu Rev Immunol 1997;15:177–202. - PubMed
    1. The Cancer Genome Atlas Research Network. Comprehensive molecular profiling of lung adenocarcinoma. Nature 2014;511:543–50. - PMC - PubMed

Publication types

MeSH terms

Substances