. 2024 Feb 1;30(3):542-553.
doi: 10.1158/1078-0432.CCR-23-1444.

PD-1 Blockade Induces Reactivation of Nonproductive T-Cell Responses Characterized by NF-κB Signaling in Patients with Pancreatic Cancer

Affiliations

PD-1 Blockade Induces Reactivation of Nonproductive T-Cell Responses Characterized by NF-κB Signaling in Patients with Pancreatic Cancer

Lestat R Ali et al. Clin Cancer Res. .

Abstract

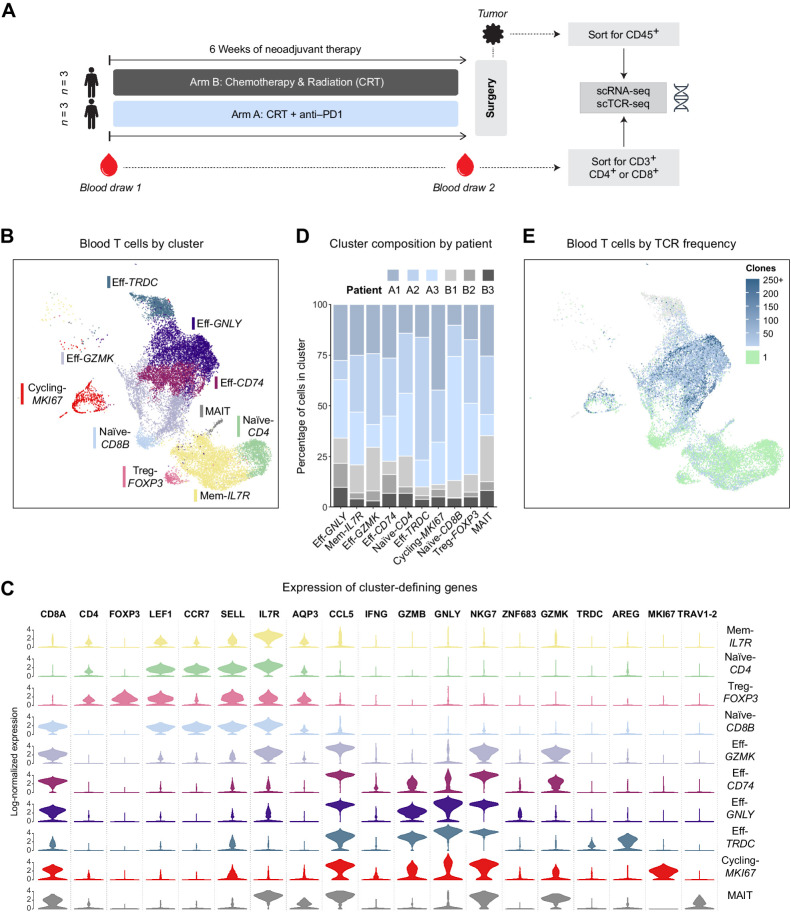
Purpose: Pancreatic ductal adenocarcinoma (PDAC) trials have evaluated CTLA-4 and/or PD-(L)1 blockade in patients with advanced disease in which bulky tumor burden and limited time to develop antitumor T cells may have contributed to poor clinical efficacy. Here, we evaluated peripheral blood and tumor T cells from patients with PDAC receiving neoadjuvant chemoradiation plus anti-PD-1 (pembrolizumab) versus chemoradiation alone. We analyzed whether PD-1 blockade successfully reactivated T cells in the blood and/or tumor to determine whether lack of clinical benefit could be explained by lack of reactivated T cells versus other factors.

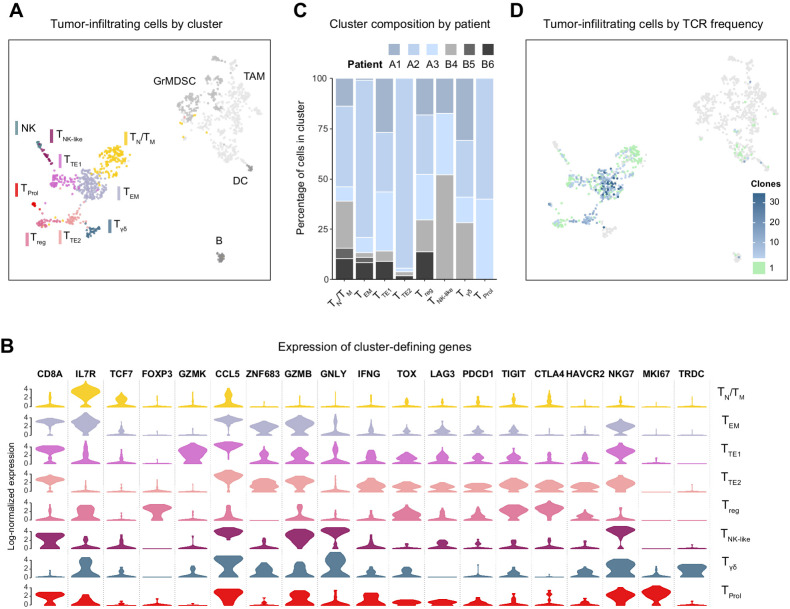
Experimental design: We used single-cell transcriptional profiling and TCR clonotype tracking to identify TCR clonotypes from blood that match clonotypes in the tumor.

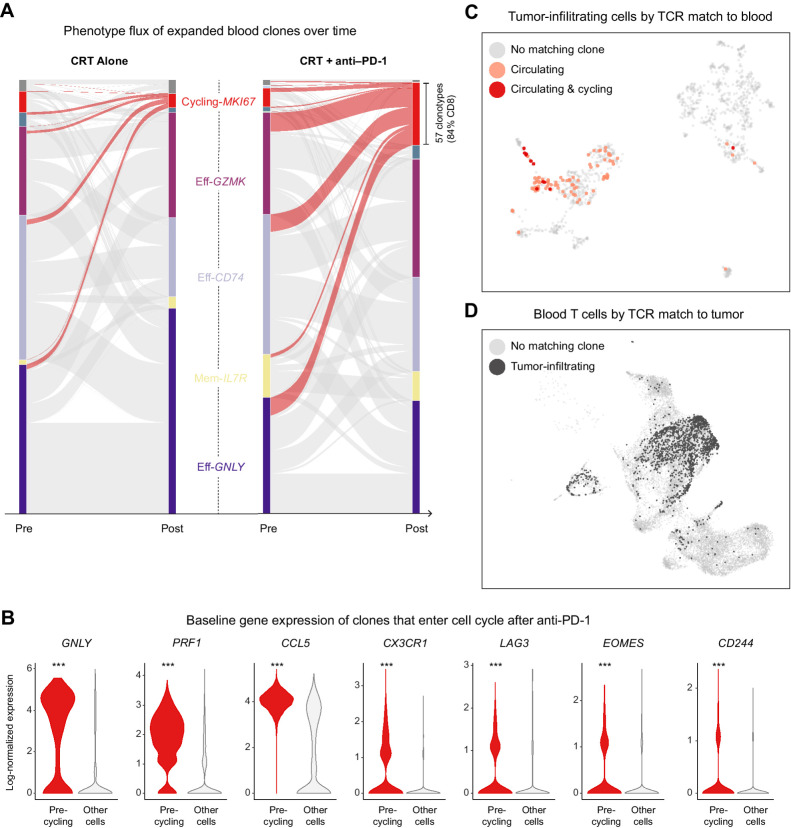
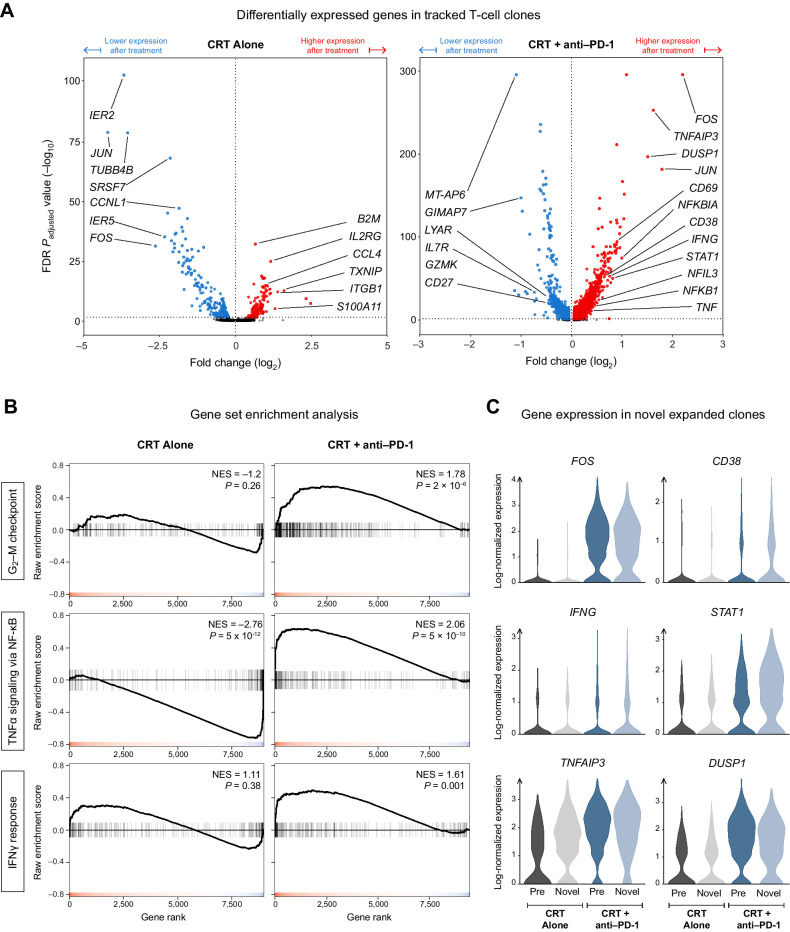
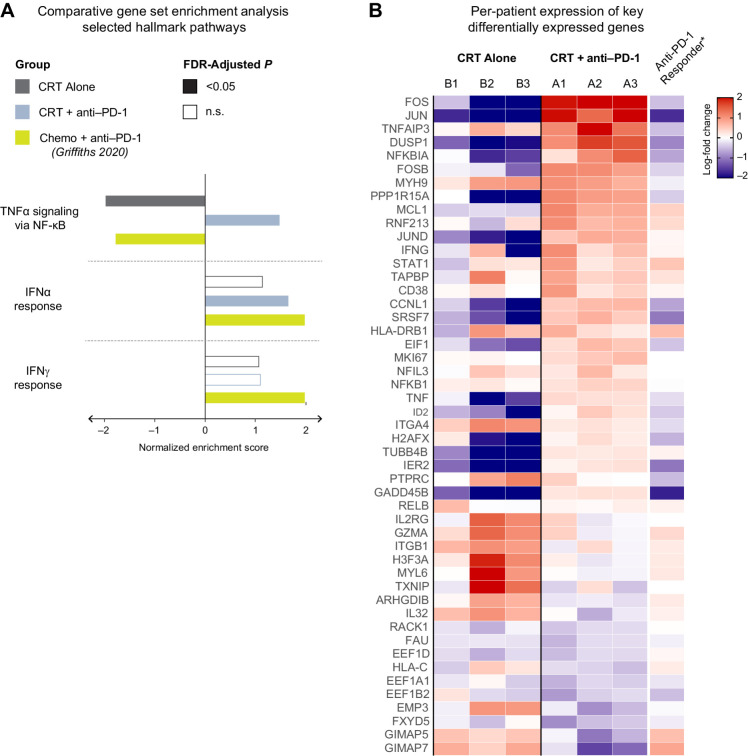
Results: PD-1 blockade increases the flux of TCR clonotypes entering cell cycle and induces an IFNγ signature like that seen in patients with other GI malignancies who respond to PD-1 blockade. However, these reactivated T cells have a robust signature of NF-κB signaling not seen in cases of PD-1 antibody response. Among paired samples between blood and tumor, several of the newly cycling clonotypes matched activated T-cell clonotypes observed in the tumor.

Conclusions: Cytotoxic T cells in the blood of patients with PDAC remain sensitive to reinvigoration by PD-1 blockade, and some have tumor-recognizing potential. Although these T cells proliferate and have a signature of IFN exposure, they also upregulate NF-κB signaling, which potentially counteracts the beneficial effects of anti-PD-1 reinvigoration and marks these T cells as non-productive contributors to antitumor immunity. See related commentary by Lander and DeNardo, p. 474.


Figures

Figure 1. Circulating T cells were analyzed by scRNA-seq before and after neoadjuvant PD-1 blockade combined with chemoradiotherapy in patients with pancreatic adenocarcinoma. A, Schema of clinical trial design and sample analysis. B, Uniform Manifold Approximation and Projection (UMAP) plot of all sequenced blood T cells that passed quality controls colored by an unsupervised clustering algorithm. C, Violin plot showing the log-normalized expression of key cluster-defining genes for each T-cell cluster. D, Bar plot showing the breakdown of each cluster's cells by patient of origin. E, UMAP of blood T cells where each cell is colored by the observed frequency of its TCR in the sample. Singleton clones are colored green; gray indicates no TCR was detected.
Figure 1.
Circulating T cells were analyzed by scRNA-seq before and after neoadjuvant PD-1 blockade combined with chemoradiotherapy in patients with pancreatic adenocarcinoma. A, Schema of clinical trial design and sample analysis. B, Uniform Manifold Approximation and Projection (UMAP) plot of all sequenced blood T cells that passed quality controls colored by an unsupervised clustering algorithm. C, Violin plot showing the log-normalized expression of key cluster-defining genes for each T-cell cluster. D, Bar plot showing the breakdown of each cluster's cells by patient of origin. E, UMAP of blood T cells where each cell is colored by the observed frequency of its TCR in the sample. Singleton clones are colored green; gray indicates no TCR was detected.
Figure 2. Tumor-infiltrating immune cells were analyzed by scRNA-seq after neoadjuvant PD-1 blockade combined with chemoradiotherapy in patients with pancreatic adenocarcinoma. A, UMAP plot of all sequenced tumor-infiltrating cells that passed quality controls colored by an unsupervised clustering algorithm. B, Violin plot showing the log-normalized expression of key cluster-defining genes for each T-cell cluster. C, Bar plot showing the breakdown of each cluster's cells by patient of origin. D, UMAP of tumor-infiltrating cells where each cell is colored by the observed frequency of its TCR in the sample.
Figure 2.
Tumor-infiltrating immune cells were analyzed by scRNA-seq after neoadjuvant PD-1 blockade combined with chemoradiotherapy in patients with pancreatic adenocarcinoma. A, UMAP plot of all sequenced tumor-infiltrating cells that passed quality controls colored by an unsupervised clustering algorithm. B, Violin plot showing the log-normalized expression of key cluster-defining genes for each T-cell cluster. C, Bar plot showing the breakdown of each cluster's cells by patient of origin. D, UMAP of tumor-infiltrating cells where each cell is colored by the observed frequency of its TCR in the sample.
Figure 3. Neoadjuvant PD-1 blockade stimulates polyclonal expansion in circulating cytotoxic T cells with matching tumor-infiltrating clones. A, Alluvial plot showing the flux of clonotypes from pretreatment to posttreatment clusters. The thickness of a band connecting a pretreatment cluster to a posttreatment cluster is proportional to the number of clonotypes with member cells appearing in both clusters; the curves highlighted in red correspond to clonotypes with posttreatment cells in the cycling cluster. B, Violin plot showing the expression distribution of key genes among pretreatment cells belonging to clonotypes that entered cell cycle after treatment in comparison with all other pretreatment cells; ***, denotes an adjusted P < 1 × 10⁻¹⁴ after Bonferroni multiple-hypothesis correction. C, UMAP of tumor-infiltrating cells highlighting the subset of T cells whose TCRs were also expressed by circulating and cycling T cells. D, UMAP of blood T cells, highlighting the subset of cells whose TCRs were also expressed by tumor-infiltrating T cells.
Figure 3.
Neoadjuvant PD-1 blockade stimulates polyclonal expansion in circulating cytotoxic T cells with matching tumor-infiltrating clones. A, Alluvial plot showing the flux of clonotypes from pretreatment to posttreatment clusters. The thickness of a band connecting a pretreatment cluster to a posttreatment cluster is proportional to the number of clonotypes with member cells appearing in both clusters; the curves highlighted in red correspond to clonotypes with posttreatment cells in the cycling cluster. B, Violin plot showing the expression distribution of key genes among pretreatment cells belonging to clonotypes that entered cell cycle after treatment in comparison with all other pretreatment cells; ***, denotes an adjusted P < 1 × 10⁻¹⁴ after Bonferroni multiple-hypothesis correction. C, UMAP of tumor-infiltrating cells highlighting the subset of T cells whose TCRs were also expressed by circulating and cycling T cells. D, UMAP of blood T cells, highlighting the subset of cells whose TCRs were also expressed by tumor-infiltrating T cells.
Figure 4. PD-1 blockade induces the AP-1, NF-κB, and IFN transcriptional programs in the T cells of patients with PDAC. A, Volcano plot showing the differentially expressed genes (DEG) over the treatment period among T-cell clones that were present in both pre- and posttreatment samples. B, Gene Set Enrichment Analysis (GSEA) of three hallmark gene sets for the DEGs obtained in (A). C, The posttreatment expression of key genes from the hallmark pathways in (B) among novel expanded cells in comparison with pre-existing expanded cells.
Figure 4.
PD-1 blockade induces the AP-1, NF-κB, and IFN transcriptional programs in the T cells of patients with PDAC. A, Volcano plot showing the differentially expressed genes (DEG) over the treatment period among T-cell clones that were present in both pre- and posttreatment samples. B, Gene Set Enrichment Analysis (GSEA) of three hallmark gene sets for the DEGs obtained in (A). C, The posttreatment expression of key genes from the hallmark pathways in (B) among novel expanded cells in comparison with pre-existing expanded cells.
Figure 5. Lack of response to neoadjuvant PD-1 correlates with NF-κB activation and a relatively restrained upregulation of IFN-response genes. A, Gene Set Enrichment Analysis (GSEA) of hallmark gene sets performed on the list of treatment-induced differentially expressed genes in each group of patients. B, Heat map showing the treatment-induced log-fold change of key genes, broken down by individual patient.
Figure 5.
Lack of response to neoadjuvant PD-1 correlates with NF-κB activation and a relatively restrained upregulation of IFN-response genes. A, Gene Set Enrichment Analysis (GSEA) of hallmark gene sets performed on the list of treatment-induced differentially expressed genes in each group of patients. B, Heat map showing the treatment-induced log-fold change of key genes, broken down by individual patient.

Comment in

References

    1. Rahib L, Smith BD, Aizenberg R, Rosenzweig AB, Fleshman JM, Matrisian LM. Projecting cancer incidence and deaths to 2030: the unexpected burden of thyroid, liver, and pancreas cancers in the United States. Cancer Res 2014;74:2913–21. - PubMed
    1. Kunzmann V, Siveke JT, Algul H, Goekkurt E, Siegler G, Martens U, et al. . Nab-paclitaxel plus gemcitabine versus nab-paclitaxel plus gemcitabine followed by FOLFIRINOX induction chemotherapy in locally advanced pancreatic cancer (NEOLAP-AIO-PAK-0113): a multicentre, randomised, phase 2 trial. Lancet Gastroenterol Hepatol 2021;6:128–38. - PubMed
    1. Hosein AN, Dougan SK, Aguirre AJ, Maitra A. Translational advances in pancreatic ductal adenocarcinoma therapy. Nat Cancer 2022;3:272–86. - PubMed
    1. Katz MHG, Shi Q, Meyers J, Herman JM, Chuong M, Wolpin BM, et al. . Efficacy of preoperative mFOLFIRINOX vs. mFOLFIRINOX plus hypofractionated radiotherapy for borderline resectable adenocarcinoma of the pancreas: the A021501 phase 2 randomized clinical trial. JAMA Oncol 2022;8:1263–70. - PMC - PubMed
    1. Conroy T, Castan F, Lopez A, Turpin A, Ben Abdelghani M, Wei AC, et al. . Five-year outcomes of FOLFIRINOX vs. gemcitabine as adjuvant therapy for pancreatic cancer: a randomized clinical trial. JAMA Oncol 2022;8:1571–8. - PMC - PubMed

Publication types

MeSH terms

Substances