. 2023 Sep 22;381(6664):1316-1323.
doi: 10.1126/science.abq1053. Epub 2023 Sep 21.

Manipulating mitochondrial electron flow enhances tumor immunogenicity

Affiliations

Manipulating mitochondrial electron flow enhances tumor immunogenicity

Kailash Chandra Mangalhara et al. Science. .

Abstract

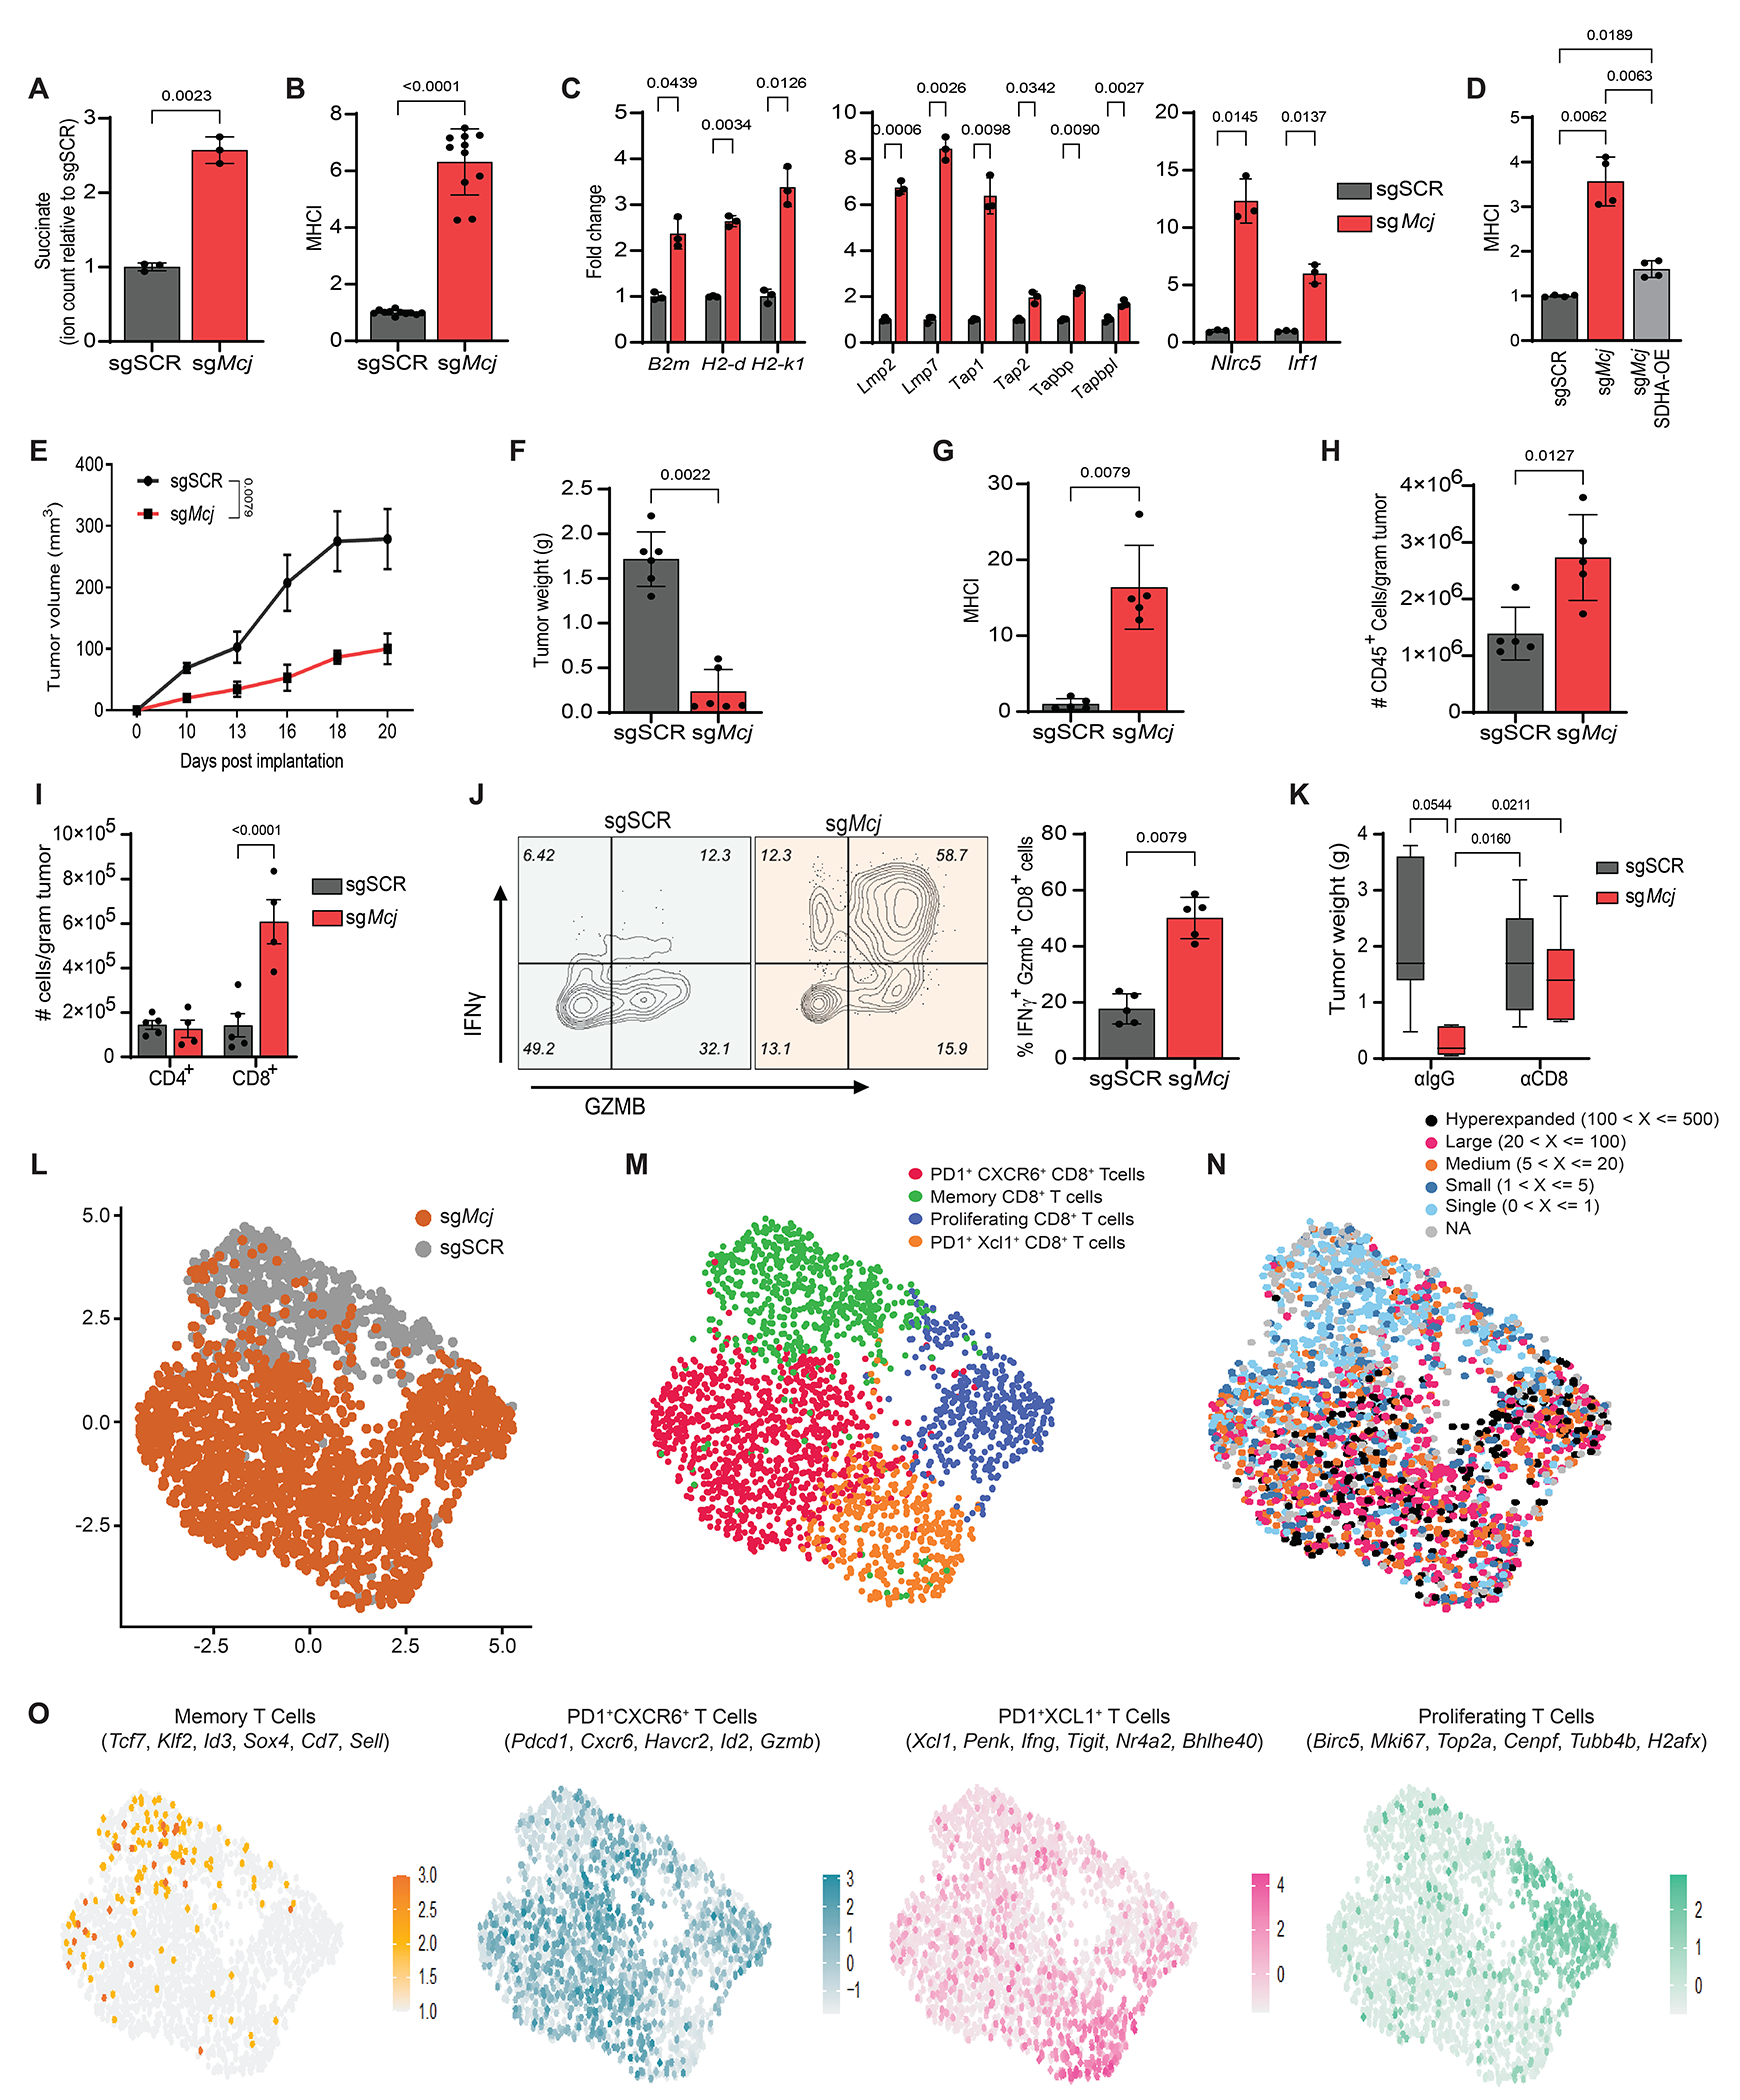
Although tumor growth requires the mitochondrial electron transport chain (ETC), the relative contribution of complex I (CI) and complex II (CII), the gatekeepers for initiating electron flow, remains unclear. In this work, we report that the loss of CII, but not that of CI, reduces melanoma tumor growth by increasing antigen presentation and T cell-mediated killing. This is driven by succinate-mediated transcriptional and epigenetic activation of major histocompatibility complex-antigen processing and presentation (MHC-APP) genes independent of interferon signaling. Furthermore, knockout of methylation-controlled J protein (MCJ), to promote electron entry preferentially through CI, provides proof of concept of ETC rewiring to achieve antitumor responses without side effects associated with an overall reduction in mitochondrial respiration in noncancer cells. Our results may hold therapeutic potential for tumors that have reduced MHC-APP expression, a common mechanism of cancer immunoevasion.


Conflict of interest statement

G.S.S. is on the scientific advisory board and has equity in Mitotherapeutix. S.M.K. is on the scientific advisory boards and has equity in EvolveImmune Therapeutics, Simcha Therapeutics, Affini-T Therapeutics, Arvinas, and Pfizer. M.G.V.H. is on the scientific advisory board in Agios Pharmaceuticals, iTeos Therapeutics, Sage Therapeutics, Pretzel Therapeutics, Lime Therapeutics, Doria Ventures, and Auron Therapeutics. M. R. is a co-founder and a member of the scientific advisory board of Mitotherapeutix LLC. M.B. receives funding for unrelated research activities from AstraZeneca. M. R. is inventor on the patent application 14/413,927 and 15/805,534 submitted by University of Vermont that covers the use of Method and compositions for metabolic regulation. M. R. is inventor on the patent application 15/551,995 submitted by University of Vermont that covers the use of MCJ agonists and uses thereof. M. R. is inventor on the patent application 15/743,096 submitted by University of Vermont that covers the use of Method and compositions to treat drug-induced diseases and conditions. M. R. is inventor on the patent application 62/979,833 submitted by University of Vermont and Mitotherapeutix that covers the use of Compositions and methods for inhibiting expression of methylation-controlled J-Protein (MCJ). The remaining authors declare no competing interests.

Figures

Fig 1:
Fig 1:. Mitochondrial CII inhibition enhances anti-tumor immunity via increased MHC-I.
YUMM1.7-sgSCR (control) (n=8), sgSdha (CII knockout) (n=8) and sgNdufa1 (CI knockout) (n=7) cells (2 x10⁵) were subcutaneously injected into the flanks of C57BL/6 male mice and tumor growth was monitored for 20 days. A-D. Tumor growth curves. Tumor Volume versus time (days post-implantation) is plotted (A), Tumor Weight (in grams at day 20) (B), number of tumor-infiltrating CD45+ cells per gram tumor at day 20 (C), CD8+ T cells per gram tumor at day 20 (D) E. Percentage (%) of IFNγ+ and GZMB+ positive tumor-infiltrating CD8+ T cells in tumors at day 20. F. Tumor surface MHC-I expression on cells from panel A at day 20. G-H. Tumor growth curve (Tumor Volume versus time is plotted) (G) and tumor weight (in grams at day 20) (H) of tumors from sgSCR (control), sgSdha (CII knockout), sgSCR-sgB2m (control + 2 microglobulin knockout) and sgSdha-sgB2m (CII knockout + 2 microglobulin knockout) YUMM1.7 cells (2 x 10⁵) subcutaneously implanted in C57BL/6 mice (n=4). Data points in each panel represent independent sample from two experiments. Data are presented in mean ± SEM. Statistical significance was determined by Kruskal-Wallis test with Dunn’s multiple comparisons for A to H.
Fig 2.
Fig 2.. Mitochondrial succinate drives MHC-I surface and gene expression upon inhibition of CII.
A. Cell surface MHC-I expression on sgSCR, sgSdha and sgSdhc YUMM1.7 cells (n=6). MHC-I expression is presented in fold change relative to sgSCR cells. A representative histogram is shown on the left. B. Cell surface MHC-I expression on YUMM1.7 (n=6) and 4T1 (n=6) cells treated with DMSO (vehicle control), rotenone (complex I inhibitor), 3-NPA (complex II inhibitor) for 48 hours. MHC-I expression is presented in fold change relative to DMSO treated cells. A representative histogram is shown on the left. C. qRT-PCR analysis of indicated representative MHC-APP genes in YUMM1.7 cells treated with DMSO, rotenone and 3-NPA for 48 hours. Where B2m is MHC-I light-chain; H2-d and H2-k1 represent MHC-I heavy-chain; Lmp2 and Lmp7 represent immunoproteasome subunits; Tap1, Tap2, Tapbp and Tapbpl represent antigen transporters and peptide loading complex in the endoplasmic reticulum, and Nlrc5, Irf1 and Stat1 are transcription factors. Expression levels are presented in fold change relative to DMSO treated cells. Each data point represents a technical replicate from one biological sample. Similar results were obtained with two independent biological replicates. D. Cell surface MHC-I expression on DMSO and 3-NPA treated sgNlrc5 (NLRC5 knockout; n=4) and sgIrf1 (IRF1 knockout; n=4) YUMM1.7 cells. MHC-I expression is presented in fold change relative to DMSO treated sgSCR (control) cells. E. Steady-state levels of metabolites in YUMM1.7 cells treated with DMSO, rotenone and 3-NPA for 48 hours. A red–blue color scale depicts the abundance of the metabolites (red: high, blue: low) (n=2 biologically independent experiments). F. Cell surface MHC-I expression on YUMM1.7 (n=3) and 4T1 (n=3) cells treated with mono-methyl succinate (a cell-permeable form of succinate) dissolved in phosphate buffer saline (PBS) for 48 hours. MHC-I expression is presented in fold change relative to vehicle (PBS) control cells. (G) Whole-cell succinate levels in YUMM1.7 cells cultured in the presence or absence of glutamine for 16 hours, followed by DMSO or 3-NPA treatment for 24 hours (n = 3). (H) Cell surface MHC-I expression on YUMM1.7 cells cultured in the presence or absence of glutamine for 16 hours followed by DMSO or 3-NPA treatment for 24 hours (n = 4). MHC-I expression is presented as fold change relative to DMSO-treated cells cultured in the presence of glutamine. (I) Cell surface MHC-I expression on sgSCR and sgSdhc (CII knockout) YUMM1.7 cells transfected with either siSCR or siOgdh for 72 hours (n = 3). MHC-I expression is presented as fold change relative to cells transfected with siSCR (sgSCR). Data points in each panel represent an independent sample unless specified. Data are presented in mean ± SD. Statistical significance was determined using one-way ANOVA with Dunnett’s multiple comparisons test for A, B, D, F and G, two-way ANOVA with Dunnetťs multiple comparisons test for C, and two-way ANOVA with Sidak’s multiple comparisons test for H.
Fig 3:
Fig 3:. Mitochondrial succinate regulates antigen presentation through changes in histone methylation.
A. αKG/Succinate ratio in YUMM1.7 cells treated with DMSO, 3-NPA and 3-NPA + αKG for 6 hours (n=4). B. Immunoblot analysis of indicated lysine trimethylation marks on histone 3 in YUMM1.7 cells treated with DMSO, 3-NPA and 3-NPA + αKG for 24 hours. Histone 3 and ACTIN are the loading controls. Numbers represents band density normalized to histone 3. Similar results were obtained with an independent experiment. C. Cell surface MHC-I expression on YUMM1.7 cells treated with DMSO, 3-NPA and 3-NPA + αKG for 48 hours (n=6). MHC-I expression is presented in fold change relative to DMSO treated cells. D. Genome-wide distribution profiles of H3K4me3 and H3K36me3 binding based on ChIP-seq reads in YUMM1.7 cells treated with DMSO, 3-NPA and 3-NPA + αKG for 24 hours. E. Heatmap representation of H3K4me3 enrichment intensity based on ChIP-seq reads in YUMM1.7 cells treated with DMSO, 3-NPA and 3-NPA + αKG for 24 hours. Signals within 3 kilobases around the transcription start site (TSS) are displayed in descending order for each cluster (i.e., gained, maintained, and lost in response to 3-NPA). F. Heatmap representation of H3K36me3 enrichment intensity based on ChIP-seq reads in YUMM1.7 cells treated with DMSO, 3-NPA and 3-NPA + αKG for 24 hours. Signals within 2 kilobases around the gene body (TSS to TES (transcription end site)) are displayed in descending order for each cluster (i.e., gained and maintained in response to 3-NPA treatment). G. Volcano plots showing differentially enriched genes for H3K4me3 (Top) and H3K36me3 (Bottom) modifications from ChIP-seq data comparing DMSO and 3-NPA treated YUMM1.7 cells (P < 0.0001 and fold change > 1.25). Peaks enriched for MHC-APP genes are depicted in blue. H. Bubble plot showing fold change of H3K4me3 enrichment on promoters of representative MHC-APP genes from ChIP-seq data set comparing DMSO and 3-NPA treated YUMM1.7 cells. Color gradient depicts the log10 (P-value). I. Genome browser tracks for H3K4me3 marks at Nlrc5, Psmb9, Tap1, Psmb8, and Tap2 loci in ChIP-seq. Boxes indicate significantly enriched peaks (P < 0.0001 and fold change > 1.25) at sites of interest.J. Genome browser track for H3K36me3 at Tap1 gene body in ChIP-seq. Box indicates significantly enriched peaks (P < 0.0001 and fold change > 1.25) at sites of interest. Data points in each panel represent an independent sample. Data are presented in mean ± SD. Statistical significance was determined by One-way ANOVA with Dunnett’s multiple comparisons test for A and C.
Fig 4:
Fig 4:. Knockout of the mitochondrial CI inhibitor MCJ rewires the ETC to increase tumor immunogenicity without reducing OXPHOS: a therapeutic proof-of-concept.
A. Relative succinate levels in sgSCR (control) and sgMcj (Mcj-knock-out) YUMM1.7 cells. Data are presented in fold change relative to sgSCR cells. B. Cell surface MHC-I expression on sgSCR and sgMcj YUMM1.7 cells (n=10). MHC-I expression is presented in fold change relative to sgSCR cells. C. qRT-PCR analysis of indicated representative MHC-APP genes in sgSCR and sgMcj YUMM1.7 cells. Expression levels are presented in fold change relative to sgSCR cells. Each data point represents a technical replicate of one biological sample. Similar results were obtained with an independent biological replicate. E-I. YUMM-sgSCR (n=5 mice) and sgMcj (n=5 mice) cells were subcutaneously injected in flanks of C57BL/6 male mice and monitored for tumor formation for 20 days. Tumor growth curves (Tumor volume vs time is plotted) (E), tumor weight at day 20 (in grams) (F), cell surface MHC-I expression relative to sgSCR tumor cells at day 20 (G), numbers of tumor-infiltrating CD45+ cells (per gram tumor) at day 20 (H), CD4+ and CD8+ T cells (per gram tumor) at day 20 (I). These data are representative of three independent experiments. J. Percentage (%) of IFNγ+ and GZMB+ positive tumor infiltrating CD8+ T cells in sgSCR and sgMcj YUMM1.7 tumors. K. Tumor weights in grams of sgSCR and sgMcj YUMM1.7 tumors from C57BL/6 mice treated with IgG isotype (αIgG) and anti-CD8 (αCD8) depleting antibodies for 21 days every second day. L. UMAP projection of 8274 CD8+ T cells from YUMM1.7-sgSCR and sgMcj tumors showing the formation of two clusters with the respective labels. Each dot corresponds to a single cell, color-coded by the sample type (grey-sgSCR, orange-sgMcj). M. UMAP projection from Seurat of CD8+ T cells into 4 distinct clusters according to differentiation and functional marker expression. Each dot represents a single cell, color-coded by the cluster type. N. UMAP projections showing average expression of functional signatures in CD8+ T cell clusters identified in panel M. The differentiation and functional markers defining the cluster are shown at the top. O. UMAP projection of CD8+ T cells overlaid with TCR clonal abundance. Each dot represents a single cell, color-coded by the number of TCR clones presents. Data points in each panel represent an independent sample unless specified. Data are presented as mean ± SD for A to D and mean ± SEM for E to K. Statistical significance was determined by unpaired Welch t-test for A and B; two-way ANOVA with Dunnett’s multiple comparisons test for C, one-way ANOVA with Dunnett’s multiple comparisons test for D, unpaired Mann-Whitney test for E to H and J; two-way ANOVA with Sidak’s multiple comparisons test for I and two-way ANOVA with Tukey’s multiple comparisons test for K.

Comment in

References

    1. DeBerardinis RJ, Chandel NS, Fundamentals of cancer metabolism. Sci Adv 2, e1600200 (2016). - PMC - PubMed
    1. Martinez-Reyes I, Chandel NS, Mitochondrial TCA cycle metabolites control physiology and disease. Nat Commun 11, 102 (2020). - PMC - PubMed
    1. Martinez-Reyes I et al., Mitochondrial ubiquinol oxidation is necessary for tumour growth. Nature 585, 288–292 (2020). - PMC - PubMed
    1. Dong LF et al., Horizontal transfer of whole mitochondria restores tumorigenic potential in mitochondrial DNA-deficient cancer cells. Elife 6, (2017). - PMC - PubMed
    1. Tan AS et al., Mitochondrial genome acquisition restores respiratory function and tumorigenic potential of cancer cells without mitochondrial DNA. Cell Metab 21, 81–94 (2015). - PubMed