. 2023 Oct 3;35(10):1736-1751.e7.
doi: 10.1016/j.cmet.2023.08.010. Epub 2023 Sep 20.

Regulatory T cells require IL6 receptor alpha signaling to control skeletal muscle function and regeneration

Affiliations

Regulatory T cells require IL6 receptor alpha signaling to control skeletal muscle function and regeneration

Maike Becker et al. Cell Metab. .

Abstract

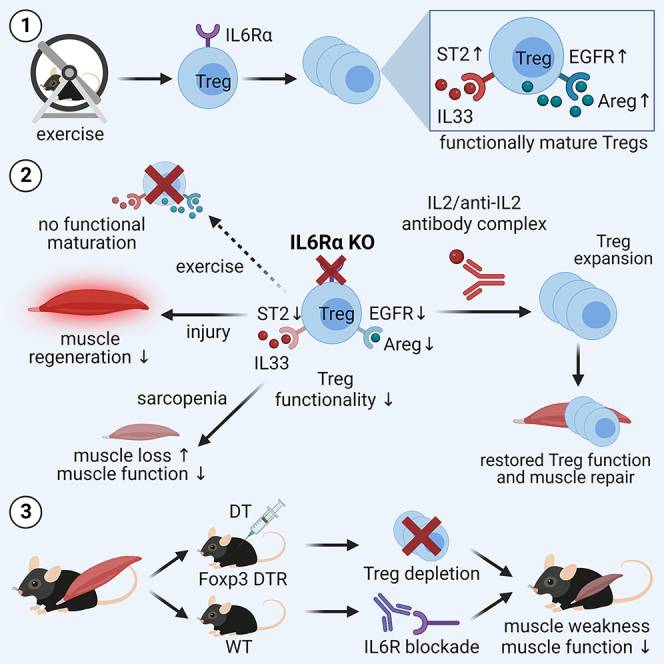
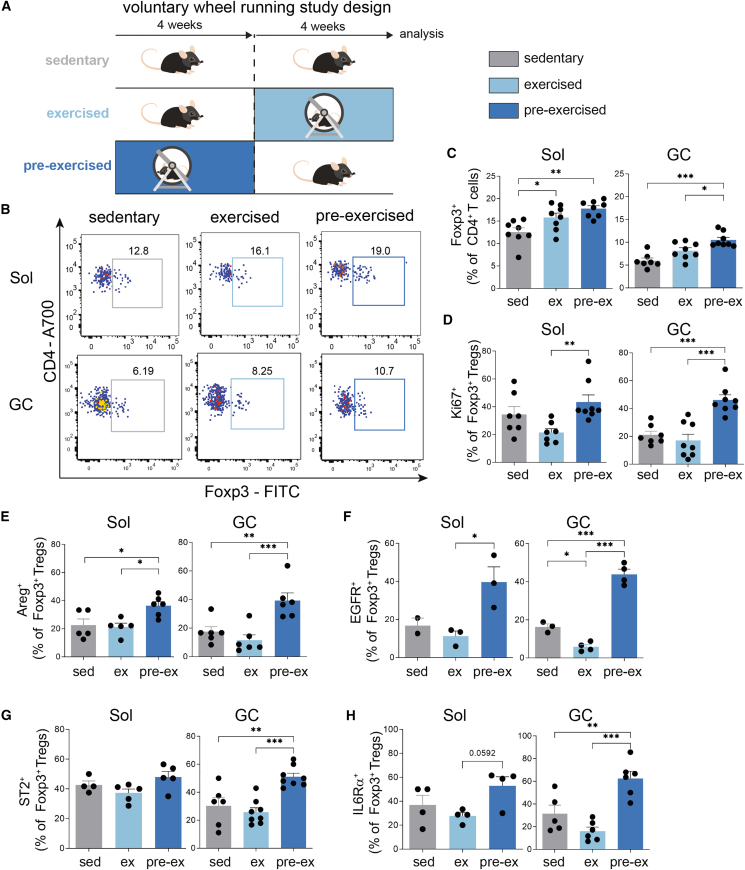
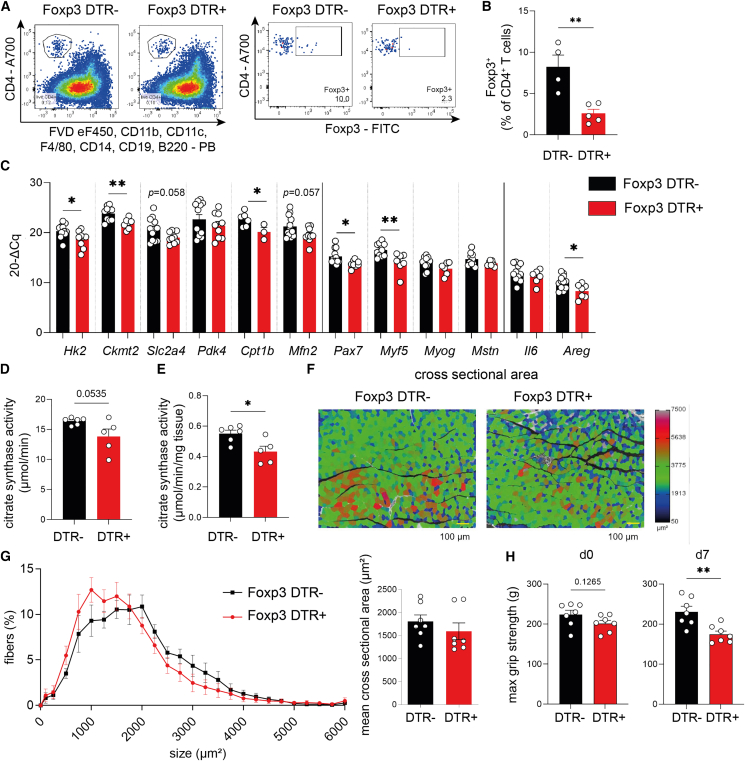
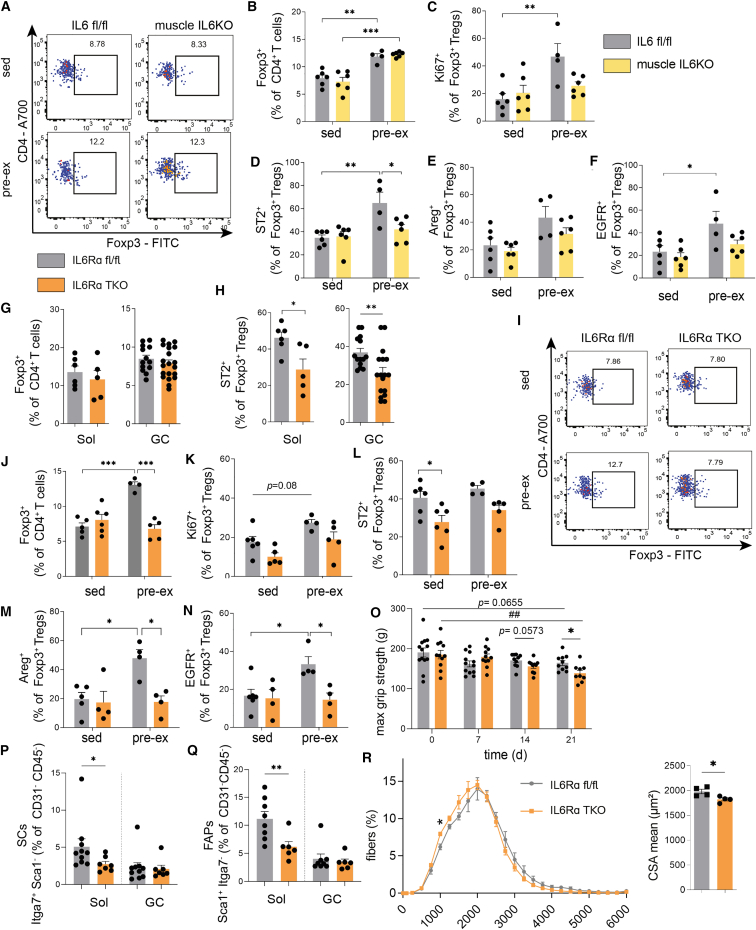
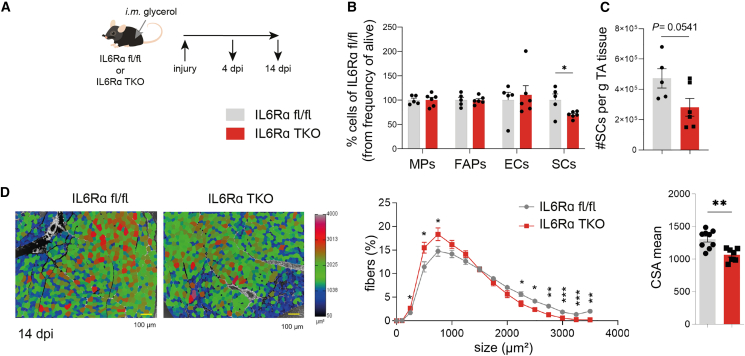
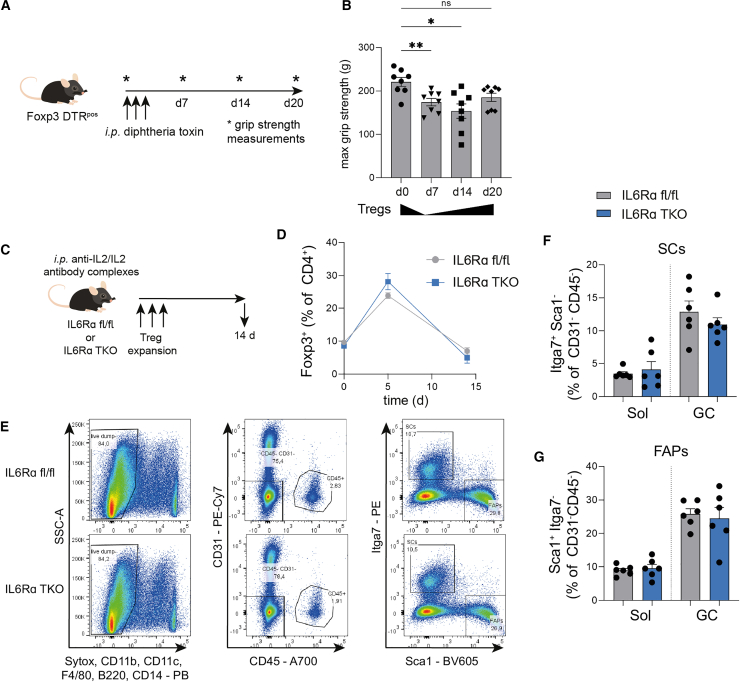
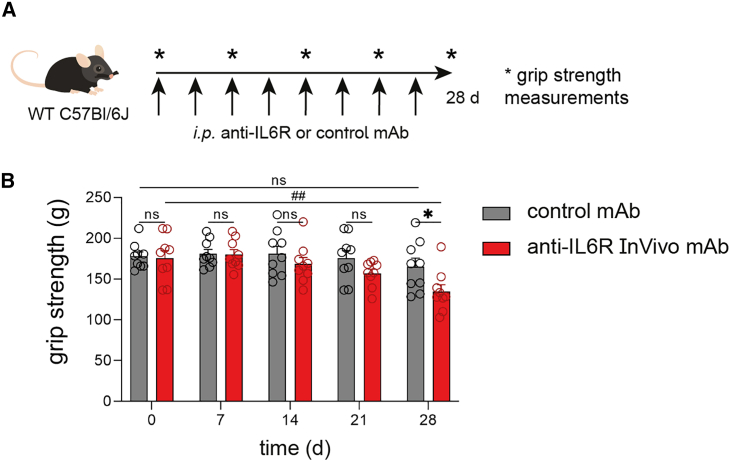
Muscle-residing regulatory T cells (Tregs) control local tissue integrity and function. However, the molecular interface connecting Treg-based regulation with muscle function and regeneration remains largely unexplored. Here, we show that exercise fosters a stable induction of highly functional muscle-residing Tregs with increased expression of amphiregulin (Areg), EGFR, and ST2. Mechanistically, we find that mice lacking IL6Rα on T cells (TKO) harbor significant reductions in muscle Treg functionality and satellite and fibro-adipogenic progenitor cells, which are required for muscle regeneration. Using exercise and sarcopenia models, IL6Rα TKO mice demonstrate deficits in Tregs, their functional maturation, and a more pronounced decline in muscle mass. Muscle injury models indicate that IL6Rα TKO mice have significant disabilities in muscle regeneration. Treg gain of function restores impaired muscle repair in IL6Rα TKO mice. Of note, pharmacological IL6R blockade in WT mice phenocopies deficits in muscle function identified in IL6Rα TKO mice, thereby highlighting the clinical implications of the findings.

Keywords: IL6Ra signaling; exercise; immune tissue crosstalk; immune-metabolic crosstalk; immunometabolism; injury; muscle function; niche-specific Tregs; tissue Tregs; voluntary wheel running.


Conflict of interest statement

Declaration of interests The authors declare no competing interests.

Figures

None
Graphical abstract
Figure 1
Figure 1
Identification of CD4+ T cells and Foxp3+ Tregs in skeletal muscles and muscle response to exercise (A and B) Representative fluorescence-activated cell sorting (FACS) plots of ex vivo muscle-residing (A) total CD4+ T cells and (B) CD4+Foxp3+ Tregs in musculus soleus (Sol), gastrocnemius (GC), tibialis anterior (TA), and extensor digitorum longus (EDL). (C) Summary graph of ex vivo muscle-residing Tregs (% of CD4+ T cells) in different muscles in the steady state. For Sol and EDL, each point corresponds to two mice (4 muscles) pooled together. (D) Gene expression analysis of Sol of sedentary (n = 6) and exercised (n = 3) WT mice subjected to voluntary wheel running for 10 days. Gene expression was normalized to histone H3. Data are represented as bar graphs with all values and as mean ± SEM. For Sol and EDL, muscles of two mice were pooled. For all other data, each point is a biological replicate. Groups were compared by Student’s unpaired two-tailed t test (D) or one-way ANOVA followed by Tukey’s post hoc test for multiple comparisons (C). p < 0.05, ∗∗p < 0.01, ∗∗∗p < 0.001. See also Figure S1.
Figure 2
Figure 2
Exercise increases Treg frequencies in muscles and induces phenotypic maturation toward tissue Tregs (A) Scheme of exercise studies indicating sedentary, exercised, and pre-ex groups. (B) Representative FACS plots showing ex vivo CD4+Foxp3+ Tregs from Sol and GC in sedentary, exercised, and pre-ex WT mice. Pre-gated on live CD4+ T cells. (C) Summary graph of ex vivo CD4+Foxp3+ Tregs from Sol and GC. For Sol, each point corresponds to two mice (four muscles) that were pooled. (D–H) Summary graph for the ex vivo characterization of Tregs for proliferation: Ki67+Foxp3+ Tregs (D), Areg (E), EGFR (F), ST2 (G), or IL6Rα (H) expression in Sol or GC. For Sol, each point corresponds to two mice (four muscles) pooled. Data are shown as bar graph with individual and mean ± SEM. For Sol, muscles of two mice were pooled. For all other data, each point is a biological replicate. Data were analyzed by one-way ANOVA followed by Tukey’s post hoc test for multiple comparisons (C–H). p < 0.05, ∗∗p < 0.01, ∗∗∗p < 0.001. See also Figures S1 and S2.
Figure 3
Figure 3
Treg depletion critically impairs muscle function (A) Representative FACS plots identifying muscle-residing CD4+Foxp3+ Tregs from muscles of Foxp3 diphtheria toxin receptor (DTR) mice, where DT treatment leads to specific depletion of Foxp3+ Tregs due to transgene expression of the DTR specifically in Tregs. Both Foxp3 DTR− and Foxp3 DTR+ littermates were treated with DT. (B) Quantification of ex vivo Foxp3+ Tregs (% of CD4+ T cells) in muscle after DT treatment of Foxp3 DTR− versus Foxp3 DTR+ mice. (C) Gene expression analysis of Sol muscle from DT-treated Foxp3 DTR− versus Foxp3 DTR+ mice. Gene expression was normalized to histone H3. (D and E) Analysis of the citrate synthase activity in GC upon Treg depletion using DT in Foxp3 DTR mice. (F and G) Cross-sectional area analysis of GC muscle upon Treg depletion using DT in Foxp3 DTR mice. Scale bar (yellow), 100 μm. (H) Maximal grip strength of Foxp3 DTR mice before Treg depletion (d0) and 7 days after Treg depletion (d7). Data are shown as bar graphs with mean ± SEM and were analyzed by Student’s unpaired two-tailed t test (B–E and H) or two-way ANOVA with Šidák post hoc test for multiple comparisons (G). p < 0.05, ∗∗p < 0.01, ∗∗∗p < 0.001. See also Figure S3.
Figure 4
Figure 4
Pro-tolerogenic impact of exercise is abolished in the absence of IL6/IL6Rα-mediated crosstalk between muscles and T cells (A and B) Representative FACS plots and summary graph identifying ex vivo muscle-residing CD4+Foxp3+ Tregs from GC muscle of IL6KO mice (Myl1 Cre/WT × Il6 fl/fl) and IL6 floxed/floxed controls in sedentary and pre-ex state. (C–F) Summary graph showing ex vivo Treg proliferation (C, Ki67+Foxp3+ Tregs; D, ST2+Foxp3+ Tregs; E, Areg+Foxp3+ Tregs; and F, EGFR+Foxp3+ Tregs) in GC of IL6KO mice and IL6 floxed/floxed controls in sedentary and pre-ex state. (G and H) Ex vivo (G) CD4+Foxp3+ Tregs and (H) ST2+Foxp3+ Tregs in Sol and GC from IL6Rα TKO (Cd4 Cre/WT × Il6ra fl/fl) and floxed control mice in the steady state. (I) Representative FACS plots of Foxp3+ Tregs in IL6Rα TKO versus floxed control mice in sedentary and pre-ex state in GC. (J) Summary graph showing the ex vivo Foxp3+ Treg frequencies in IL6Rα TKO and floxed control mice of sedentary and pre-ex mice in GC. (K–N) Summary graph representing ex vivo Treg proliferation (K, Ki67+Foxp3+ Tregs; L, ST2+Foxp3+ Tregs; M, Areg+Foxp3+ Tregs; and N, EGFR+Foxp3+ Tregs) in GC of IL6Rα TKO and floxed control mice in sedentary or pre-ex state. (O) Four-limb max grip strength of IL6Rα TKO and floxed control mice subjected to DSS-induced sarcopenia. ##p < 0.01 for IL6Rα floxed mice compared to day 0. (P and Q) Ex vivo analysis of SCs and FAPs in Sol and GC muscles of IL6Rα TKO and floxed control mice in the steady state. (R) Cross-sectional area analysis of GC muscle of pre-ex IL6Rα TKO and floxed control mice. Data are shown as bar graphs with individual values and as mean ± SEM. For analyses of Sol, the muscles of two mice were combined into one sample. For all other samples, each point refers to a biological replicate. Data were analyzed by Student’s unpaired two-tailed t test (G, H, and R) or two-way ANOVA followed by Tukey’s post hoc test for multiple comparisons (B–F and J–R). p < 0.05, ##,∗∗p < 0.01, ∗∗∗p < 0.001. See also Figures S4 and S5.
Figure 5
Figure 5
Mice with T cell-specific loss of IL6Rα have significantly impaired muscle regeneration upon injury (A) Scheme of the muscle injury model. Injury was induced by intramuscular (i.m.) injection of 2 × 12.5 μL glycerol into TA muscle in IL6Rα TKO and floxed control mice. (B and C) FACS analysis identifying ex vivo macrophages (MPs), FAPs, endothelial cells (ECs), and SCs upon muscle injury in IL6Rα TKO and floxed control mice 4 days post-injury. (D) Analysis of the cross-sectional area of TA muscle upon muscle injury in IL6Rα TKO and floxed control mice 14 days post-injury. Scale bar (yellow), 100 μm. Data are shown as bar graphs with individual values and as mean ± SEM. Each point refers to a biological replicate. Data were analyzed by Student’s unpaired two-tailed t test (B–D) or two-way ANOVA with Šidák post hoc test for multiple comparisons (D). p < 0.05, ∗∗p < 0.01, ∗∗∗p < 0.001. See also Figure S6.
Figure 6
Figure 6
Treg expansion using anti-IL2/IL2 antibody complexes restores muscle regenerative capacity in IL6Rα TKO mice (A and B) Scheme of the Treg recovery experiment using Foxp3 DTR+ mice. Max grip strength (g) was assessed once a week. (C) Scheme of the gain-of-function model where Treg expansion is induced by three i.p. injections of anti-IL2/IL2 antibody complexes in IL6Rα TKO mice or floxed controls. (D) Foxp3+ Treg frequencies in peripheral blood at the indicated time points upon Treg expansion. (E–G) Representative FACS plots (E) and quantification of SCs (F) and FAPs (G) in Sol and one GC upon Treg expansion in IL6Rα TKO versus floxed mice. In contrast to Figure 4, all isolations were done with only 1 GC muscle being used for flow cytometric analyses. Data are shown as bar graphs with individual values and as mean ± SEM. Each point refers to a biological replicate. One- (B, F, and G) or two-way ANOVA (D and G) with Šidák post hoc test for multiple comparisons. p < 0.05, ∗∗p < 0.01; ns, p > 0.05.
Figure 7
Figure 7
Pharmacological IL6R targeting impairs muscle function in WT mice (A) Scheme for pharmacological IL6R targeting in WT mice. Anti-IL6R or control mAb was injected twice per week. Grip strength measurements were performed once a week. (B) Grip strength measurements of (A). Data are shown as bar graphs with individual values and as mean ± SEM. Each point refers to a biological replicate. Two-way ANOVA with Šidák post hoc test for multiple comparisons (B). p < 0.05, ##p < 0.01. See also Figure S7.

References

    1. Hotamisligil G.S. Foundations of immunometabolism and implications for metabolic health and disease. Immunity. 2017;47:406–420. doi: 10.1016/j.immuni.2017.08.009. - DOI - PMC - PubMed
    1. Mattson M.P., Longo V.D., Harvie M. Impact of intermittent fasting on health and disease processes. Ageing Res. Rev. 2017;39:46–58. doi: 10.1016/j.arr.2016.10.005. - DOI - PMC - PubMed
    1. Hojman P., Gehl J., Christensen J.F., Pedersen B.K. Molecular mechanisms linking exercise to cancer prevention and treatment. Cell Metab. 2018;27:10–21. doi: 10.1016/j.cmet.2017.09.015. - DOI - PubMed
    1. Burzyn D., Kuswanto W., Kolodin D., Shadrach J.L., Cerletti M., Jang Y., Sefik E., Tan T.G., Wagers A.J., Benoist C., Mathis D. A special population of regulatory T cells potentiates muscle repair. Cell. 2013;155:1282–1295. doi: 10.1016/j.cell.2013.10.054. - DOI - PMC - PubMed
    1. Panduro M., Benoist C., Mathis D. T(reg) cells limit IFN-gamma production to control macrophage accrual and phenotype during skeletal muscle regeneration. Proc. Natl. Acad. Sci. USA. 2018;115:E2585–E2593. doi: 10.1073/pnas.1800618115. - DOI - PMC - PubMed

Publication types

Substances