. 2023 Dec 15;79(1):13-22.
doi: 10.1136/thorax-2023-220021.

Automatic analysis of bronchus-artery dimensions to diagnose and monitor airways disease in cystic fibrosis

Affiliations

Automatic analysis of bronchus-artery dimensions to diagnose and monitor airways disease in cystic fibrosis

Qianting Lv et al. Thorax. .

Abstract

Background: Cystic fibrosis (CF) lung disease is characterised by progressive airway wall thickening and widening. We aimed to validate an artificial intelligence-based algorithm to assess dimensions of all visible bronchus-artery (BA) pairs on chest CT scans from patients with CF.

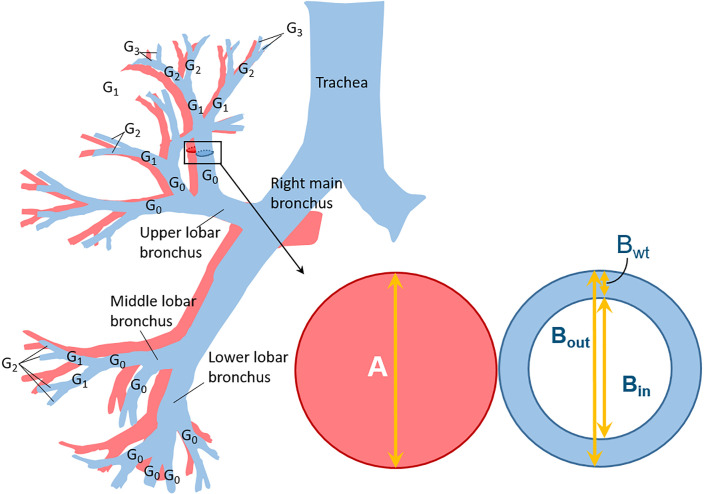
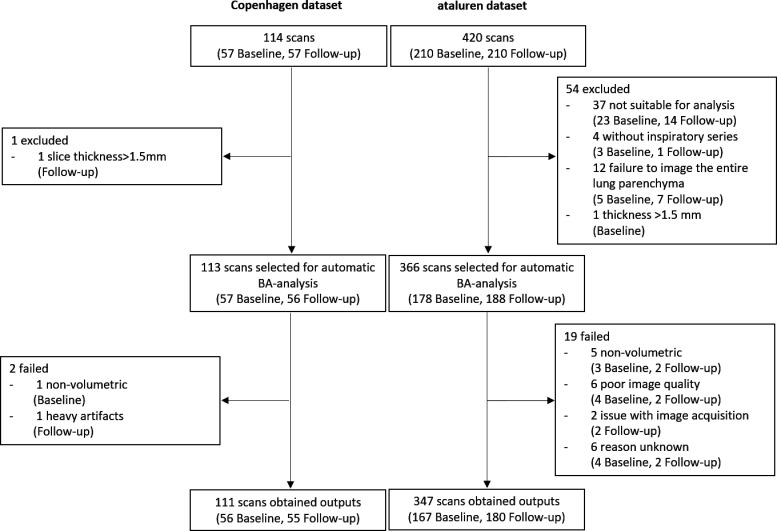
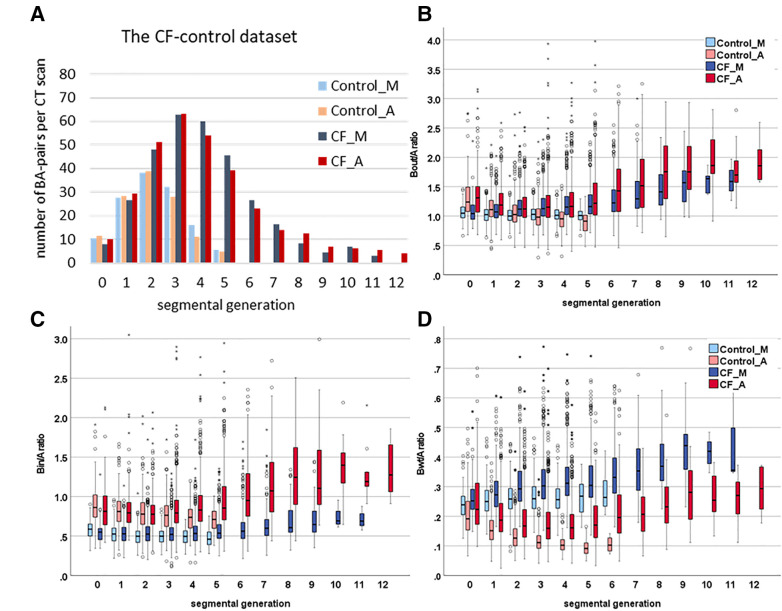
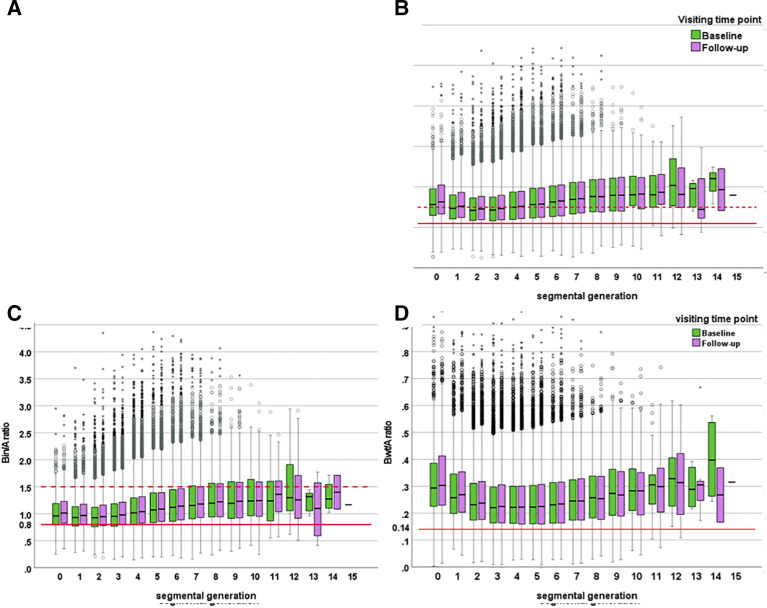
Methods: The algorithm fully automatically segments the bronchial tree; identifies bronchial generations; matches bronchi with the adjacent arteries; measures for each BA-pair bronchial outer diameter (Bout), bronchial lumen diameter (Bin), bronchial wall thickness (Bwt) and adjacent artery diameter (A); and computes Bout/A, Bin/A and Bwt/A for each BA pair from the segmental bronchi to the last visible generation. Three datasets were used to validate the automatic BA analysis. First BA analysis was executed on 23 manually annotated CT scans (11 CF, 12 control subjects) to compare automatic with manual BA-analysis outcomes. Furthermore, the BA analysis was executed on two longitudinal datasets (Copenhagen 111 CTs, ataluren 347 CTs) to assess longitudinal BA changes and compare them with manual scoring results.

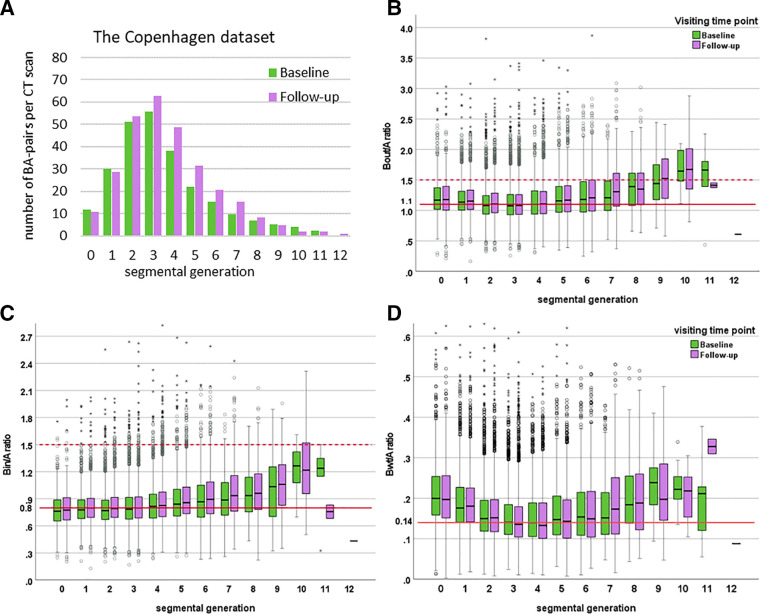
Results: The automatic and manual BA analysis showed no significant differences in quantifying bronchi. For the longitudinal datasets the automatic BA analysis detected 247 and 347 BA pairs/CT in the Copenhagen and ataluren dataset, respectively. A significant increase of 0.02 of Bout/A and Bin/A was detected for Copenhagen dataset over an interval of 2 years, and 0.03 of Bout/A and 0.02 of Bin/A for ataluren dataset over an interval of 48 weeks (all p<0.001). The progression of 0.01 of Bwt/A was detected only in the ataluren dataset (p<0.001). BA-analysis outcomes showed weak to strong correlations (correlation coefficient from 0.29 to 0.84) with manual scoring results for airway disease.

Conclusion: The BA analysis can fully automatically analyse a large number of BA pairs on chest CTs to detect and monitor progression of bronchial wall thickening and bronchial widening in patients with CF.

Keywords: Bronchiectasis; Cystic Fibrosis; Imaging/CT MRI etc; Paediatric Lung Disaese.


Conflict of interest statement

Competing interests: HT has received in the last 5 years multiple grants from the following public and institutional grant institutions for lung structure and function research: NHMRC, NIH, CFF, ECFS, IMI, Sophia Foundation. He received unconditional grants for investigator-initiated research from Chiesi; Vectura, Novartis and Insmed. He has acted as consultant for Insmed, TBIO, Thirona, Neupharma and Boehringer. He has a part time position as chief medical officer for Thirona. He functions as vice chair and faculty for the Advance course sponsored by Vertex. He owns no shares. LG-E is a scientist working at Thirona. JPC is shareholder at Thirona. DC is director of the Erasmus MC-LungAnalysis laboratory. PC acted as consultant for Vertex and Chiesi Pharmaceuticals.

Figures

Figure 1
Figure 1
The schematic view of the bronchial tree and of an bronchus-artery (BA) pair in cross-section showing the measurements taken for each bronchus. The bronchial tree (blue) with its accompanying artery system (pink) is shown on the left. The segmental bronchi are defined as G0 and the subsegmental bronchi as G1. When a bronchus splits into two or more, the generation number increases by one. On the right a BA pair is shown, the bronchus in blue and the adjacent artery in pink. The arrows depict the bronchus and artery dimensions that can be measured by the automatic BA analysis: bronchial outer diameter (Bout); bronchial lumen diameter (Bin), bronchial wall thickness (Bwt) and adjacent artery diameter (A). From these dimensions, BA ratios Bout/A and Bin/A are computed to detect bronchial widening and Bwt/A to detect bronchial wall thickening.
Figure 2
Figure 2
Flow chart of two longitudinal datasets. BA, bronchus artery.
Figure 3
Figure 3
Number of BA pairs per CT scan and the distribution of BA ratios for the CF-control dataset assessed by the manual and automatic BA analysis for each segmental generation.Control_M: control subjects assessed by the manual method (light blue); Control_A: control subjects assessed by automatic BA analysis (pink); CF_M: subjects with cystic fibrosis assessed by the manual method (dark blue); CF_A: subjects with cystic fibrosis assessed by the automatic BA analysis (red); Bout/A ratio: ratio between bronchial outer diameter and adjacent artery diameter; Bin/A ratio: ratio between bronchial lumen diameter and adjacent artery diameter; Bwt/A ratio: ratio between bronchial wall thickness and adjacent artery diameter. Horizontal axis: 0 indicates the segmental bronchi and 1 and higher indicates consecutive subsegmental generations. (A) histogram shows the number of BA pairs per CT scan by segmental generations in the CF-control dataset. Boxplots (B–D) show boxplots for Bout/A ratio (B), Bin/A ratio (C), Bwt/A ratio (D) by segmental generation in the CF-control dataset. Each box shows median (horizontal line), IQR (solid box), 1.5×quartile range (whiskers) and outliers (circles and asterisks). BA, bronchus artery; CF, cystic fibrosis.
Figure 4
Figure 4
The number of bronchus-artery (BA) pairs for the Copenhagen dataset per CT scan and distribution of BA ratios at baseline and follow-up over 2 years for each segmental generation. Bout/A ratio: the ratio of bronchial outer diameter and adjacent artery diameter; Bin/A ratio: the ratio of bronchial lumen diameter and adjacent artery diameter; Bwt/A ratio: the ratio of bronchial wall thickness and adjacent artery diameter. Horizontal axis, 0 indicates the segmental bronchi and 1 and higher indicate consecutive subsegmental generations. (A) histogram shows the number of BA pairs per CT scan at baseline and follow-up by segmental generations. Boxplots (B–D) show the relation between Bout/A ratio (B), Bin/A ratio (C), Bwt/A ratio (D) at baseline and follow-up by segmental generation. Each box shows median (horizontal line), IQR (solid box), 1.5×quartile range (whiskers) and outliers (circles and asterisks). The red solid lines in B and D represent the computed cut-off values for bronchial widening and wall thickening. The red dotted line in B and C represents the conservative cut-off value for bronchiectasis of 1.5. BA, bronchus artery.
Figure 5
Figure 5
The number of BA pairs for the ataluren dataset per CT scan and the distribution of BA ratios at baseline and follow-up over 48 weeks for each segmental generation. BA pair: BA pair; Bout/A ratio: the ratio of bronchial outer diameter and adjacent artery diameter; Bin/A ratio: the ratio of bronchial lumen diameter and adjacent artery diameter; Bwt/A ratio: the ratio of bronchial wall thickness and adjacent artery diameter. Horizontal axis, 0 indicates the segmental bronchi and 1 and higher indicate consecutive subsegmental generations. (A) histogram shows the number of BA pairs per CT scan at baseline and follow-up by segmental generations. Boxplots (B–D) show the relation between Bout/A ratio (B), Bin/A ratio (C), Bwt/A ratio (D) at baseline and follow-up by segmental generation. Each box shows median (horizontal line), IQR (solid box), 1.5×quartile range (whiskers) and outliers (circles and asterisks). The red solid lines in A, B and C represent the computed cut-off values for bronchial widening and wall thickening. The red dotted line represents the conservative cut-off value for bronchiectasis of 1.5. BA, bronchus artery.

References

    1. Sly PD, Gangell CL, Chen L, et al. . Risk factors for bronchiectasis in children with cystic fibrosis. N Engl J Med 2013;368:1963–70. 10.1056/NEJMoa1301725 - DOI - PubMed
    1. Murphy KP, Maher MM, O’Connor OJ. Imaging of cystic fibrosis and pediatric bronchiectasis. AJR Am J Roentgenol 2016;206:448–54. 10.2214/AJR.15.14437 - DOI - PubMed
    1. Tiddens H, Chen Y, Andrinopoulou E-R, et al. . The effect of inhaled hypertonic saline on lung structure in children aged 3-6 years with cystic fibrosis (SHIP-CT): a multicentre, randomised, double-blind, controlled trial. Lancet Respir Med 2022;10:669–78. 10.1016/S2213-2600(21)00546-4 - DOI - PubMed
    1. Bouma NR, Janssens HM, Andrinopoulou E-R, et al. . Airway disease on chest computed tomography of preschool children with cystic fibrosis is associated with school-age bronchiectasis. Pediatr Pulmonol 2020;55:141–8. 10.1002/ppul.24498 - DOI - PMC - PubMed
    1. Svedberg M, Gustafsson P, Tiddens H, et al. . Risk factors for progression of structural lung disease in school-age children with cystic fibrosis. J Cyst Fibros 2020;19:910–6. 10.1016/j.jcf.2019.10.014 - DOI - PubMed