. 2023 Sep 21;8(1):370.
doi: 10.1038/s41392-023-01622-1.

Dynamic single-cell mapping unveils Epstein‒Barr virus-imprinted T-cell exhaustion and on-treatment response

Affiliations

Dynamic single-cell mapping unveils Epstein‒Barr virus-imprinted T-cell exhaustion and on-treatment response

Miao-Zhen Qiu et al. Signal Transduct Target Ther. .

Abstract

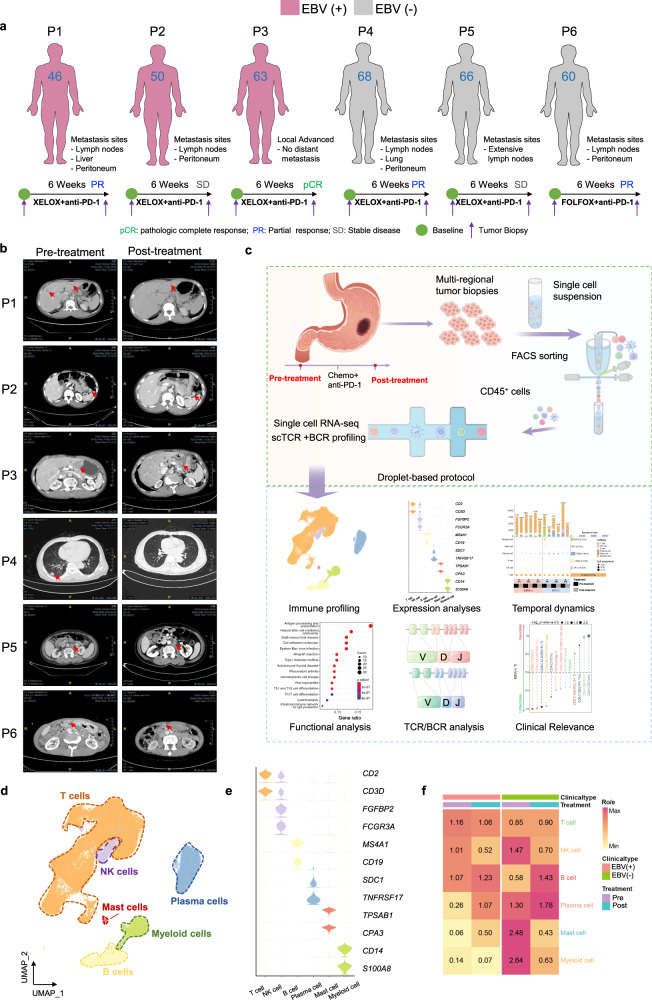
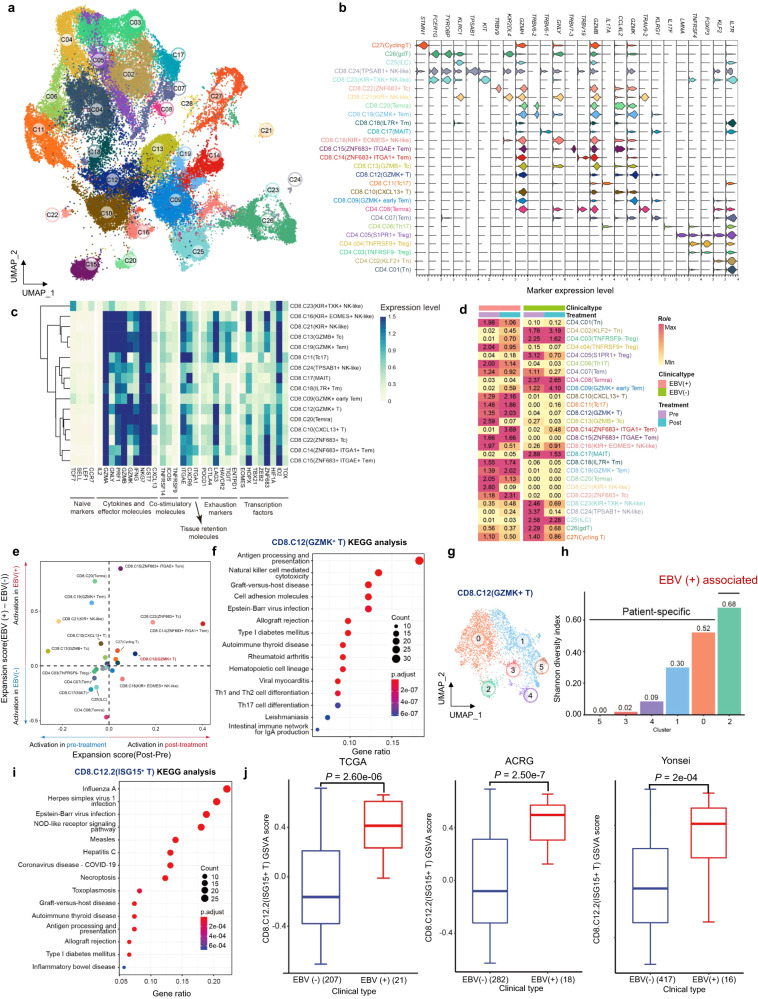
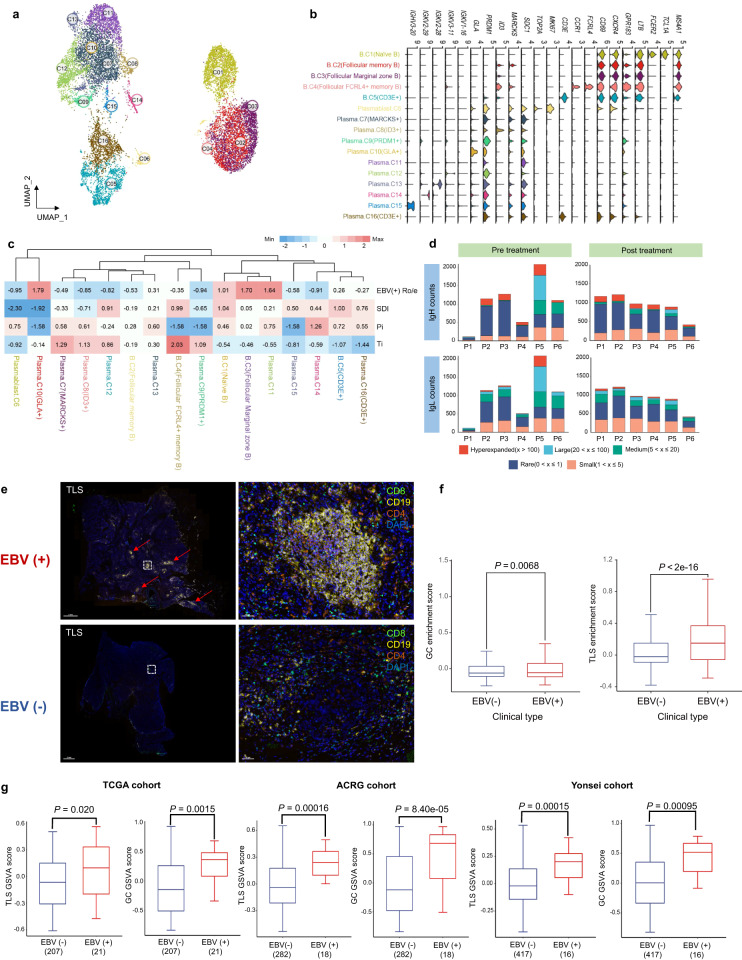
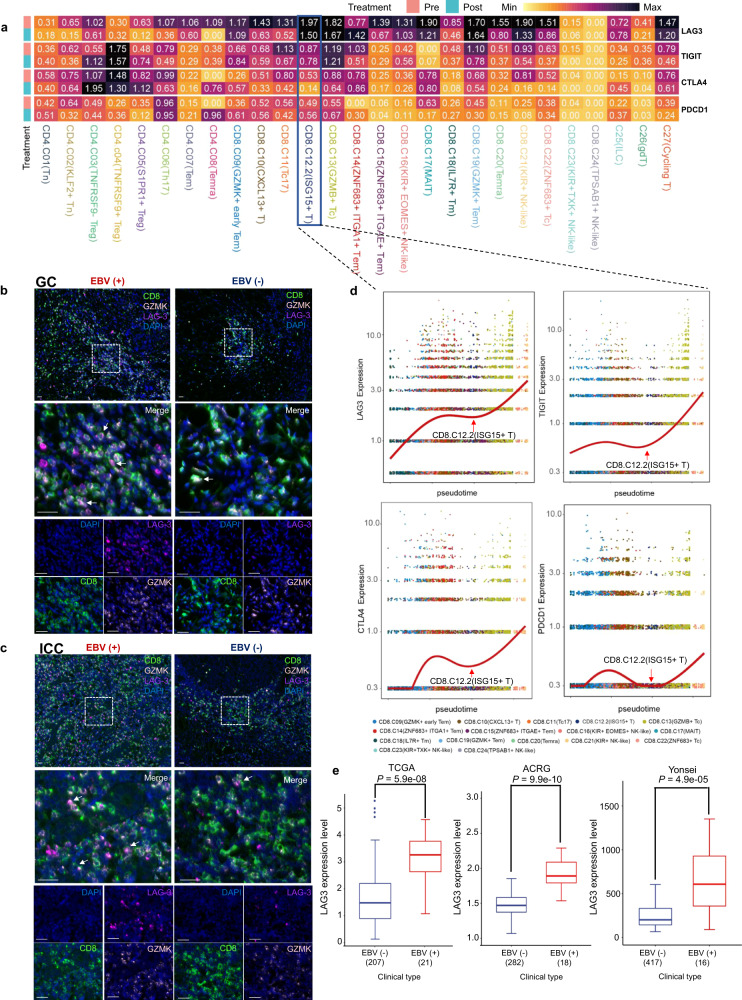
Epstein‒Barr virus (EBV)-associated gastric cancer (GC) manifests an intriguing immunotherapy response. However, the cellular basis for EBV-imprinted tumour immunity and on-treatment response remains undefined. This study aimed to finely characterize the dynamic tumour immune contexture of human EBV (+) GC treated with immunochemotherapy by longitudinal scRNA-seq and paired scTCR/BCR-seq. EBV (+) GC exhibits an inflamed-immune phenotype with increased T-cell and B-cell infiltration. Immunochemotherapy triggers clonal revival and reinvigoration of effector T cells which step to determine treatment response. Typically, an antigen-specific ISG-15+CD8+ T-cell population is highly enriched in EBV (+) GC patients, which represents a transitory exhaustion state. Importantly, baseline intratumoural ISG-15+CD8+ T cells predict immunotherapy responsiveness among GC patients. Re-emerged clonotypes of pre-existing ISG-15+CD8+ T cells could be found after treatment, which gives rise to a CXCL13-expressing effector population in responsive EBV (+) tumours. However, LAG-3 retention may render the ISG-15+CD8+ T cells into a terminal exhaustion state in non-responsive EBV (+) tumours. In accordance, anti-LAG-3 therapy could effectively reduce tumour burden in refractory EBV (+) GC patients. Our results delineate a distinct implication of EBV-imprinted on-treatment T-cell immunity in GC, which could be leveraged to optimize the rational design of precision immunotherapy.


Conflict of interest statement

The authors declare no competing interests.

Figures

Fig. 1
Fig. 1
Distinct single-cell immune landscape of advanced EBV (+) GC and EBV (−) GC. a The presentation includes an overview of the baseline demographic characteristics and the management course. b Representative images of CT (n = 6) showing the different treatment responses of GC patients to immunochemotherapy. c Schematic diagram of the experimental plan and analytical workflow. d UMAP visualization of 84,846 immune cells from all 72 tumour samples, showing the formation of six main clusters. e Stacked violin plot showing the marker genes expression of the major lineages of immune cells. f Heatmap displaying the EBV state preferences and treatment stages of immune cell lineages estimated using the Ro/e score which represents the ratio of observed to expected cell number. Center number indicates the Ro/e value
Fig. 2
Fig. 2
Identification of an EBV-imprinted intratumoural CD8+ T-cell compartment. a UMAP visualization of 61,348 T cells identifying 28 subpopulations. b Stacked violin plot showing the marker genes expression of major T-cell subpopulations. c Heatmap showing the expression of T-cell-related function genes including naÏve markers, cytokines and effector molecules, co-stimulatory molecules, tissue retention markers, exhaustion markers and transcription factors. d Heatmap representing the EBV state preferences and treatment stage of major T-cell subpopulations. Center number indicates the Ro/e value. e Scatter plot showing the expansion scores of T-cell subpopulations. Variation of expansion scores for different treatment stages and EBV infection states are shown on the x-axis and y-axis. f KEGG pathways enriched in the GZMK+ T cells (CD8.C12 cluster), ranked by gene ratio which is the ratio of genes related to signature to total number of genes in signature. g UMAP visualization of 3616 GZMK+ T cells (CD8.C12 cluster) identifying six subpopulations. h Shannon diversity index (SDI) of six subpopulations from GZMK+ T cells (CD8.C12 cluster). i The KEGG pathways enriched in the ISG-15+ T cells (CD8.C12.2 cluster), ranked by gene ratio which is the ratio of genes related to signature to total number of genes in signature. j Gene set variation analysis (GSVA) of ISG-15+ T cells (CD8.C12.2 cluster), using TCGA-STAD (n = 228), ACRG cohort (n = 300) and Yonsei cohort (n = 433). The horizontal line shows the median, the box comprises the interquartile range and the whiskers extend to the 5th and 95th percentiles. P values were computed using a two-sided Wilcoxon test
Fig. 3
Fig. 3
High baseline intratumoural ISG-15+CD8+ T cells indicated benefit from immunochemotherapy. a mIHC staining in representative EBV (+) and EBV (−) GC samples for the following markers: CD8, GZMK, ISG-15 and DAPI. A dashed box represents the 4.5× enlarged area shown in the right panels with separate channels. White arrows point to cells positive for ISG-15, GZMK and CD8. Scale bar, 25 μm. b mIHC staining in representative EBV (+) and EBV (−) ICC samples for the following markers: CD8, GZMK, ISG-15 and DAPI. A dashed box represents the 4.5× enlarged area shown in the right panels with separate channels. White arrows point to cells positive for ISG-15, GZMK and CD8. Scale bar, 25 μm. c Box plot showing the expansion scores of the ISG-15+ T cells (CD8.C12.2 cluster) of GC patients. The horizontal line shows the median, the box comprises the interquartile range and the whiskers extend to 5th and 95th percentiles. P values computed using a two-sided Wilcoxon test. d Scatter plot showing the expansion scores of ISG-15+ T cells (CD8.C12.2 cluster) and EBV DNA titre (copies/mL) in EBV (+) GC patients. The blue line indicates linear regression relationships computed over each treatment stage of patients independently. e, f The Ti (e) and Pi (f) of major T-cell subpopulations in EBV (+) GC tumours. Ti, therapeutic index; Pi, predictive index. Dot size represents the significance calculated by −Log10 (P-value). Each dot is coloured according to its T-cell subpopulations. g GSVA analysis of ISG-15+CD8+T cells signature in GC patients treated with anti-PD1 immunotherapy (PRJEB25780 cohorts, n = 45) The horizontal line shows the median, the box comprises interquartile range and the whiskers extend to 5th and 95th percentiles. P values were calculated by a two-sided Wilcoxon test. h Kaplan–Meier survival plot of overall survival based on GSVA score of ISG-15+CD8+T cells signature using Melanoma_PRJEB23709 (n = 91) and Urothelial cancer_Atezo cohorts (n = 298). i The upper UMAP plot showing the developmental trajectories (black lines) of T-cell subpopulations inferred by monocle3. In the lower UMAP plot, the left panel represents different developmental states, indicated by a pseudo-time score ranging from dark blue to yellow. The right panel represents the EBV state. j Sankey diagram showing the clonal TCRs (TCR frequency ≥ 2) flow of ISG-15+CD8+T cells (CD8.C12.2 cluster) before and after treatment. The TCR sequences are shown in the lower right corner, with the EBV-specific TCR clones highlighted in red
Fig. 4
Fig. 4
Broad upregulation of the B-cell responses in the TME of EBV (+) GC. a UMAP visualization of 14,706 B cells identifying 16 subpopulations. b Stacked violin plot showing the marker genes expression of major B-cell subpopulations. c Heatmap showing four indexes of each B-cell subpopulation. EBV (+) Ro/e showing EBV positive preferences of B-cell subpopulations estimated by Ro/e score. Center number indicates the Ro/e value. SDI Shannon diversity index, Pi predictive index, Ti therapeutic index. d Counts for BCRs identified in GC patients treated with immunochemotherapy. Both the IgH and IgL are evaluated with different treatment stages as shown. e mIHC staining in representative EBV (+) and EBV (−) GC samples for the following markers: CD8, CD4, CD19 and DAPI. A dashed box represents the 40× enlarged area shown in the right panels. Red arrows point to TLSs. Scale bar, 2 mm (left) or 50 μm (right). f and g GSVA scores of TLS and GC signatures in our single-cell RNA-seq dataset and TCGA, ACRG and Yonsei cohort. The horizontal line shows the median, the box comprises interquartile range and the whiskers extend to 5th and 95th percentiles. P values were calculated by two-sided Wilcoxon test
Fig. 5
Fig. 5
Enrichment of dysfunctional LAG-3+CD8+ T cells in EBV ( +) GC. a Heatmap showing the expression of immune checkpoints in T-cell subpopulations of EBV positive patients divided by treatment stages. Center number indicates the average expression of immune checkpoints. b mIHC staining in representative EBV (+) and EBV (−) GC samples for the following markers: CD8, GZMK, LAG-3 and DAPI. A dashed box represents the 4.5× enlarged area shown in the right panels with separate channels. White arrows point to cells positive for LAG-3, GZMK and CD8. Scale bar, 25 μm. c mIHC staining in representative EBV (+) and EBV (−) ICC samples for the following markers: CD8, GZMK, LAG-3 and DAPI. A dashed box represents the 4.5× enlarged area shown in the right panels with separate channels. White arrows point to cells positive for LAG-3, GZMK and CD8. Scale bar, 25 μm. d Scatterplot showing indicated gene expression of T-cell subpopulations ordered across pseudotime. The red line represents the variation of gene expression estimated by a generalized linear model. e Boxplot showing the LAG-3 expression in EBV (+) and EBV (−) GC samples (TCGA, ACRG and Yonsei cohorts). The horizontal line shows the median, the box comprises the interquartile range and the whiskers extend to the 5th and 95th percentiles. P values were calculated by a two-sided Wilcoxon test
Fig. 6
Fig. 6
Anti-LAG-3 blockade effectively reduced tumour size in refractory EBV (+) GC. a A representative case of EBV (+) GC patient treated with MGD013. Flow chart showing each line of treatment options for the patient. b Representative mIHC staining in the EBV (+ ) GC sample before treatment of MGD013 for the following markers: CD8, GZMK, LAG-3 and DAPI. A dashed box represents the 4.5× enlarged area shown in the right panels with separate channels. White arrows point to cells positive for LAG-3, GZMK and CD8. Scale bar, 25 μm. c CT Imaging showing the response of this EBV (+) GC patient to MGD013 treatment. d A representative case of EBV (+) GC patient treated with KL-A289. Flow chart showing each line of treatment options for the patient. e Representative mIHC staining in the EBV (+) GC sample before treatment of KL-A289 for the following markers: CD8, GZMK, LAG-3 and DAPI. A dashed box represents the 4.5× enlarged area shown in the right panels with separate channels. White arrows point to cells positive for LAG-3, GZMK and CD8. Scale bar, 25 μm. f CT Imaging showing the response of this EBV (+) GC to KL-A289 treatment. g Dynamic changes of EBV DNA titre in this EBV (+) GC to KL-A289 treatment

References

    1. Sung H, et al. Global Cancer Statistics 2020: GLOBOCAN estimates of incidence and mortality worldwide for 36 cancers in 185 countries. CA Cancer J. Clin. 2021;71:209–249. - PubMed
    1. Qiu H, Cao S, Xu R. Cancer incidence, mortality, and burden in China: a time-trend analysis and comparison with the United States and United Kingdom based on the global epidemiological data released in 2020. Cancer Commun. (Lond.) 2021;41:1037–1048. - PMC - PubMed
    1. Kato K, et al. Nivolumab versus chemotherapy in patients with advanced oesophageal squamous cell carcinoma refractory or intolerant to previous chemotherapy (ATTRACTION-3): a multicentre, randomised, open-label, phase 3 trial. Lancet Oncol. 2019;20:1506–1517. - PubMed
    1. Joshi SS, Badgwell BD. Current treatment and recent progress in gastric cancer. CA Cancer J. Clin. 2021;71:264–279. - PMC - PubMed
    1. Wang F, et al. Safety, efficacy and tumor mutational burden as a biomarker of overall survival benefit in chemo-refractory gastric cancer treated with toripalimab, a PD-1 antibody in phase Ib/II clinical trial NCT02915432. Ann. Oncol. 2019;30:1479–1486. - PMC - PubMed

Publication types

MeSH terms