. 2023 Sep 21;14(9):621.
doi: 10.1038/s41419-023-06147-7.

The arginase 1/ornithine decarboxylase pathway suppresses HDAC3 to ameliorate the myeloid cell inflammatory response: implications for retinal ischemic injury

Affiliations

The arginase 1/ornithine decarboxylase pathway suppresses HDAC3 to ameliorate the myeloid cell inflammatory response: implications for retinal ischemic injury

Esraa Shosha et al. Cell Death Dis. .

Abstract

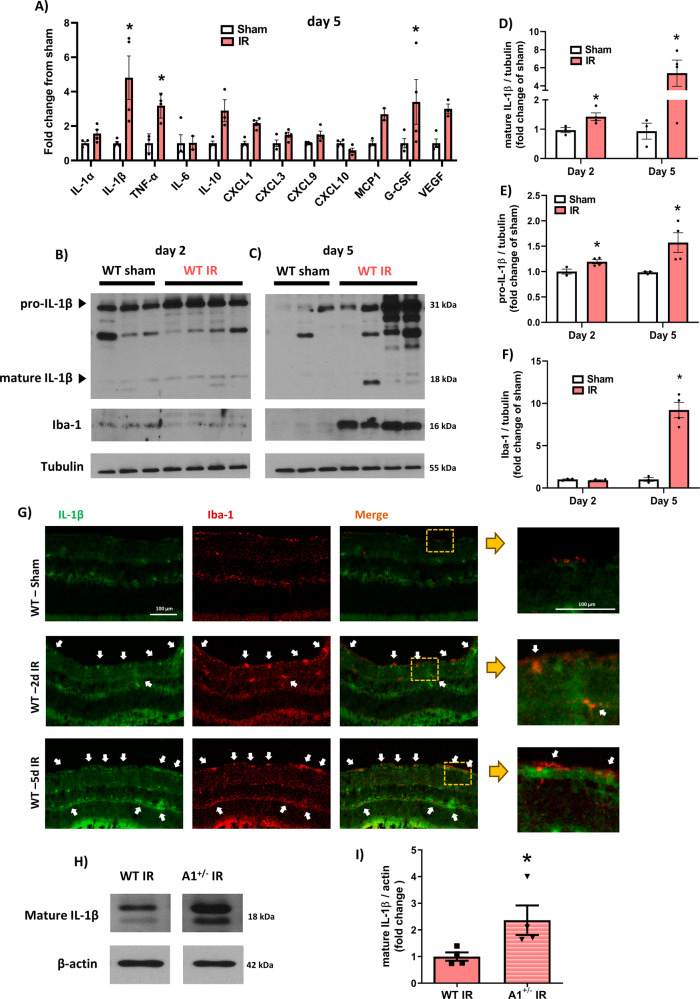
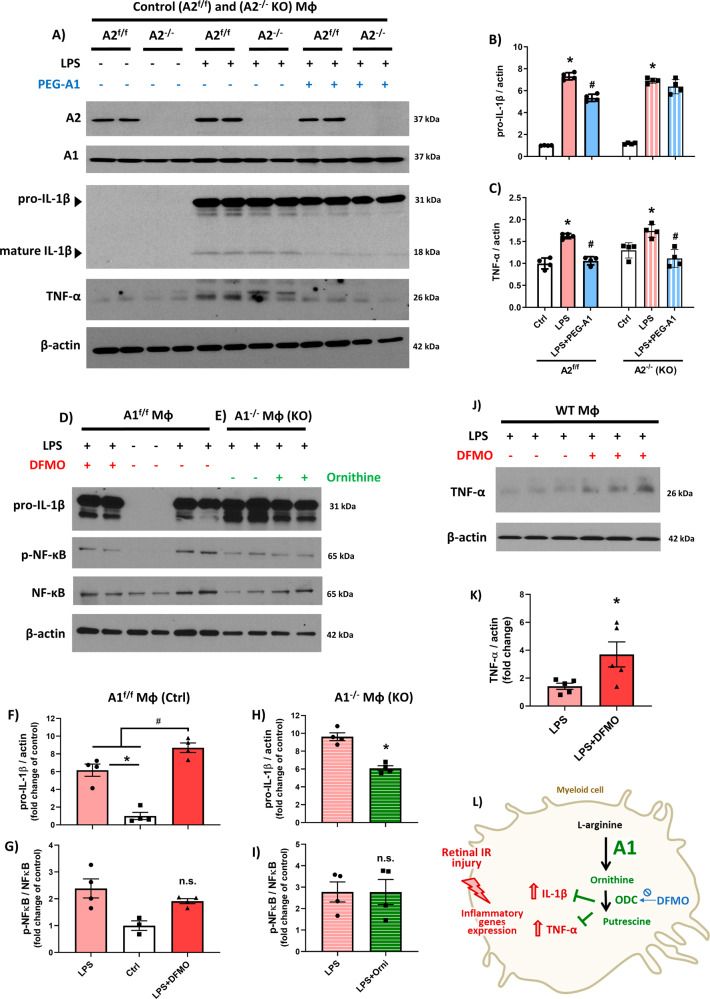
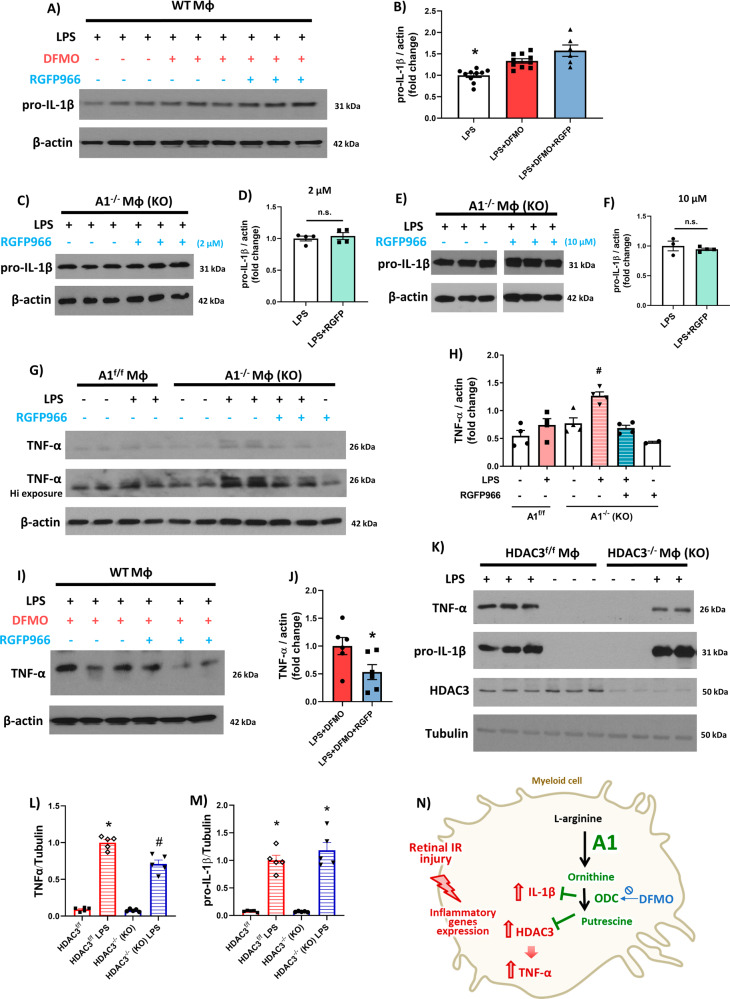
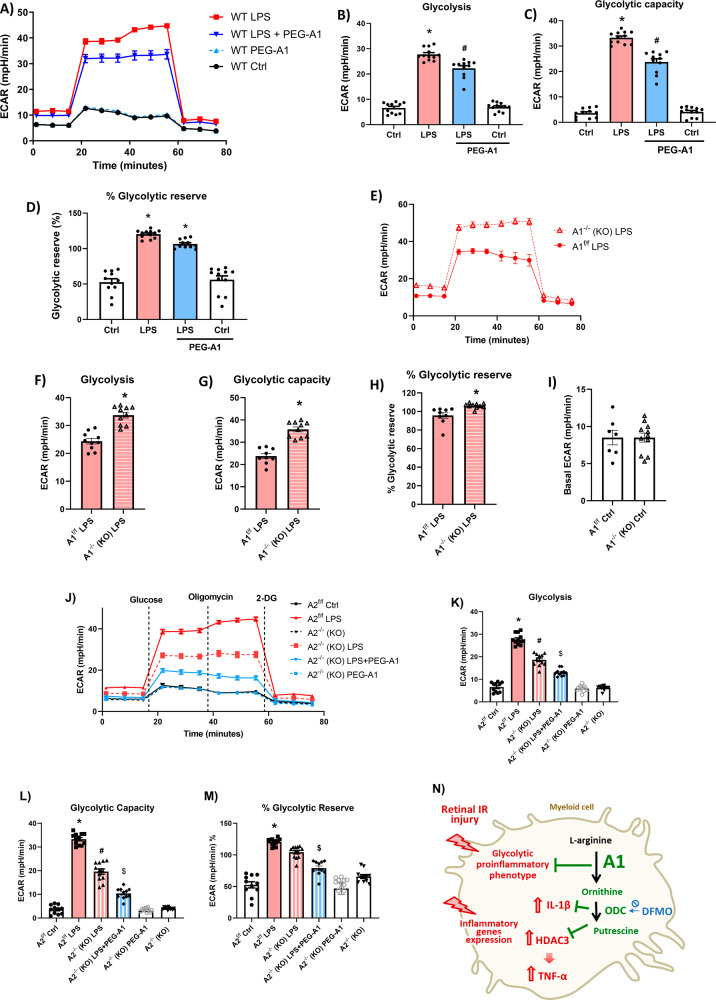
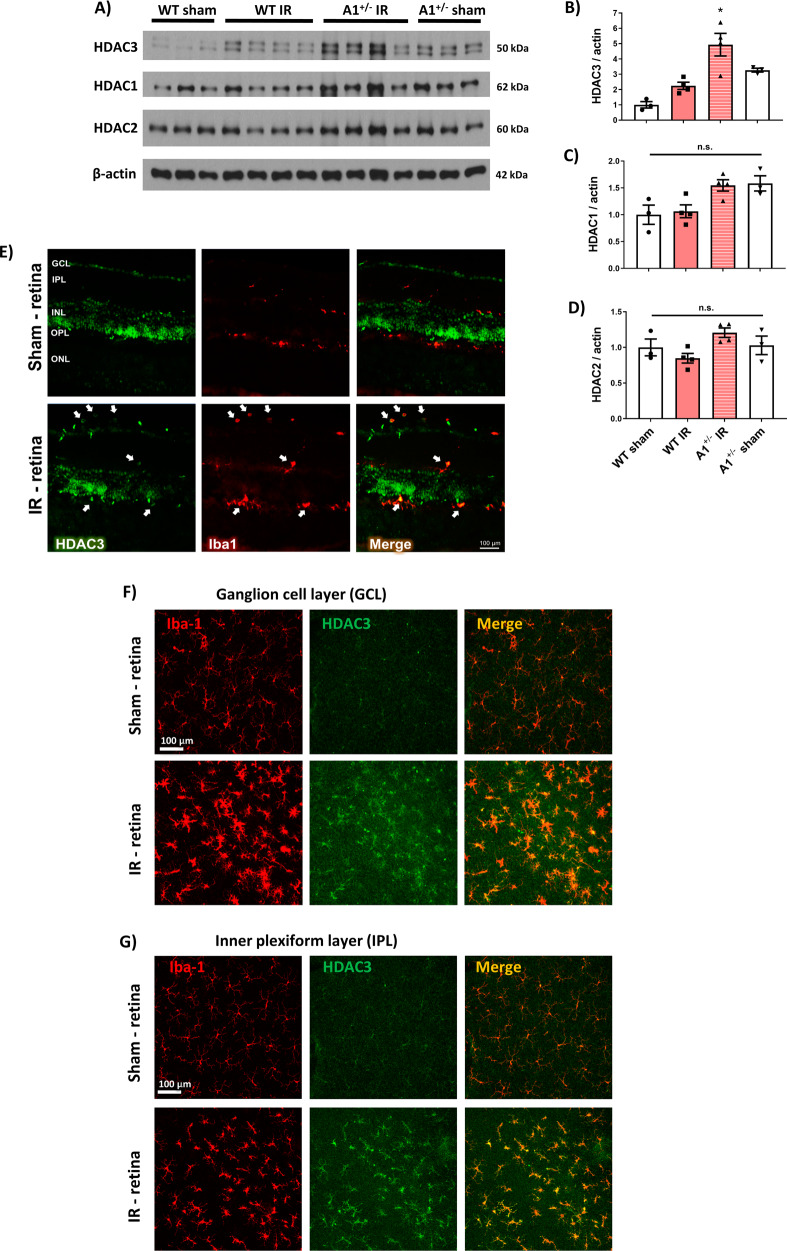
The enzyme arginase 1 (A1) hydrolyzes the amino acid arginine to form L-ornithine and urea. Ornithine is further converted to polyamines by the ornithine decarboxylase (ODC) enzyme. We previously reported that deletion of myeloid A1 in mice exacerbates retinal damage after ischemia/reperfusion (IR) injury. Furthermore, treatment with A1 protects against retinal IR injury in wild-type mice. PEG-A1 also mitigates the exaggerated inflammatory response of A1 knockout (KO) macrophages in vitro. Here, we sought to identify the anti-inflammatory pathway that confers macrophage A1-mediated protection against retinal IR injury. Acute elevation of intraocular pressure was used to induce retinal IR injury in mice. A multiplex cytokine assay revealed a marked increase in the inflammatory cytokines interleukin 1β (IL-1β) and tumor necrosis factor α (TNF-α) in the retina at day 5 after IR injury. In vitro, blocking the A1/ODC pathway augmented IL-1β and TNF-α production in stimulated macrophages. Furthermore, A1 treatment attenuated the stimulated macrophage metabolic switch to a pro-inflammatory glycolytic phenotype, whereas A1 deletion had the opposite effect. Screening for histone deacetylases (HDACs) which play a role in macrophage inflammatory response showed that A1 deletion or ODC inhibition increased the expression of HDAC3. We further showed the involvement of HDAC3 in the upregulation of TNF-α but not IL-1β in stimulated macrophages deficient in the A1/ODC pathway. Investigating HDAC3 KO macrophages showed a reduced inflammatory response and a less glycolytic phenotype upon stimulation. In vivo, HDAC3 co-localized with microglia/macrophages at day 2 after IR in WT retinas and was further increased in A1-deficient retinas. Collectively, our data provide initial evidence that A1 exerts its anti-inflammatory effect in macrophages via ODC-mediated suppression of HDAC3 and IL-1β. Collectively we propose that interventions that augment the A1/ODC pathway and inhibit HDAC3 may confer therapeutic benefits for the treatment of retinal ischemic diseases.


Conflict of interest statement

AYF and RBC have a pending patent on the use of arginase 1 as a treatment for ischemic retinopathies. The other authors declare no conflict of interest.

Figures

Fig. 1
Fig. 1. Induction of cytokines including TNF-α and IL-1β after retinal IR injury and localization of IL-1β in macrophage/microglia cells.
A Multiplex array shows strong upregulation of IL-1β, TNF-α, and G-CSF in retinal lysates at day 5 after IR injury. N = 3–4 per group. *p < 0.05 vs. sham. BF Western blotting on retina lysates at days 2 and 5 after IR injury and quantification show significant upregulation of pro- and mature forms of IL-1β with a higher increase at day 5. The macrophage/microglia cell marker Iba-1 showed a strong upregulation at day 5 but not day 2 after IR injury. Tubulin was used as a loading control. N = 3–4 per group. *p < 0.05 vs. respective sham. G Immunolabeling on retina cross-sections shows co-localization (indicated by white arrows and magnified insets of the yellow boxes) of IL-1β with Iba-1 positive microglia/macrophages at days 2 and 5 after IR injury. N = 3 per group. *p < 0.05 vs. respective sham. H, I Expression level of mature IL-1β is significantly higher in retinas from hemizygous A1 KO mice (A1+/-) at day 5 after IR injury compared to WT mice as measured by western blotting. Actin was used as a loading control. N = 4 per group. *p < 0.05 vs. WT IR.
Fig. 2
Fig. 2. Arginase 1 but not Arginase 2 signals through ornithine to suppress IL-1β and TNF-α expression in LPS-stimulated macrophages.
AC Deletion of arginase 2 in macrophages from A2-/- mice did not alter LPS-induced elevations of pro-IL-1β and TNF-α; macrophages from A2f/f mice served as control. In contrast, treatment of A2-/- or A2f/f macrophages with PEG-A1 (1 µg/ml) reduced expression of both cytokines. N = 4 per group. *p < 0.05 vs. respective vehicle group, #p < 0.05 vs. respective LPS group. D, F Western blotting and quantification showed increased IL-1β expression after ODC inhibition with DFMO (5 mM) in LPS-stimulated macrophages. N = 4 per group. *p < 0.05 vs. LPS groups, #p < 0.05 vs. control and LPS groups. E, H Supplementation with ornithine (5 mM) reduced LPS-induced IL-1β expression in A1-/- macrophages. N = 4 per group. *p < 0.05 vs. LPS. G, I NF-κB phosphorylation was unchanged after exposure of A1f/f and of A1-/- macrophages to either DFMO or ornithine (5 mM). N = 3–4 per group. n.s. = not statistically significant. J, K Inhibition of ODC activity by DFMO (5 mM) increased TNF-α expression in LPS-stimulated macrophages from WT mice. N = 3–5 per group. *p < 0.05 vs. control and LPS groups. L Schematic of Fig. 2 experiments showing A1/ODC pathway suppresses IL-1β and TNF-α expression in stimulated macrophages.
Fig. 3
Fig. 3. The A1/ODC pathway inhibits HDAC3 expression in macrophages.
AD RT-PCR reveals significant upregulation of HDAC1, 2, and 3 but not HDAC8 in A1-/- macrophages after LPS treatment. N = 3–6 per group, *p < 0.05 vs. A1f/f LPS group, #p < 0.05 vs. A1f/f ctrl group, $p < 0.05 vs. respective A1f/f groups. EH Western blotting showed significant upregulation of HDAC3 but not HDAC2 or HDAC1 in LPS-activated macrophages exposed to DFMO (5 mM) to inhibit the ODC enzyme. N = 4–5 per group. *p < 0.05 vs. LPS group, n.s. = not statistically significant. IK A1-/- macrophages showed enhanced upregulation of HDAC3 and IL-1β in response to LPS activation compared to A1f/f macrophages. N = 4 per group, *p < 0.05 vs. A1f/f LPS group. L, M A2 KO macrophages showed no change in HDAC3 expression as compared to floxed control while PEG-A1 treatment reduced it. N = 4, #p < 0.05 vs. A2f/f LPS group. N Schematic of Fig. 3 experiments showing A1/ODC pathway inhibits HDAC3 expression in stimulated macrophages.
Fig. 4
Fig. 4. HDAC3 inhibition ameliorates expression of TNF-α but not IL-1β in macrophages deficient in the A1/ODC pathway.
A, B Western blotting and quantification show significant upregulation of LPS-induced increases in pro-IL-1β with DFMO (5 mM) co-treatment while co-treatment with the HDAC3 inhibitor, RGFP966 (2 µM), had no effect. N = 6–10, *p < 0.05 vs. other groups. CF HDAC3 inhibition with RGFP966 (2 or 10 µM) did not affect pro-IL-1β expression upon LPS stimulation in A1 KO macrophages. N = 3–4, n.s. = not statistically significant. G, H HDAC3 inhibition with RGFP966 (2 µM) dampened the LPS-induced increase in TNF-α expression in A1 KO macrophages. N = 4 #p < 0.05 vs. all other groups. I, J HDAC3 inhibition with RGFP966 (2 µM) dampened TNF-α expression in WT macrophages treated with TNF and the ODC inhibitor, DFMO (5 mM). N = 6, *p < 0.05 vs. LPS + DFMO. KM HDAC3 KO macrophages showed decreased expression of TNF-α but not pro-IL-1β upon LPS stimulation. N = 5, *p < 0.01 vs. HDAC3f/f LPS. N Schematic of Fig. 4 experiments showing A1/ODC pathway suppresses TNF-α through inhibiting HDAC3 expression in stimulated macrophages.
Fig. 5
Fig. 5. LPS-induced glycolysis in macrophages is dampened by PEG-A1 treatment and enhanced by A1 deletion.
AD Seahorse glycolysis stress test on BMDMs showed enhanced glycolytic response upon LPS stimulation while PEG-A1 treatment significantly reduced it as evidenced by decreased glycolysis, glycolytic capacity, and % glycolytic reserve. N = 11–12 *p < 0.05 vs. ctrl, #p < 0.05 vs. LPS. EH A1 KO macrophages showed an increased glycolytic response upon LPS stimulation as evident by increased glycolysis, glycolytic capacity, and % glycolytic reserve. N = 9–10, *p < 0.05 vs. A1f/f LPS. I Basal ECAR in unstimulated macrophages was similar to floxed controls. N = 7–11. JM Seahorse glycolysis stress test showed decreased glycolytic response in A2 KO macrophages stimulated with LPS while PEG-A1 co-treatment further decreased it which was evident in glycolysis, glycolytic capacity, and % glycolytic reserve. N = 11–12 *p < 0.05 vs. A2f/f Ctrl, #p < 0.05 vs. A2f/f LPS, $p < 0.05 vs. A2-/- LPS. N Schematic of Fig. 5 experiments showing A1/ODC pathway inhibiting the glycolytic pro-inflammatory phenotype in stimulated macrophages.
Fig. 6
Fig. 6. Involvement of HDAC3 in the augmented glycolytic response of stimulated A1 KO macrophages.
AC HDAC3 KO BMDMs showed decreased glycolytic response upon LPS stimulation as compared to floxed control which is evident by decreased glycolysis and glycolytic capacity. N = 7–8, *p < 0.05 vs. HDAC3f/f, #p < 0.05 vs. HDAC3f/f LPS. D Seahorse analysis on unstimulated macrophages shows no change in basal ECAR with A1 deletion or RGFP966 treatment. N = 10–12. EH Seahorse glycolysis stress test showed decreased glycolytic capacity and % glycolytic reserve but not glycolysis in LPS-stimulated A1 KO macrophages co-treated with the HDAC3 inhibitor, RGFP966 (2 µM). N = 10–12 *p < 0.05 vs. respective A1f/f LPS groups, #p < 0.05 vs. DMSO A1-/- LPS. I Seahorse ATP rate assay showed decreased glycolytic ATP production in LPS-stimulated A1 KO macrophages co-treated with the HDAC3 inhibitor, RGFP966 (2 µM). N = 11–12, *p < 0.05 vs. A1f/f, #p < 0.05 vs. A1f/f LPS, $p < 0.05 vs. A1-/- LPS. J, K Plotting mitochondrial ATP production against glycolytic ATP production and calculating mitochondrial ATP to glycolytic ATP ratio showed an enhanced glycolytic phenotype in LPS-stimulated A1 KO macrophages which was ameliorated with the HDAC3 inhibitor, RGFP966 (2 µM). N = 11–12, *p < 0.05 vs. A1f/f, #p < 0.05 vs. A1f/f LPS. L Overall schematic of the study results and mechanism by which A1 dampens the myeloid cell inflammatory response. A1 pathway acts through the downstream enzyme ODC to suppress HDAC3 and IL-1β production. In turn, HDAC3 is involved in TNF-α production and the macrophage pro-inflammatory glycolytic phenotype. HDAC3 suppression by A1/ODC pathway reduces TNF-α and macrophage glycolysis in response to stimulation. The schematic figures were partly generated using Servier Medical Art, provided by Servier, licensed under a Creative Commons Attribution 3.0 unported license”.
Fig. 7
Fig. 7. HDAC3 is upregulated in activated myeloid cells in vivo after retinal injury and further increased in A1 KO retinas.
AD Western blotting and analyses showed upregulation of HDAC3 but not HDAC1 and HDAC2 in the A1+/- retinas at day 2 after IR-injury. N = 3–4. *p < 0.05 vs. WT sham and WT IR, n.s. = not statistically significant, two-way ANOVA. E HDAC3 immunolabeling studies on retina sections showed baseline expression in the ganglion cell and inner nuclear layers (GCL & INL) while there was a strong co-localization with Iba-1 positive cells after retinal IR-injury. N = 3. F, G HDAC3 immunolabeling on retina flat mounts showed strong expression in Iba-1 positive cells in the ganglion cell and inner plexiform layers (GCL & IPL) after retinal IR-injury. N = 3.

Similar articles

Cited by

References

    1. Rivera JC, Dabouz R, Noueihed B, Omri S, Tahiri H, Chemtob S. Ischemic retinopathies: oxidative stress and inflammation. Oxid Med Cell Longev. 2017;2017:3940241. doi: 10.1155/2017/3940241. - DOI - PMC - PubMed
    1. Fouda AY, Xu Z, Shosha E, Lemtalsi T, Chen J, Toque HA, et al. Arginase 1 promotes retinal neurovascular protection from ischemia through suppression of macrophage inflammatory responses. Cell Death Dis. 2018;9:1001. doi: 10.1038/s41419-018-1051-6. - DOI - PMC - PubMed
    1. Fouda AY, Eldahshan W, Narayanan SP, Caldwell RW, Caldwell RB. Arginase pathway in acute retina and brain injury: therapeutic opportunities and unexplored avenues. Front Pharmacol. 2020;11:277. doi: 10.3389/fphar.2020.00277. - DOI - PMC - PubMed
    1. Fouda AY, Eldahshan W, Xu Z, Lemtalsi T, Shosha E, Zaidi SA, et al. Preclinical investigation of pegylated arginase 1 as a treatment for retina and brain injury. Exp Neurol. 2022;348:113923. doi: 10.1016/j.expneurol.2021.113923. - DOI - PMC - PubMed
    1. Shosha E, Xu Z, Yokota H, Saul A, Rojas M, Caldwell RW, et al. Arginase 2 promotes neurovascular degeneration during ischemia/reperfusion injury. Cell Death Dis. 2016;7:e2483. doi: 10.1038/cddis.2016.295. - DOI - PMC - PubMed

Publication types