. 2023 Sep 21;13(1):15728.
doi: 10.1038/s41598-023-41412-x.

Phases in fine volcanic ash

Affiliations

Phases in fine volcanic ash

Adrian Hornby et al. Sci Rep. .

Abstract

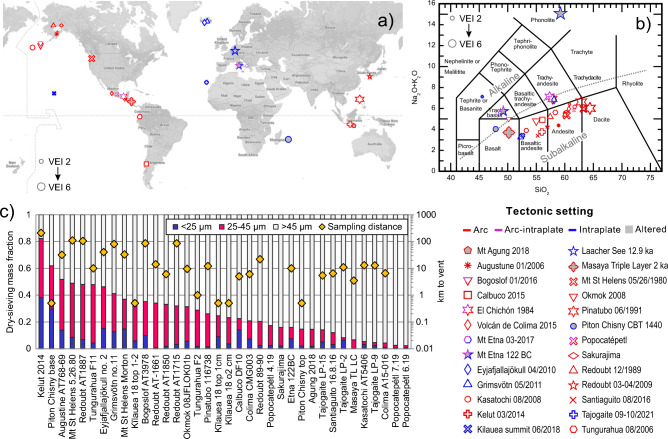
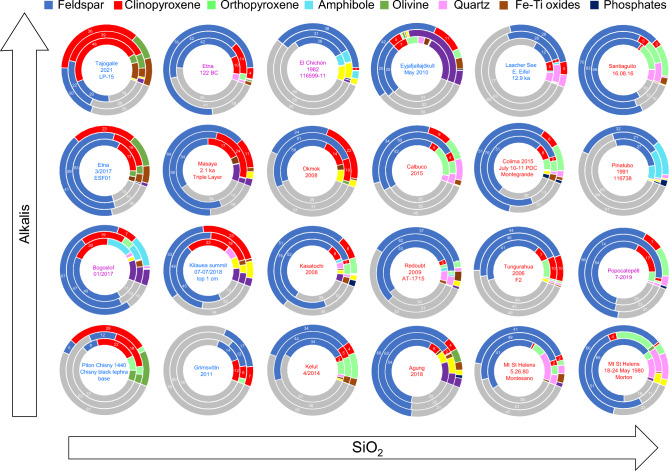
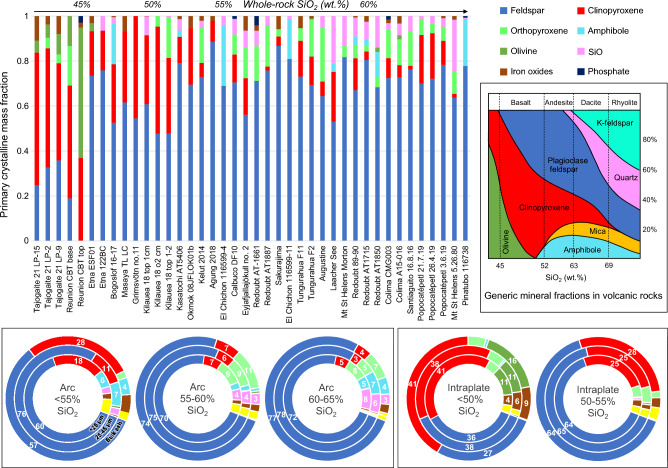
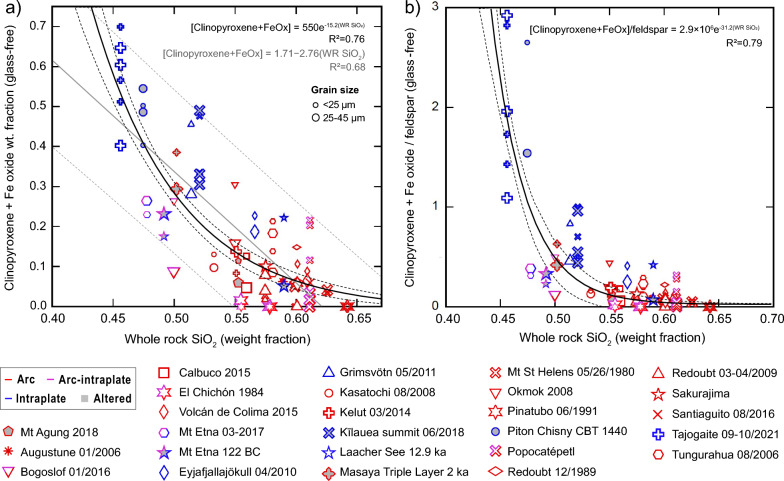
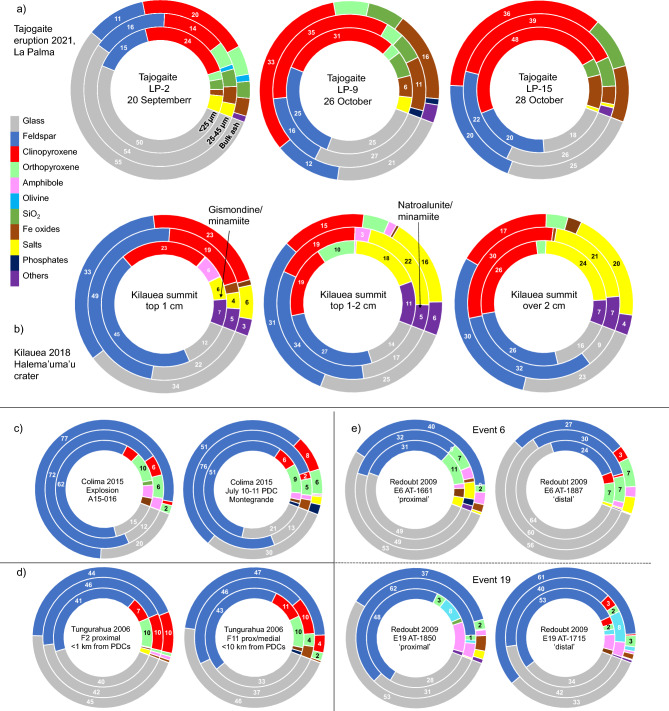
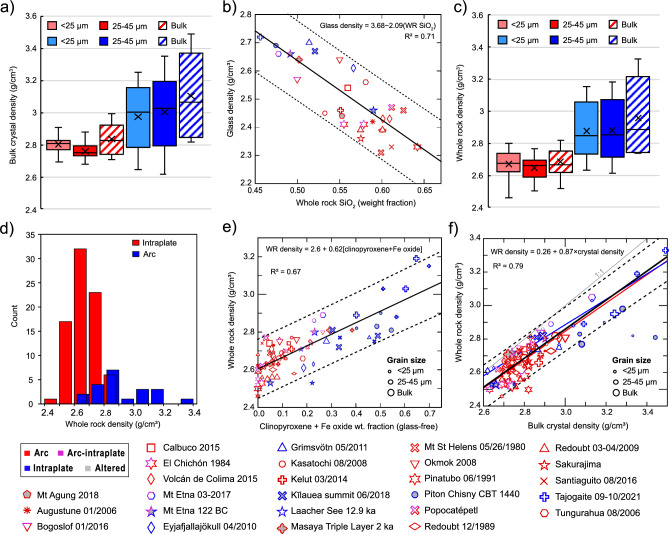
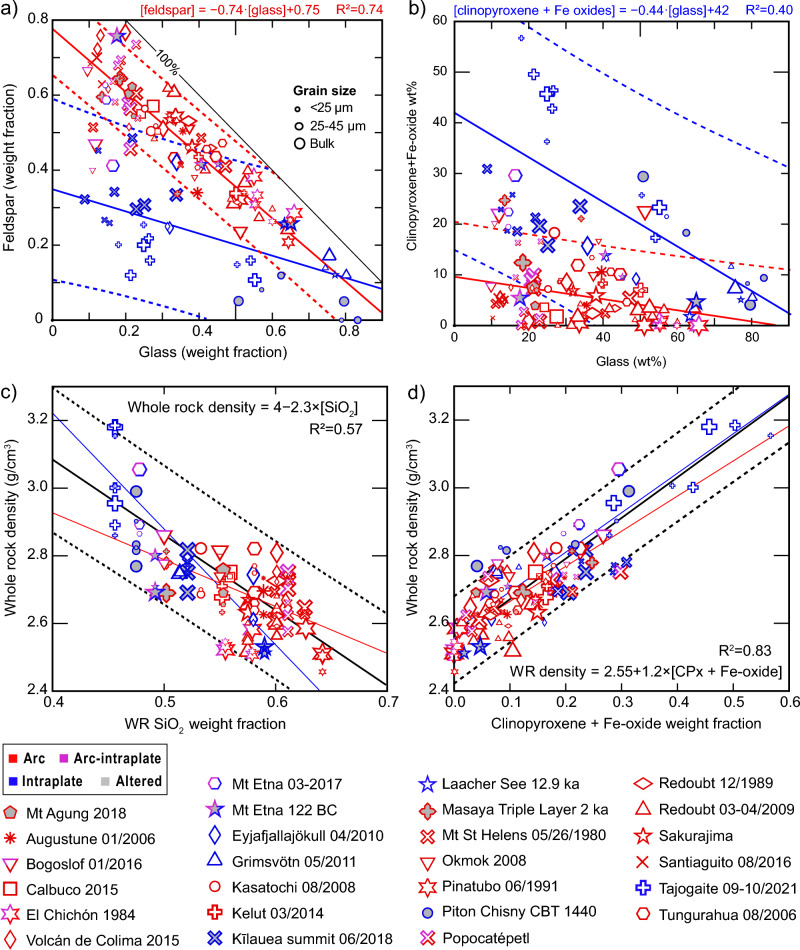
Volcanic ash emissions impact atmospheric processes, depositional ecosystems, human health, and global climate. These effects are sensitive to the size and composition of the ash; however, datasets describing the constituent phases over size ranges relevant for atmospheric transport and widely distributed impacts are practically nonexistent. Here, we present results of X-ray diffraction measurements on size-separated fractions of 40 ash samples from VEI 2-6 eruptions. We characterize changes in phase fractions with grainsize, tectonic setting, and whole-rock SiO2. For grainsizes < 45 μm, average fractions of crystalline silica and surface salts increased while glass and iron oxides decreased with respect to the bulk sample. Samples from arc and intraplate settings are distinguished by feldspar and clinopyroxene fractions (determined by different crystallization sequences) which, together with glass, comprise 80-100% of most samples. We provide a dataset to approximate glass-free proportions of major crystalline phases; however, glass fractions are highly variable. To tackle this, we describe regressions between glass and major crystal phase fractions that help constrain the major phase proportions in volcanic ash with limited a priori information. Using our dataset, we find that pore-free ash density is well-estimated as a function of the clinopyroxene + Fe-oxide fraction, with median values of 2.67 ± 0.01 and 2.85 ± 0.03 g/cm3 for intraplate and arc samples, respectively. Finally, we discuss effects including atmospheric transport and alteration on modal composition and contextualize our proximal airfall ash samples with volcanic ash cloud properties. Our study helps constrain the atmospheric and environmental budget of the phases in fine volcanic ash and their effect on ash density, integral to refine our understanding of the impact of explosive volcanism on the Earth system from single eruptions to global modeling.


Conflict of interest statement

The authors declare no competing interests.

Figures

Figure 1
Figure 1
Global eruption locations and bulk chemistry. (a) Location of the volcanoes that produced volcanic ash used in this study (further details in Supplementary Table 1) The symbol size is scaled to the eruption volcanic explosivity index (VEI). (b) Total alkalis to silica (TAS) diagram showing bulk chemistry in wt% oxides retrieved from the literature for the studied samples. Compiled data and references are provided in Supplementary Tables 2 and 7. Multiple data points bracket the range of chemistry for an eruption where the erupted materials were heterogenous. All symbols and colors in panels a-b follow the legend. Bicolored symbols indicate more complex arc-intraplate tectonic settings, with the bottom-right color indicating the dominant tectonic setting to which they were assigned for calculations and linear regressions. (c) Dry-sieving fractions for the grain size ranges used in the study are shown as stacked bars in order of total < 45 µm fraction. Gold diamonds show sampling distance from the eruptive vent. Map data © 2023 Google.
Figure 2
Figure 2
Typical morphology and phases of volcanic ash. (ab) SEM secondary electron (SE) images showing typical forms of glassy volcanic ash with pore indentations from the Tajogaite 2021 eruption. (c) Microphotograph under plane-polarized light showing volcanic glass shard. (d) Backscattered electron (BSE) image showing intermediate arc sample from Tungurahua, with phenocrysts of plagioclase feldspar (dark) microlites of clinopyroxene (intermediate) and nanolites (specks) of Fe–Ti oxides. Glass is indistinguishable in greyscale from plagioclase, a common property of intermediate arc magmas. (e) BSE image showing Fe–Ti oxide phenocryst (bright), clinopyroxene (intermediate) and plagioclase (dark) microlites in a nanolite-rich glass (grey shade between plagioclase and pyroxene). (f) Crystal clusters are common, such as this set of clinopyroxene microlites and microphenocrysts associated with Fe–Ti oxides microlites in a BSE image from Tajogaite (2021). (g) BSE image of highly crystalline groundmass of Mt Etna 2017 sample, showing plagioclase, pyroxene and Fe-oxide microlites. Nanolite-rich glass can be seen as diffuse intermediate grey zones. (h) Ash grain from Okmok 2008 eruption, showing plagioclase phenocrysts and elongate microlites within an Fe-rich glass. (i) Sample from the Pinatubo 1991 eruption, showing plagioclase microlites in a Fe-poor felsic glass. (j) SE image from the Tajogaite 2021 eruption, showing salt crystals grown on an ash grain. (k) The identity of the salt crystals is seen by energy-dispersive spectroscopy (EDS), with a Ca-sulfate crystal in yellow and green, and halite in blues. All images produced by the authors using TESCAN Mira3, Bruker Esprit and Leica LAS-X software.
Figure 3
Figure 3
Phase fractions are represented as donuts, where the outer rings show bulk modal compositions, the central rings show the 25-45 μm fraction and the inner rings the < 25 μm fraction. Donuts are arranged so SiO2 increases to the right and alkalis increase upwards. A single sample was chosen where multiple eruptions from the same volcano were sampled, except for Mount St. Helens, where a sample from the initial blast deposit is compared to later magmatic eruption deposits. Major phases are labelled with the weight fraction of the phase to the nearest integer.
Figure 4
Figure 4
Primary mineral phases in fresh volcanic ash samples arranged by SiO2 content from left-to-right. Salts, ‘Other’ phases and glass have been removed from the plot and the remaining phases normalized to 100%. The plots here may be compared to the generic mineral abundance plots based on crystallization series that are commonly used in teaching and literature (an example is shown as an inset on the right of the figure, modified from images in the public domain, e.g., https://commons.wikimedia.org/wiki/File%3AMineralogy_igneous_rocks_EN.svg). Donut plots show average glass-free phase fractions in binned whole rock SiO2 fractions for arc samples (left) and intraplate samples (right). Different size fractions are represented by nested rings, as labeled in the left-hand donut. Numbers indicate the primary mineral fraction normalized on glass- and secondary-mineral-free basis. Note: different whole-rock SiO2 bins were used for arc and intraplate samples due to data distribution.
Figure 5
Figure 5
Scatter plots showing relationships between whole-rock SiO2 and primary mineral phase fractions (labeled ‘glass-free’). (a) Clinopyroxene + Fe oxides, normalized on a glass-free basis for < 25 and 25–45 µm fractions are fitted with an exponential regression (black line) and linear regression (grey line) to bulk silica with altered samples (symbols with grey fill) excluded. The grey dashed lines show the 95% confidence curves for individual data points; black dashed lines show 95% confidence for the exponential regression. (b) Identical to panel (a), but with the y-axis divided by feldspar fraction and no linear regression shown. Dashed lines shoe 95% confidence limits for individual data points. Symbol size indicates sieve fraction (smallest =  < 25 µm, largest = bulk (unsieved). Equations for regressions with the coefficient of determination (R2) are shown.
Figure 6
Figure 6
Average phase composition and sample standard error of the mean for arc and intraplate volcanic ash samples in the study. (a) Glass fraction is plotted against whole-rock SiO2 for all samples, showing poor correlation and wide range. (b) Box plots showing glass content binned by whole-rock SiO2 content and grain size. Arc samples are shown in yellow bars, intraplate samples in orange. (c) Sample standard deviation is shown as a bar for each phase for arc and intraplate ash samples. The y-axis scale is magnified for phases shown to the right of clinopyroxene to improve clarity of the minor phases. (d) Variations in phase abundance from the bulk for fine-sieved particles. Absolute variations (left) and relative variations (right) in weight fraction are plotted as stacked bars for each phase. Lighter colors represent the finest size range (< 25 μm) and darker colors the 25-45 μm range.
Figure 7
Figure 7
Variations in composition with distance and time. (a) Phase fractions for three airfall ash samples from the 2021 Tajogaite eruption on La Palma, Canary Islands, with size fractions nested in the donuts as labeled. Sample LP-2 was collected at the beginning of the eruption, while samples LP-9 and LP-15 were collected approximately one month later. (b) Kīlauea ash sampled at varying depth from the summit caldera rim following the 2018 eruption. The identity of the most common phases grouped under ‘Other’ shown. (c) Volcán de Colima ash from an explosive event (left) and overbank PDC deposits (right), separated by approximately three months in 2015. (d) Two samples from the 2006 eruption of Tungurahua. Although the samples were collected at varying distances from the vent, the proximity to major PDCs appears to dominate the measured modal componentry and distance from PDC runout is given. (e) Two pairs of samples from the Redoubt 2009 eruption collected at relatively proximal and distal locations for two eruption episodes (Event 6 (E6) and Event 19 (E19)). An increase in glass fraction for the distal samples is clearly seen for Event 6 and for the sieved particles in Event 19.
Figure 8
Figure 8
Density, chemistry, and size sensitivity. (a) Boxplots show bulk crystal density by size fraction for arc and intraplate samples. (b) The calculated glass density is sensitive to WR SiO2, as shown with a linear regression (solid black) and 95% confidence intervals for individual points (dashed lines). The regression has a poor fit for arc data alone. (c) Boxplots showing whole rock density with grain size; distributions for each tectonic setting are highlighted in (d). (e) Whole rock density is plotted against primary mineral fractions (e.g., glass- and secondary mineral-free) of clinopyroxene + Fe oxides. Bulk crystal and whole rock density if shown for all samples in (f). For panels (e) and (f), regressions are plotted for all non-altered samples (black, with 95% confidence limits for individual data points in dashed lines and equation given at top of plot). The 1:1 line and regression equation are shown. For panel (f) arc (red) and intraplate (blue) linear regressions are also shown.
Figure 9
Figure 9
Relation between glass and mineral phases and correlations with whole-rock density. Different trends are seen between intraplate and arc samples for feldspar vs glass fraction (a) and clinopyroxene + Fe oxide fractions (b). Whole rock density is shown against SiO2 fraction (c) and against clinopyroxene + Fe-oxide fraction (d). In most cases the fraction of dense mineral phases is the dominant control on the bulk density; poorer fits are found with bulk chemistry, with SiO2, shown in (c), and TiO2 showing the best correlations. Symbols match the legend, symbol size indicates particle size fraction as shown in (a). Solid lines show linear regressions and dashed lines show 95% confidence intervals for individual data points, colored to match the tectonic setting. Regressions for all data points are shown as black lines, with the equation and coefficient of determination (R2) given in each panel. Clinopyroxene is abbreviated to CPx in the regression equation in (d). Lines showing 100% fractions for the plotted phases are drawn on panels (a) and (b). Altered samples (shaded grey) are shown but not included in regressions for all panels.

References

    1. Dingwell DB, Lavallée Y, Kueppers U. Volcanic ash: A primary agent in the Earth system. Phys. Chem. Earth. 2012;45–46:2–4.
    1. Ayris PM, Delmelle P. The immediate environmental effects of tephra emission. Bull. Volcanol. 2012;74:1905–1936.
    1. Mather TA. Volcanoes and the environment: Lessons for understanding Earth’s past and future from studies of present-day volcanic emissions. J. Volcanol. Geoth. Res. 2015;304:160–179.
    1. IAEA. Volcanic hazard assessments for nuclear installations: Methods and examples in site evaluation. IAEA Tecdoc Ser.1795, 283 (2016).
    1. Brown SK, et al. Global Volcanic Hazards and Risk. Cambridge University Press; 2015. Global volcanic hazard and risk; pp. 81–172.