. 2023 Oct;55(10):1735-1744.
doi: 10.1038/s41588-023-01506-8. Epub 2023 Sep 21.

Functional characterization of Alzheimer's disease genetic variants in microglia

Affiliations

Functional characterization of Alzheimer's disease genetic variants in microglia

Xiaoyu Yang et al. Nat Genet. 2023 Oct.

Abstract

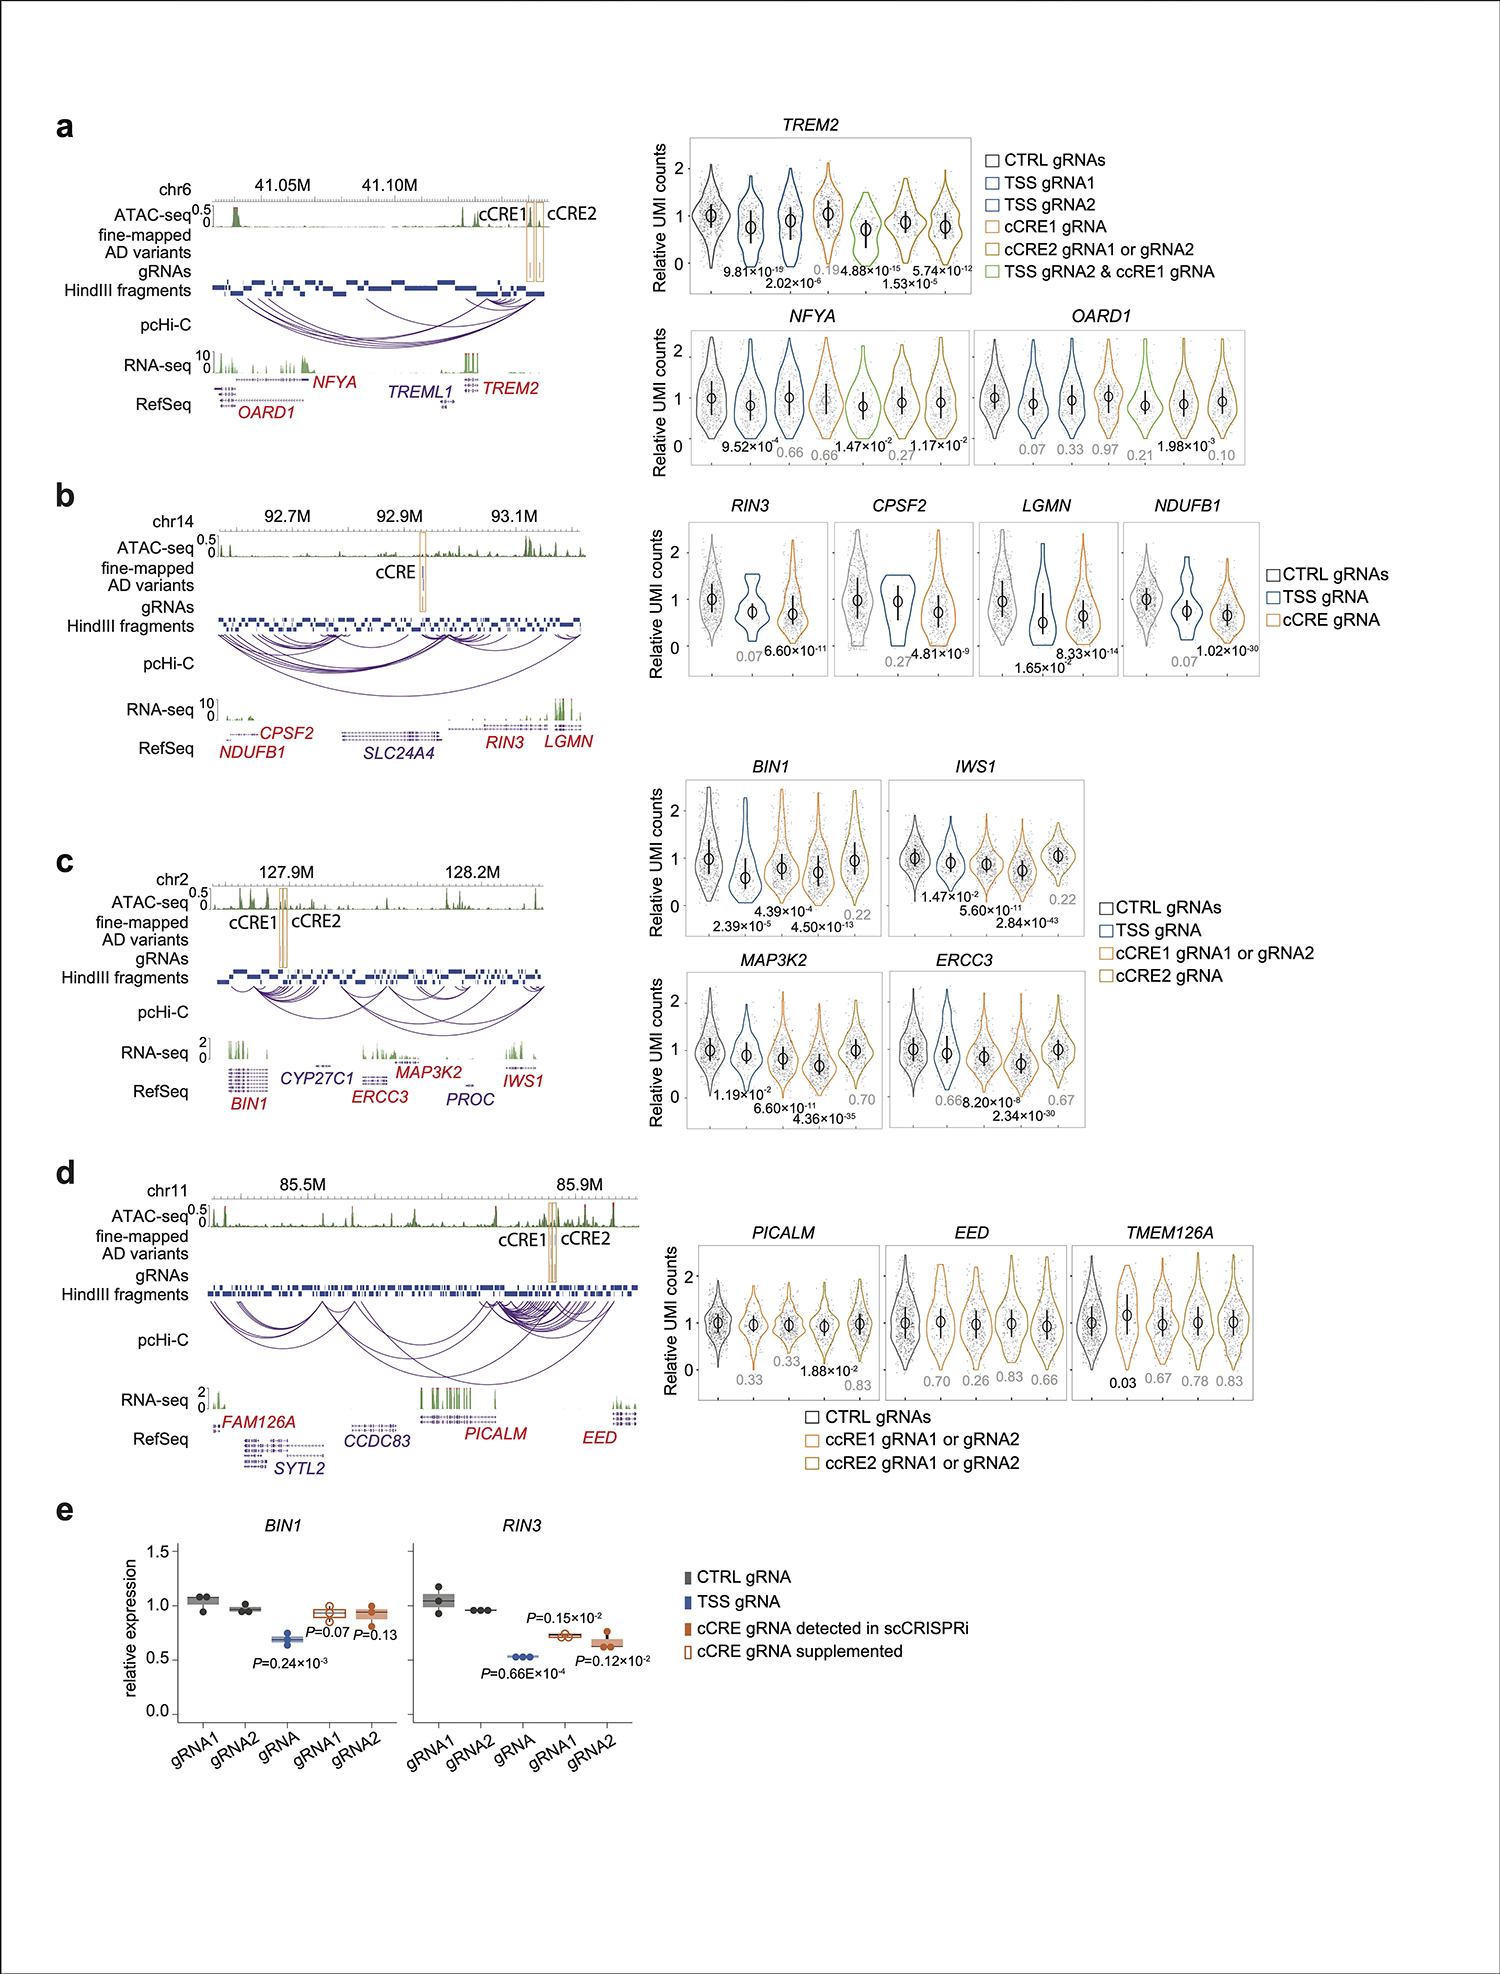
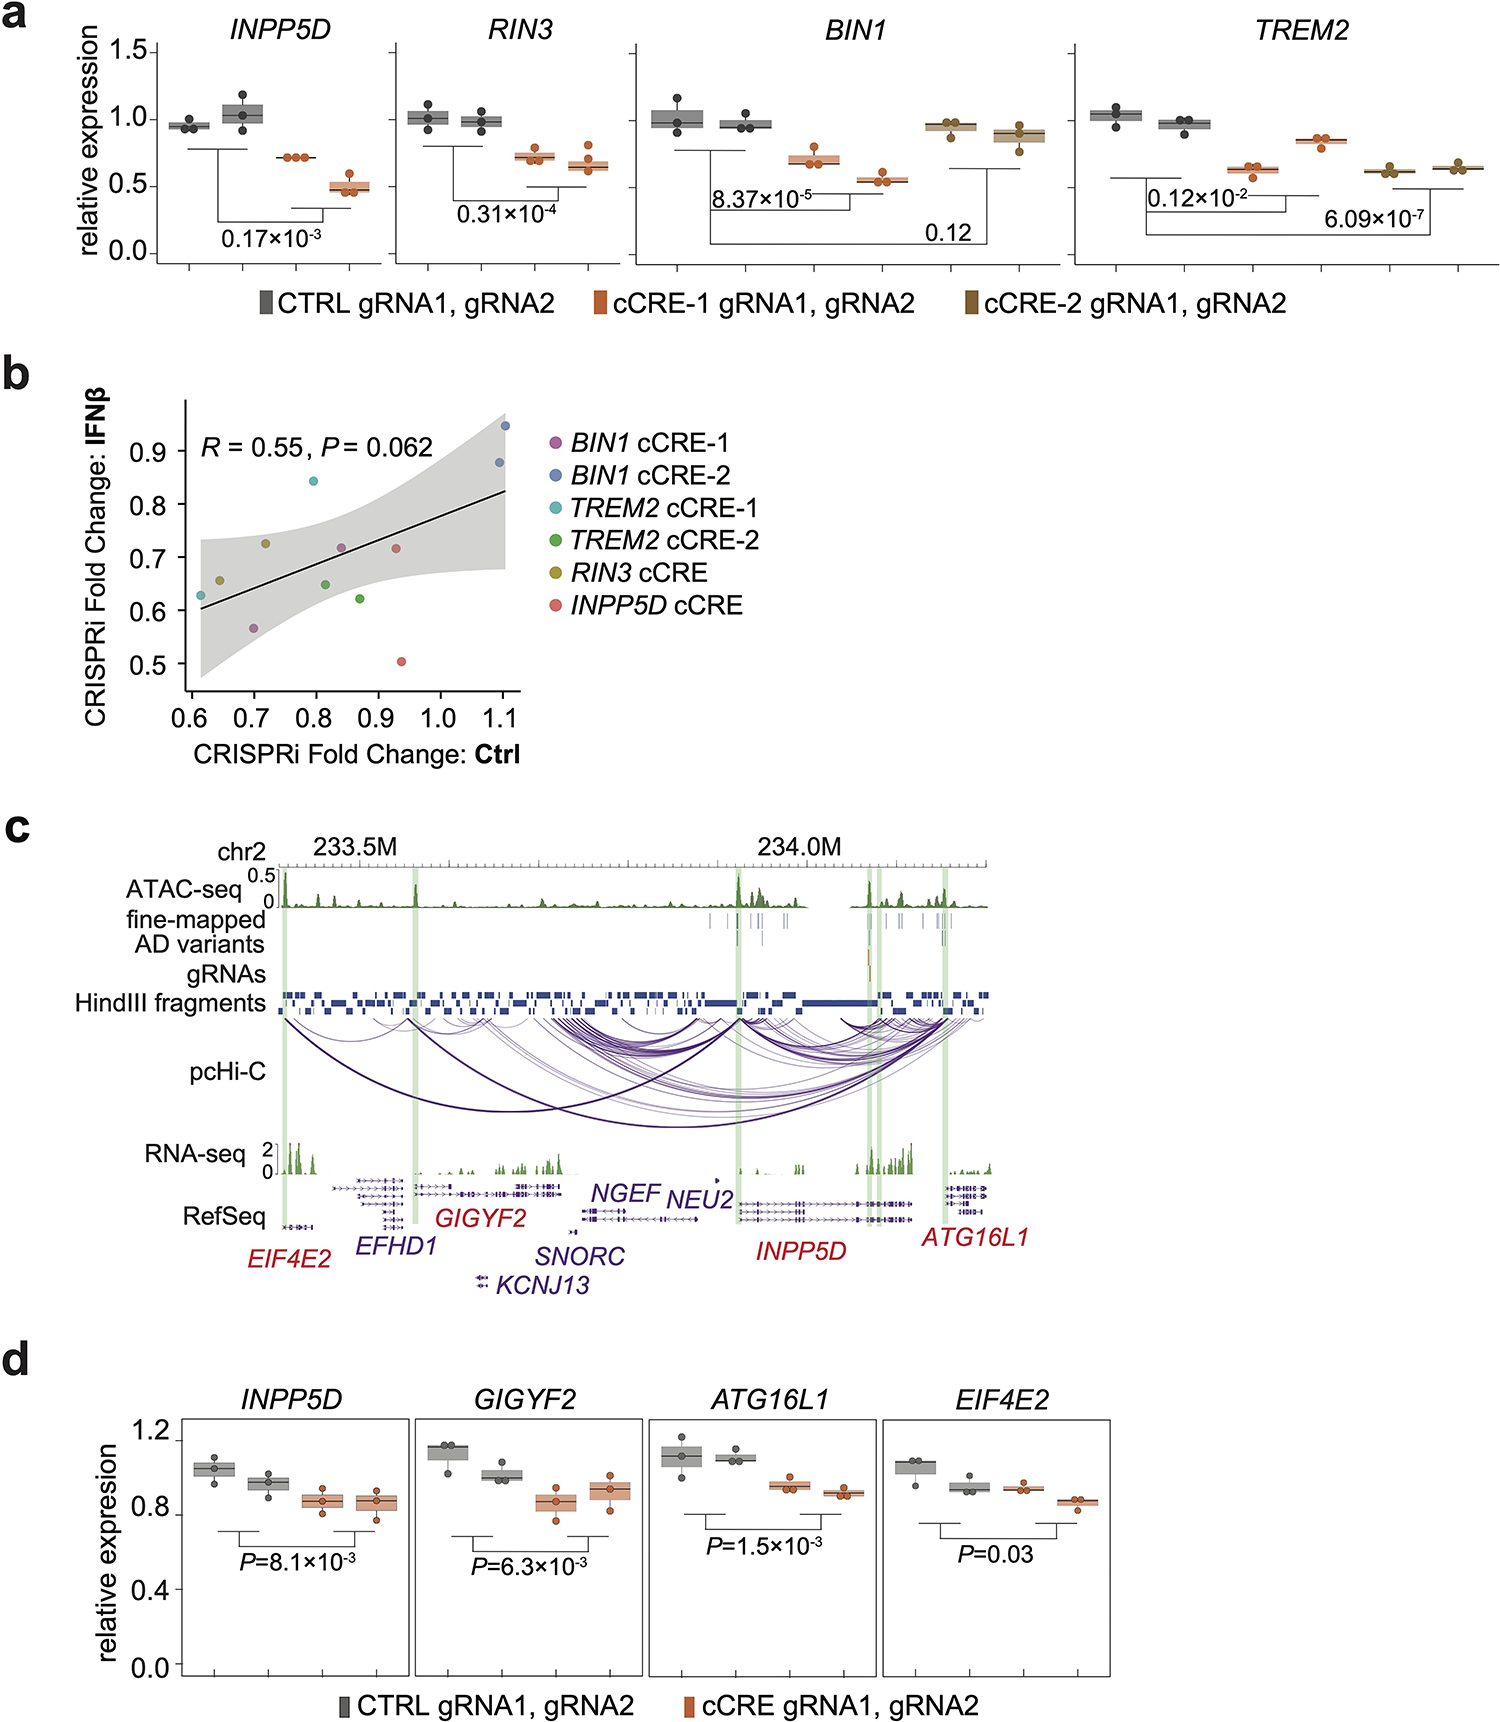
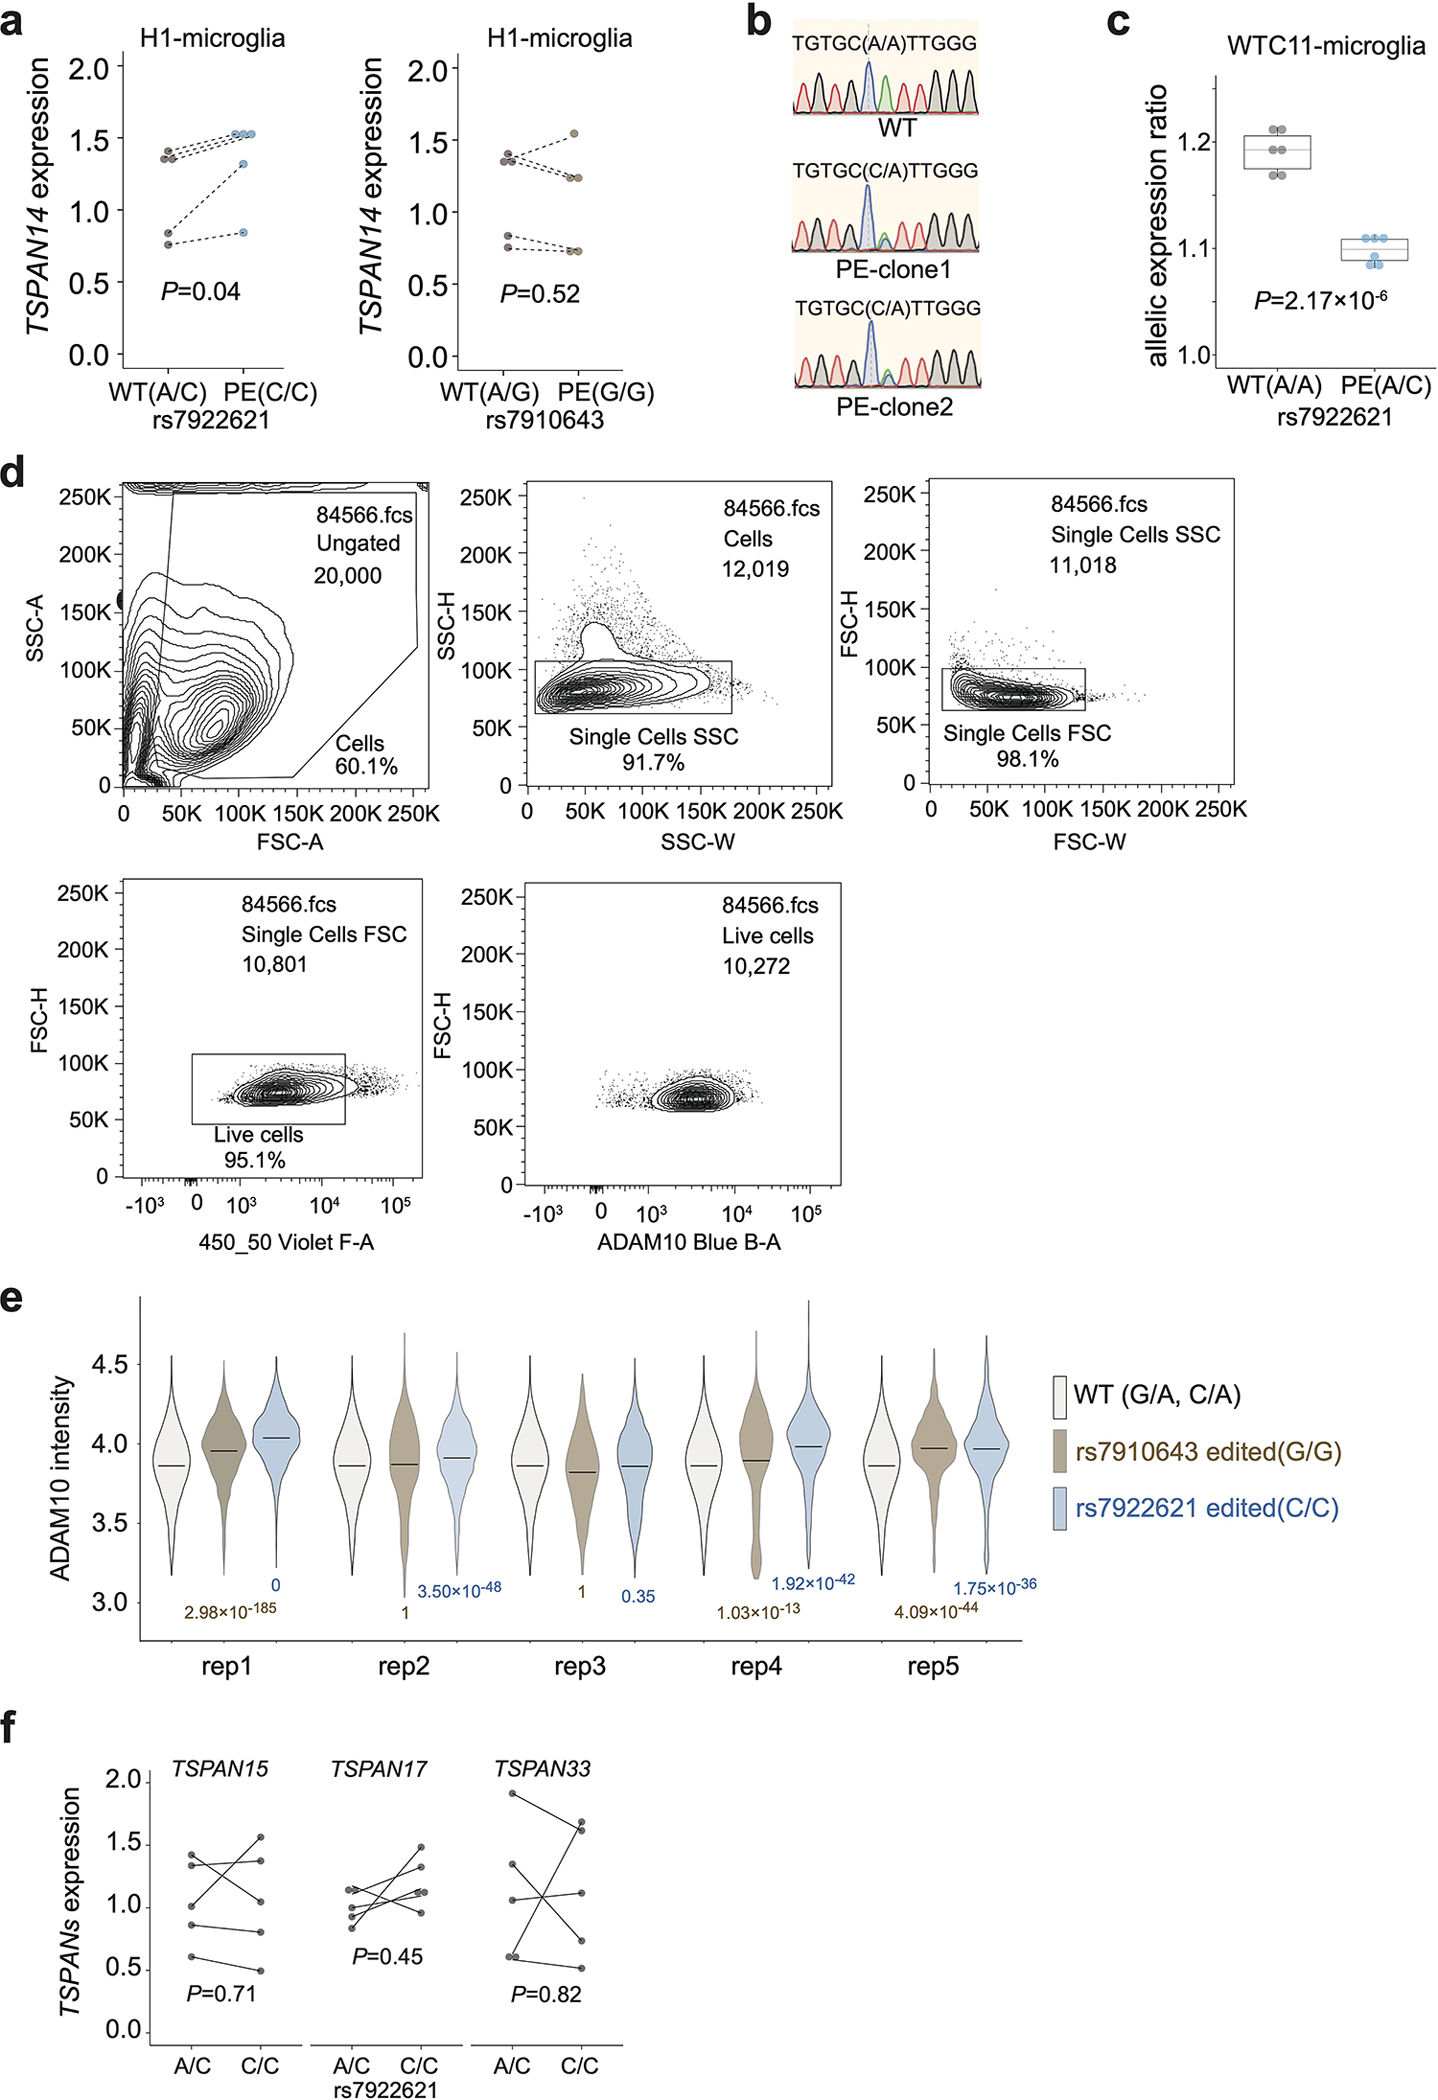
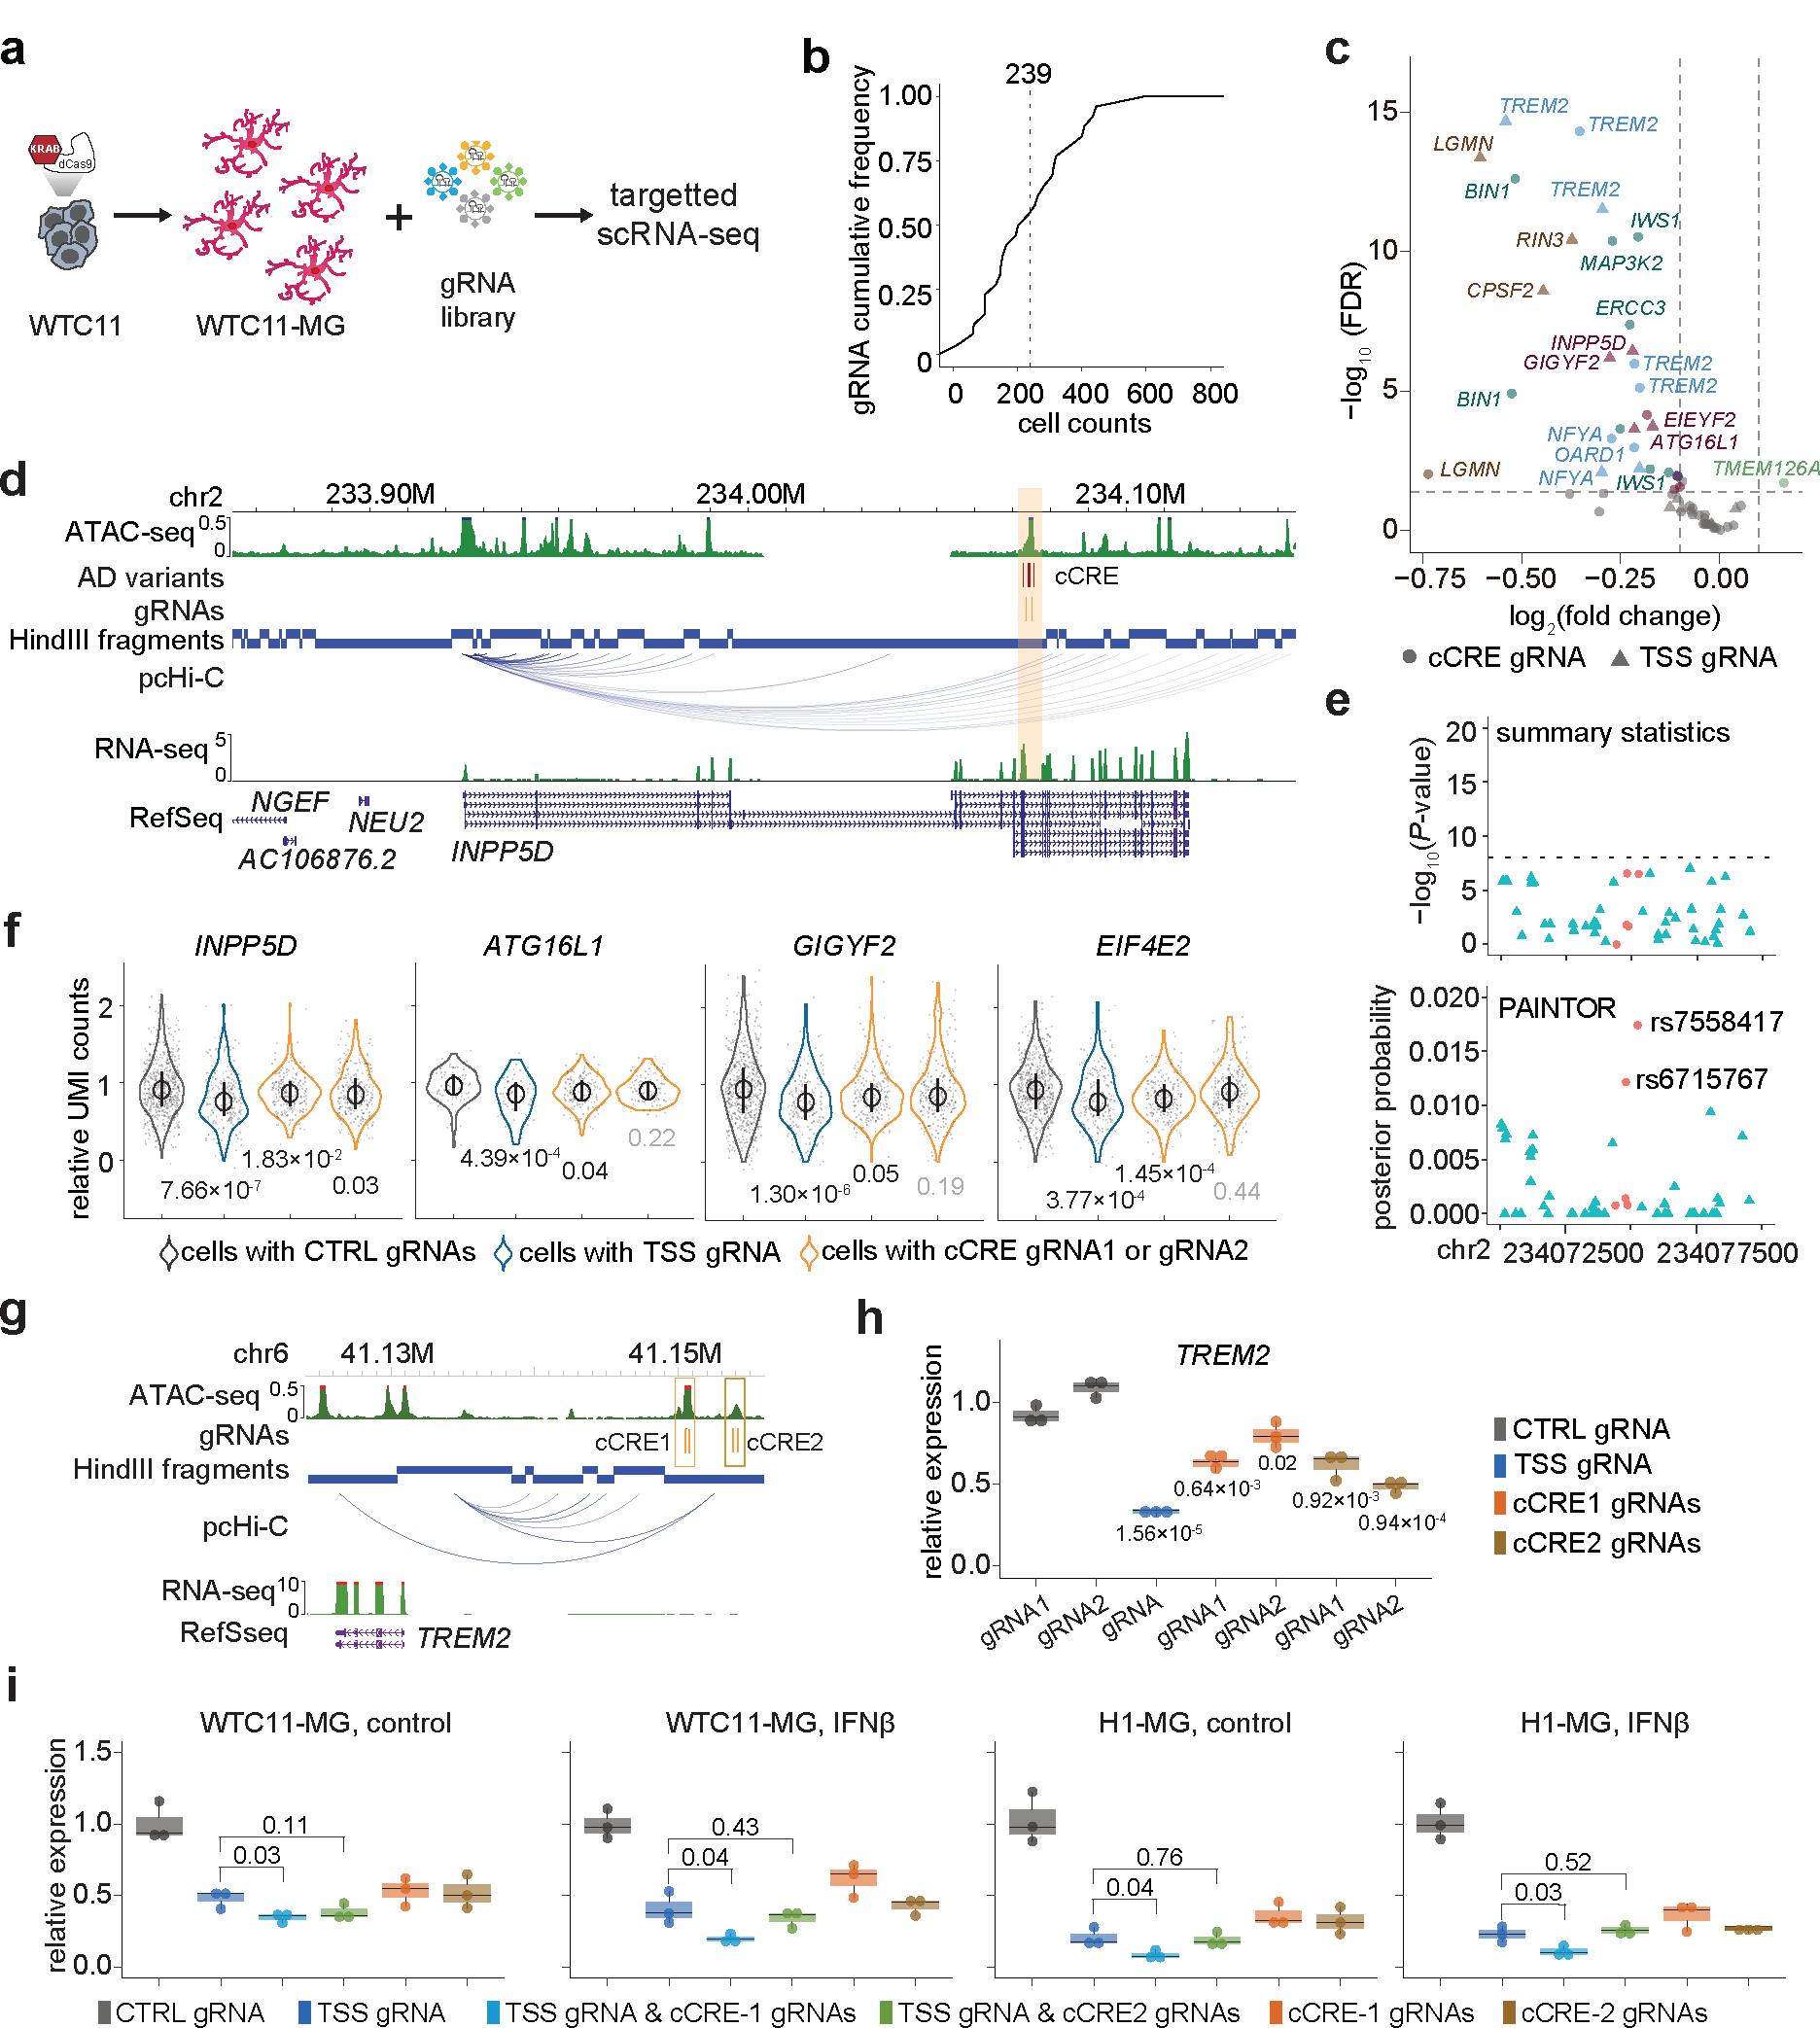
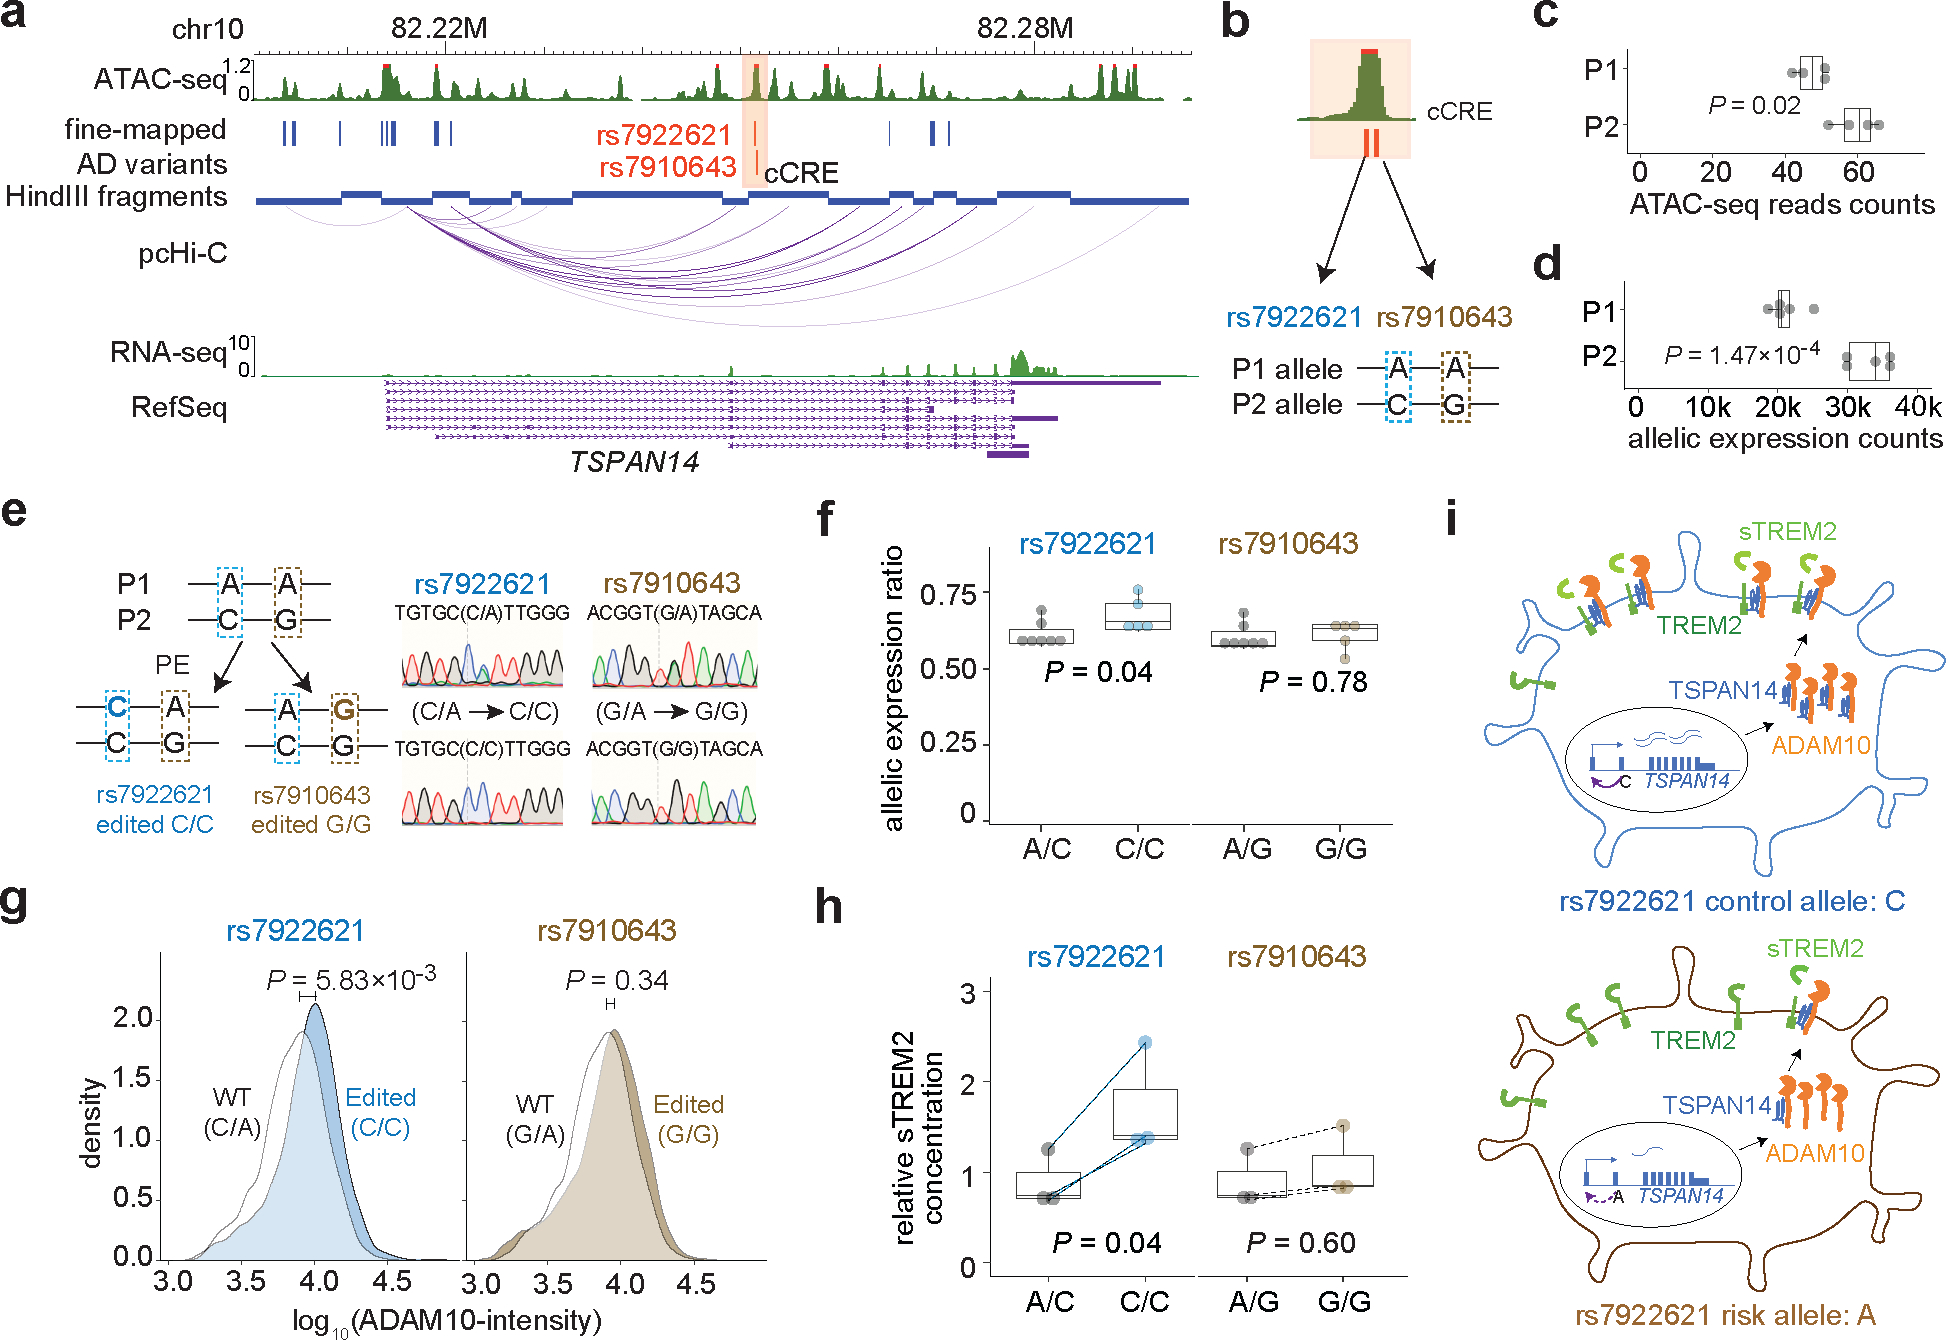
Candidate cis-regulatory elements (cCREs) in microglia demonstrate the most substantial enrichment for Alzheimer's disease (AD) heritability compared to other brain cell types. However, whether and how these genome-wide association studies (GWAS) variants contribute to AD remain elusive. Here we prioritize 308 previously unreported AD risk variants at 181 cCREs by integrating genetic information with microglia-specific 3D epigenome annotation. We further establish the link between functional variants and target genes by single-cell CRISPRi screening in microglia. In addition, we show that AD variants exhibit allelic imbalance on target gene expression. In particular, rs7922621 is the effective variant in controlling TSPAN14 expression among other nominated variants in the same cCRE and exerts multiple physiological effects including reduced cell surface ADAM10 and altered soluble TREM2 (sTREM2) shedding. Our work represents a systematic approach to prioritize and characterize AD-associated variants and provides a roadmap for advancing genetic association to experimentally validated cell-type-specific phenotypes and mechanisms.


Conflict of interest statement

Competing interests statement

The authors declare no competing financial interests.

Figures

Extended Data Fig. 1.
Extended Data Fig. 1.. Characterization of the hPSC-derived microglia-like cells.
a, PRS of each donor are shown with respect to PRS for individuals of matched continental ancestry from the 1000 Genomes Project (1000G). For WTC11, we used 1000G East Asian (EAS), and H1 European (EUR). The red dashed lines represent PRS for WTC11 and H1. b, The yield of IBA1 or TMEM119 positive microglia is represented by the number of immunostaining positive cells divided by the total number of cells. Six coverslips from 3 independent differentiations were used for statistics. Boxplots indicate the median and interquartile range. Whiskers mark the 5th and 95th percentiles. c, Marker gene expressions are displayed in the UMAP of scRNA-seq. Percentage of positively expressed cells are calculated by pct.exp in the Seurat package. d, Representative contour plots depicting FACS gating strategy. Cells were separated from debris of various sizes based on the forward scatter area (FSC-A) and side scatter area (SSC-A). Two singlet gates were applied using the width and height metrics of the side scatter (SSC-H versus SSC-W) and forward scatter (FSC-H versus FSC-W). Latex beads-FITC signals are shown for all singlets.
Extended Data Fig. 2.
Extended Data Fig. 2.. Transcriptome analysis of hPSC-derived microglia-like cells with other cell types.
a, RNA-seq replicates were hierarchically clustered according to gene expression distances using DESeq2 (left). PCA plot displaying all samples (right). b, PCA plots of RNA-seq comparisons between hPSC-microglia differentiated with multiple protocols, and primary microglia in vitro and in vivo and other cell types. c, Heatmap showing scRNA-seq analysis of cell type-specific and shared IFNß stimulation responsive genes in microglia and peripheral myeloid cells. d, Examples of genes highly expressed (top 5) or lowly expressed (bottom 3) in microglia compared to peripheral myeloid cells. e, Examples of microglia-specific IFNß responsive genes. f, Top enriched GO terms of microglia specific IFNß responsive genes. Enriched GO terms are ranked by the percentage of total microglia-specific genes in the given GO term. The counts of enriched genes and adjusted P value for multiple comparisons were reported. Expanded lists of enriched GO terms are available in Supplementary Table 3.
Extended Data Fig. 3.
Extended Data Fig. 3.. Enrichment analysis of IFNβ responsive genes compared to disease-associated microglia (DAM) feature genes.
a, Barplots show the q values and enrichment scores of GSEA results for IFNβ responsive genes, in comparison with published datasets,,– (dash line, q = 0.05). IFNβ responsive genes are highly enriched in multiple clusters of DAM by Olah et al., including the C4 cluster, representing cells with activated IFN signaling, the C7 cluster, representing cells expressing DAM genes, as well as C5 and C6, representing cells expressing genes related to anti-inflammatory responses. The C2 cluster, representing homeostatic microglia which are more likely derived from the temporal neocortex of younger temporal lobe epilepsy patients compared to the other homeostatic population, is also enriched for IFNβ responsive genes. 4 clusters are not enriched for IFN responsive genes, including C1, a homeostatic population shared by all brain regions in all donors, C3, cells with enriched expression of cellular stress genes, C8, cells enriched for respiratory electron transport, and C9 enriched with genes of cell cycle. In addition, IFNβ responsive genes are enriched in microglia samples associated with AD from 5 additional studies, including microglia samples in the human-MG4 cluster and the mouse-MG4 cluster, which are most enriched with DAM genes among all clusters from Sayed et al., the MG0 cluster (highly represented in AD microglia) compared to the MG1 cluster (control microglia) from Zhou et al., and AD DAM DEGs from Mostafavi, et al., Kosoy et al., and Morabito et al.. b, UMAP plot visualizing integration of 3,038 WTC11-microglia scRNA-seq with 4,126 primary microglia snRNA-seq from Morabito et al. Cells are colored by sample origins. c, UMAP plot visualizing joint clustering splitted by donor condition (AD/control) or treatment (IFNβ stimulation/control). d, Cell proportions of each cluster splitted by donor condition or treatment. e, Cell proportion fold change in AD vs control or IFNβ stimulation vs control for 3 major clusters using monte-carlo/permutation test. Data are shown as mean ± s.d. (n_permutations = 1000).
Extended Data Fig. 4.
Extended Data Fig. 4.. Integrative analysis of chromatin accessibility, chromatin interactions, and gene expression.
a, Heatmap with pairwise correlations and hierarchical clustering of read densities at the set of unified open chromatin peaks for ATAC-seq datasets (left panel). PCA plot of ATAC-seq comparisons between hPSC-derived microglia-like cells, primary microglia and other cell types (right panel). b, Upset plot showing overlapping peaks of ATAC-seq datasets in WTC11 (hPSC), excitatory neuron, macrophage, microglia ex vivo, microglia in vitro, microglia derived from WTC11 (control and IFNβ stimulated) and microglia derived from H1 (control and IFNβ stimulated). c, Heatmap of Jaccard Index for pairwise overlap among the 9 ATAC-seq datasets in (b). Two-sided chi-squared tests on pairwise overlapping all led to P values less than 2.2e-16. d, Motif enrichment analysis for 93 TSS overlapping DARs in response to IFNß treatment. P values from HOMER and corresponding TF expression levels are shown. e, Heat map with pairwise similarity based on reproducibility analysis for pcHi-C replicates using HPRep (left). Heatmap of the Jaccard index for comparison of chromatin interaction profile in primary microglia, neuron, oligodendrocyte and hPSC derived microglia (right). f, Upset plot showing most of the IFNß stimulation responsive genes (total 3,811 including 1,460 down-regulated and 2,351 up-regulated genes) are not associated with differential chromatin accessible regions (DARs) or differential chromatin interacting regions (DCRs). g, Pairwise canonical variable (CV) plots for all samples: (left) RNA-seq CV1 vs. ATAC-seq CV1; (middle) RNA-seq CV1 vs pcHi-C CV1; (right) pcHi-C CV1 vs ATAC-seq CV1. h, Volcano plot showing differentially expressed genes upon IFNß stimulation in microglia with a cutoff of adjusted P < 0.05 and absolute log2(fold change) > 0.5. MS4A6A gene is labeled.
Extended Data Fig. 5.
Extended Data Fig. 5.. Summarized results of CRISPRi and scRNA-seq analysis of cCREs with prioritized AD variants.
a-d, In all examples, tested cCREs are highlighted with orange or brown boxes. gRNAs targeting cCREs with AD variants are shown as red vertical lines. Genes expressed in microglia and exhibiting expression changes upon perturbation are shown with red labels. Distributions of relative gene expression levels are shown in violin plots where circles mark the median, and the black bars mark the upper and lower quantiles. Each dot represents one single cell. Number of cells are indicated in Supplementary Table 7d. P values are calculated by comparing gene expression between cells infected with control gRNAs and cells infected with gRNAc targeting cCREs using two-sided two-sample t-test and adjusted by Benjamini-Hochberg FDR multiple testing correction. Adjusted P values (FDR) are labeled. (a) TREM2 locus, (b) RIN3 locus, (c) BIN1 locus, and (d) PICALM locus. Notably at the TREM2 locus, microglia receiving both TSS gRNA2 and cCRE1 showed enhanced downregulation of TREM2 compared to cells with TSS gRNA2 alone. e, Gene expression levels after CRIPSRi targeting cCREs at BIN1 and RIN3 loci with 2 gRNAs in WTC11-derived microglia-like cells. P values calculated using two-sided two-sample t-test (n = 3). Boxplots indicate the median and interquartile range. Whiskers mark the 5th and 95th percentiles.
Extended Data Fig. 6.
Extended Data Fig. 6.. Functional validation of AD risk cCREs under control and IFNβ stimulated conditions.
a, CRIPSRi validation on cCREs at INPP5D, BIN1, RIN3 and TREM2 loci in WTC11 microglia-like cells treated with IFNβ. P values calculated using two-sided two-sample t-test. Three independent replicates per condition and two sgRNAs per replicate were used for each experiment. Boxplots indicate the median and interquartile range. Whiskers mark the 5th and 95th percentiles. b, Scatter plot showing the fold change of cCRE perturbation in control or IFNβ treated condition. The Pearson correlation coefficient and its P value are reported. Linear regression line (black) with 95% confident interval (gray shade) are plotted. c, Genome browser snapshot showing the INPP5D locus containing a cCRE with prioritized AD variants and gRNAs for perturbation in single cell analysis. Genes expressed in microglia at this locus (red labels) are analyzed. Green boxes highlight the cCRE and promoters of neighboring genes. d, Down-regulation of INPP5D, GIGYF2, ATG16L1, and EIF4E2 by perturbing the cCRE region are confirmed by bulk CRISPRi followed by RT-qPCRs. P values are calculated with two-sided two sample t-test. Three independent replicates per condition and two sgRNAs per replicate were used for each experiment. Boxplots indicate the median and interquartile range. Whiskers mark the 5th and 95th percentiles.
Extended Data Fig. 7.
Extended Data Fig. 7.. Phenotypic analysis of hPSC-derived microglia-like cells under synergistic inhibition of TREM2 enhancer and promoter.
a, FACS analysis of proliferation for WTC11- and H1-derived microglia-like cells perturbed with synergistic inhibition of TREM2 enhancer and promoter in both control and IFNβ stimulated conditions. b, Representative contour plots of Ki-67 FITC FACS gating strategy. Cells were separated from debris based on the forward scatter area and side scatter area. Two singlet gates were applied using the width and height metrics of the side scatter and forward scatter. Ki-67 FITC signals are shown for all singlets. c, Negative control population using microglia not stained with Ki-67 antibody. d, FACS analysis of phagocytosis capacity for WTC11- and H1-derived microglia-like cells perturbed with synergistic inhibition of TREM2 enhancer and promoter in both control and IFNβ stimulated conditions. e, Representative contour plots of Latex beads-FITC FACS gating strategy. Cells were separated from debris based on the forward scatter area and side scatter area. Two singlet gates were applied using the width and height metrics of the side scatter and forward scatter. Latex beads-FITC signals are shown for all singlets. f, Negative control population using microglia not incubated with Latex beads.
Extended Data Fig. 8.
Extended Data Fig. 8.. Validation of prioritized AD variants by allelic analysis.
a, The total expression levels of TSPAN14 are elevated in microglia-like cells derived from H1 with prime editing rs7922621 (A/C to C/C), but not in microglia with prime editing at rs7910643 (A/G to G/G). P values are calculated with two-sided paired t-test (dash line indicating the pairing within each differentiation batch, n = 5). Each dot represents one biological replicate. b, Representative results from sanger sequencing display WTC11 rs7922621 wildtype (A/A) and KI clones (A/C). c. The ratios of allelic expression of TSPAN14 decrease in microglia-like cells derived from KI clones (rs7922621, A/C) compared to those derived from wildtype clones rs7922621 (A/A). P values calculated using two-sided two-sample t-test (n = 6). Boxplots indicate the median and interquartile range. Whiskers mark the 5th and 95th percentiles. d, Representative contour plots of ADAM10 FACS gating strategy. Cells were separated from debris based on the forward scatter area and side scatter area. Two singlet gates were applied using the width and height metrics of the side scatter and forward scatter. Live cells are selected based on SYTOX Blue signal and ADAM10 signals are shown for all live singlets. e, Violin plot of log10(ADAM10 intensity) in flow cytometry for WT controls, rs7922621 (G/G) edited cells, rs7910643 (C/C) edited cells across all replicates. P values are calculated using one-sided two-sample Wilcoxon test on ADAM10 levels for all cells compared to WT control within each replicate (n = 5). The horizontal line indicates the median. f, RT-qPCR experiments show that editing rs7922621 from A/C to C/C does not affect the expression levels of TSPAN15, TSPAN17, or TSPAN33 in microglia. P values are calculated with two-sided paired t-test (dash line indicating the pairing within each differentiation batch, n = 5). Each dot represents one biological replicate.
Extended Data Fig. 9.
Extended Data Fig. 9.. Phenotypic analysis of rs7922621 prime-edited WTC11- and H1-derived microglia-like cells.
FACS analysis of a, proliferation and b, phagocytosis capacity of WTC11 and H1 wild type and rs7922621 prime-edited clones derived microglia-like cells in both control and IFNβ stimulated conditions.
Figure 1.
Figure 1.. Characterize differentiated microglia.
a, Schematic workflow of microglia differentiation and maturation using growth factors. b, Representative immunofluorescence staining of microglia-specific markers IBA-1 and TMEM119 from 3 independent differentiations. The white bars at the lower right corner represent 20 μm. c, FACS analysis of phagocytosis capacity of differentiated microglia with fluorescein-labeled rabbit IgG-coated latex beads. d, scRNA-seq UMAP visualization of cells from four distinct immune cell types including iPSC-derived microglia-like cells, in response to IFNß stimulation. Multiplexed single cell gene expression analysis using the 10X platform identifies eight major cell clusters corresponding to cell types and IFNß treatment conditions. e, Gene expression analysis reveals gene groups responding differentially to IFNß stimulation between peripheral myeloid cells and microglia.
Figure 2.
Figure 2.. Chromatin accessibility and interaction dynamics influence IFNß stimulated transcriptional changes in microglia.
a, Heatmaps showing DARs after IFNß stimulation in WTC11- and H1-derived microglia-like cells. Heatmaps were plotted +/−500bp to the center of DARs. b, Motif enrichment analysis for distal DARs in response to IFNß treatment. We analyzed 1,152 distal regions with increased accessibility. P values from HOMER and corresponding TF expression levels are shown. c, Volcano plot showing differential chromatin contacting regions (DCRs) between control and IFNß stimulated microglia by Chicdiff. Dash lines indicate adjusted P value cutoff 0.05 and log2(fold change) cutoff 0.5. d, Forest plot showing odds ratio (center dot) of estimated transcriptional changes for each gene group with 95% confidence interval. Red (n = 269): genes with their promoters associated with distal DAR and DCR changes. Purple (n = 248): genes with their promoters associated with distal DAR but no chromatin interaction changes. Green (n = 697): genes with DARs but DARs don’t interact with gene promoters. Blue (n = 202): genes with promoters associated with DCRs only. e, Genome browser snapshot of the MS4A6A locus. MS4A6A expression is upregulated after IFNß stimulation. A distal cCRE (pink), harboring fine-mapped AD variant rs636317 and interacting with the MS4A6A promoter region (gray), exhibits increased chromatin accessibility after IFNß stimulation. f, Quantification of increased chromatin interactivity between the MS4A6A promoter (gray) and the cCRE (pink) after IFNß stimulation.
Figure 3.
Figure 3.. Fine-mapping of AD risk loci with microglia 3D epigenome annotation.
a, LDSC analysis using annotations of ATAC-seq peaks (open circle) or ATAC-seq peaks interacting with promoters (solid circle) in hPSC-derived microglia-like cells, with and without IFNß stimulation, excitatory neurons, and astrocytes. Error bars represent the s.d. b, Workflow of fine-mapping and prioritization of AD causal variants. c, Bar plot showing the number of prioritized risk variants, total and novel risk cCREs at each locus. d, Pathway enrichment analysis for pcHi-C-annotated putative target genes of prioritized AD variants within constitutive (n = 146) and IFNβ-responsive cCREs (n = 68). The counts of enriched genes and adjusted P values are reported.
Figure 4.
Figure 4.. Characterize fine-mapped AD risk loci with pooled CRISPRi and targeted scRNA-seq in hPSC-derived microglia-like cells.
a, Overview of CRISPRi perturbation and single cell gene expression analysis of fine-mapped AD risk loci in iPSC-derived microglia. dCas9-KRAB-WTC11 were differentiated into microglia and transfected with lentivirus library to perturb fine-mapped AD risk loci. CRISPRi effect were evaluated by HyPR-seq after 1 week. b, Cumulative frequency distribution (CFD) of the number of cells with each gRNA used in analysis. c, Volcano plot of the gRNA-to-gene pairs tested in cis. 14 genes were significantly affected by AD risk loci perturbation (FDR < 0.05, log2(fold change) < −0.1) for 10 AD risk variants in 5 cCREs. Genes from the same AD risk locus are labeled with the same color. Triangles mark transcriptional changes of genes in cells with TSS gRNA-gene pairs, and circles mark changes with distal cCRE gRNA-gene pairs. d, A risk cCRE (orange) interacting with the INPP5D promoter. e, The risk cCRE overlaps five prioritized AD variants (red dots) which were not significant (−log10(P value) < 8) in AD summary statistics. f, Quantitative effects of AD risk cCRE on the expression of INPP5D in cis and three other neighboring genes, including ATG16L1, GIGYF2, and EIF4E2. P values calculated using two-sided two-sample t-test and adjusted by Benjamini-Hochberg FDR multiple testing correction. The median, upper and lower quantiles are indicated by circle and bar. Each dot represents one single cell. N are indicated in Supplementary Table 7d. g, Genome browser snapshot of the TREM2 locus. h, CRIPSRi perturbation targeting TREM2 cCREs followed by RT-qPCR analysis in WTC11-derived microglia-like cells. i, Quantification of TREM2 expression in WTC11- and H1-derived microglia-like cells infected with gRNAs for non-human targeting controls (black), TREM2 TSS (dark blue), TSS and cCRE1 (light blue), TSS and cCRE2 (green), cCRE1 (orange), cCRE2 (brown) under control and IFNß stimulated conditions. P values calculated using two-sided two-sample t-test for (h) and (i). Three independent replicates per condition and two sgRNAs per replicate were used for each experiment. Boxplots indicate the median and interquartile range. Whiskers mark the 5th and 95th percentiles.
Figure 5.
Figure 5.. Linking prioritized AD variants to phenotypes by allelic analyses and cellular functional assays.
a, Two prioritized AD variants located in a cCRE (highlighted in orange) physically interacting with TSPAN14 promoter. b, hESC H1 genome is heterozygous for the two AD variants. The P1 allele has the risk alleles: rs7922621 (A) and rs7910643 (A), while the P2 allele has the non-risk alleles: rs7922621 (C) and rs7910643 (G). c, Allelic analysis of ATAC-seq data in H1 derived microglia reveals decreased chromatin accessibility of the P1 allele compared to the P2 allele (two-sided binomial test, n = 4). d, Allelic analysis using haplotype-resolved SNPs in the TSPAN14 gene body shows reduced TSPAN14 expression from the P1 allele compared to the P2 allele in microglia (two-sided binomial test, n = 5). e, Illustration of the prime editing strategy to convert rs7922621 (A) and rs7910643 (A) on the P1 allele to rs7922621 (C) and rs7910643 (G), respectively. Representative results from sanger sequencing display wildtype clones and KI clones. f, Allelic imbalance of TSPAN14 gene expression in the wild type clones (A/C) is partially reduced by prime-editing of rs7922621 (A/C to C/C) but not rs7910643. P values calculated using two-sided two-sample t-test (n = 5). g, Microglia with rs7922621 (C/C) genotype have elevated cell surface ADAM10 than wildtype microglia by immunostaining and FACS analysis. P values calculated using one-sided (edited > WT) two-sample Wilcoxon test (n = 5). h, rs7922621 (C/C) prime-edited microglia, but not rs7910643 (G/G) edited microglia, shed significantly more sTREM2 than wildtype microglia. P values calculated using two-sided paired (dash line) t-test between wildtype and prime-edited microglia from the same differentiation batch (n = 3). Boxplot indicates the median and interquartile range and whiskers mark the 5th and 95th percentiles for (c), (d), (f), (h). I, Proposed model of linking AD risk variant rs7922621 to function. rs7922621 risk allele A disrupts cis-regulatory function and down-regulate TSPAN14 expression, which leads to impaired ADAM10 trafficking and maturation to cell surface. The reduced ADAM10 level at the cell surface reduces TREM2 cleavage and sTREM2 shedding.

References

    1. Nott A et al. Brain cell type-specific enhancer-promoter interactome maps and disease-risk association. Science 366, 1134–1139, doi:10.1126/science.aay0793 (2019). - DOI - PMC - PubMed
    1. Neuner SM, Tcw J & Goate AM Genetic architecture of Alzheimer's disease. Neurobiol Dis 143, 104976, doi:10.1016/j.nbd.2020.104976 (2020). - DOI - PMC - PubMed
    1. Song M et al. Mapping cis-regulatory chromatin contacts in neural cells links neuropsychiatric disorder risk variants to target genes. Nat Genet 51, 1252–1262, doi:10.1038/s41588-019-0472-1 (2019). - DOI - PMC - PubMed
    1. Song M et al. Cell-type-specific 3D epigenomes in the developing human cortex. Nature 587, 644–649, doi:10.1038/s41586-020-2825-4 (2020). - DOI - PMC - PubMed
    1. Martin P et al. Capture Hi-C reveals novel candidate genes and complex long-range interactions with related autoimmune risk loci. Nat Commun 6, 10069, doi:10.1038/ncomms10069 (2015). - DOI - PMC - PubMed

Methods-only reference

    1. Choi SW & O'Reilly PF PRSice-2: Polygenic Risk Score software for biobank-scale data. Gigascience 8, doi:10.1093/gigascience/giz082 (2019). - DOI - PMC - PubMed
    1. Quinlan AR & Hall IM BEDTools: a flexible suite of utilities for comparing genomic features. Bioinformatics 26, 841–842, doi:10.1093/bioinformatics/btq033 (2010). - DOI - PMC - PubMed
    1. Korsunsky I et al. Fast, sensitive and accurate integration of single-cell data with Harmony. Nat Methods 16, 1289–1296, doi:10.1038/s41592-019-0619-0 (2019). - DOI - PMC - PubMed
    1. Heinz S et al. Simple combinations of lineage-determining transcription factors prime cis-regulatory elements required for macrophage and B cell identities. Mol Cell 38, 576–589, doi:10.1016/j.molcel.2010.05.004 (2010). - DOI - PMC - PubMed
    1. Robinson MD, McCarthy DJ & Smyth GK edgeR: a Bioconductor package for differential expression analysis of digital gene expression data. Bioinformatics 26, 139–140, doi:10.1093/bioinformatics/btp616 (2010). - DOI - PMC - PubMed