. 2023 Oct;55(10):1721-1734.
doi: 10.1038/s41588-023-01504-w. Epub 2023 Sep 21.

APOBEC3B regulates R-loops and promotes transcription-associated mutagenesis in cancer

Affiliations

APOBEC3B regulates R-loops and promotes transcription-associated mutagenesis in cancer

Jennifer L McCann et al. Nat Genet. 2023 Oct.

Abstract

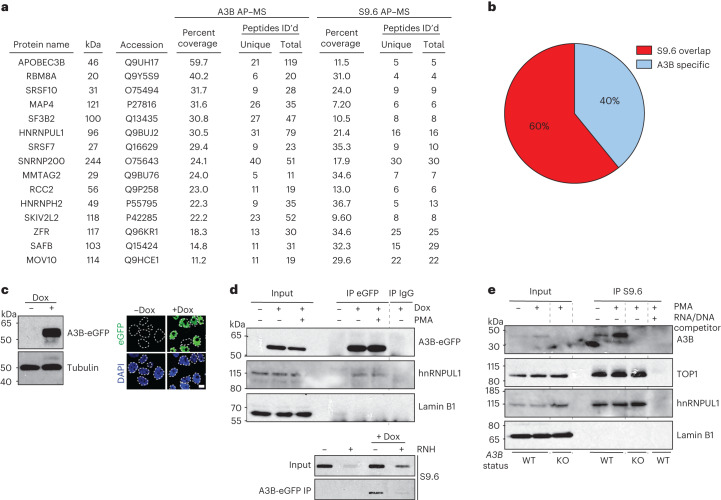
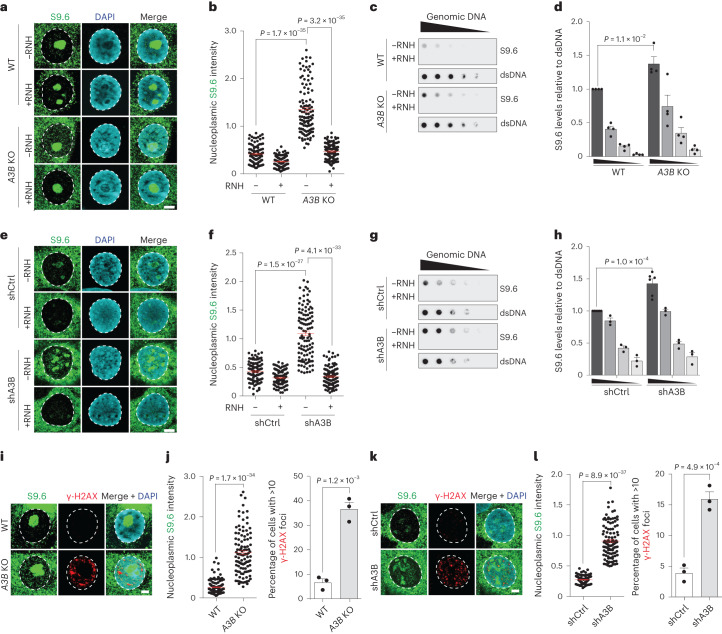
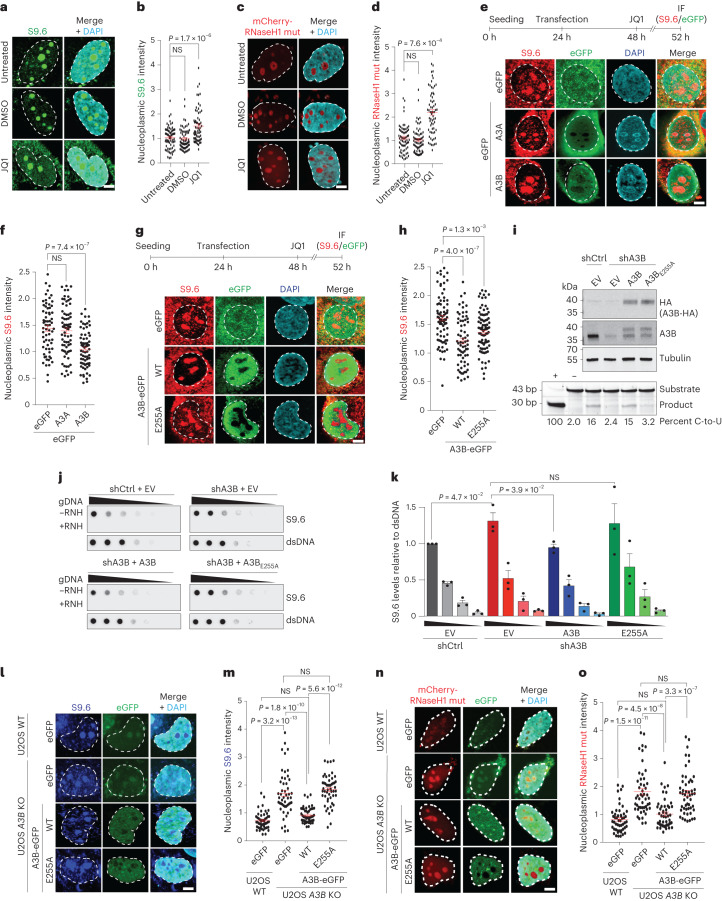
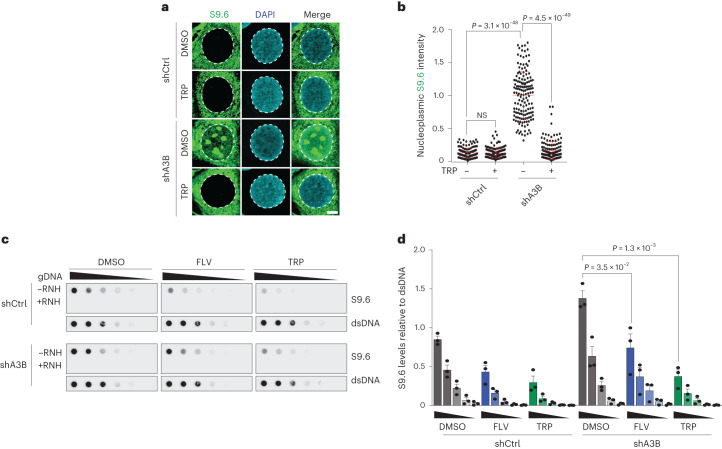
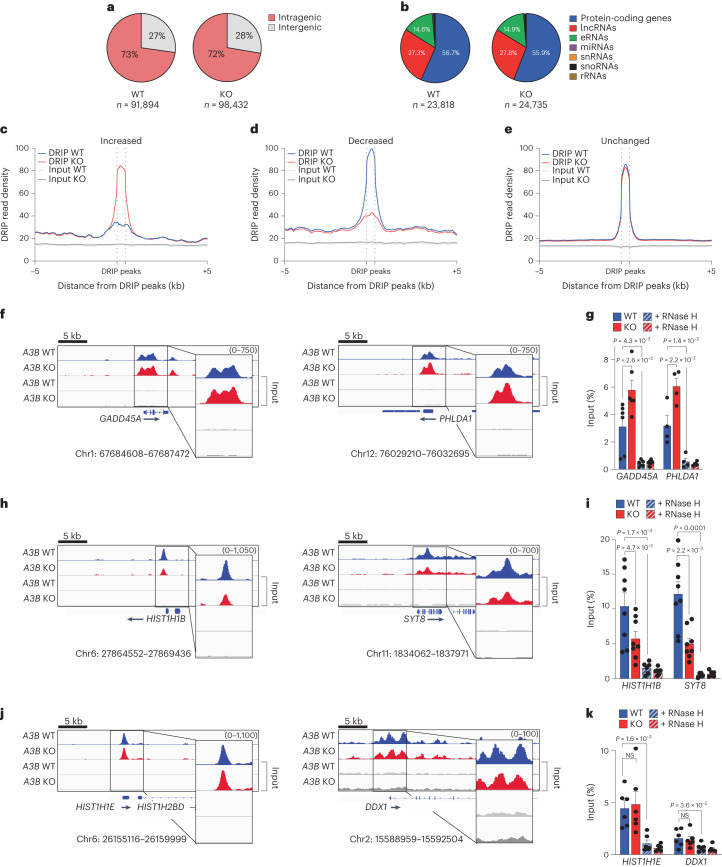
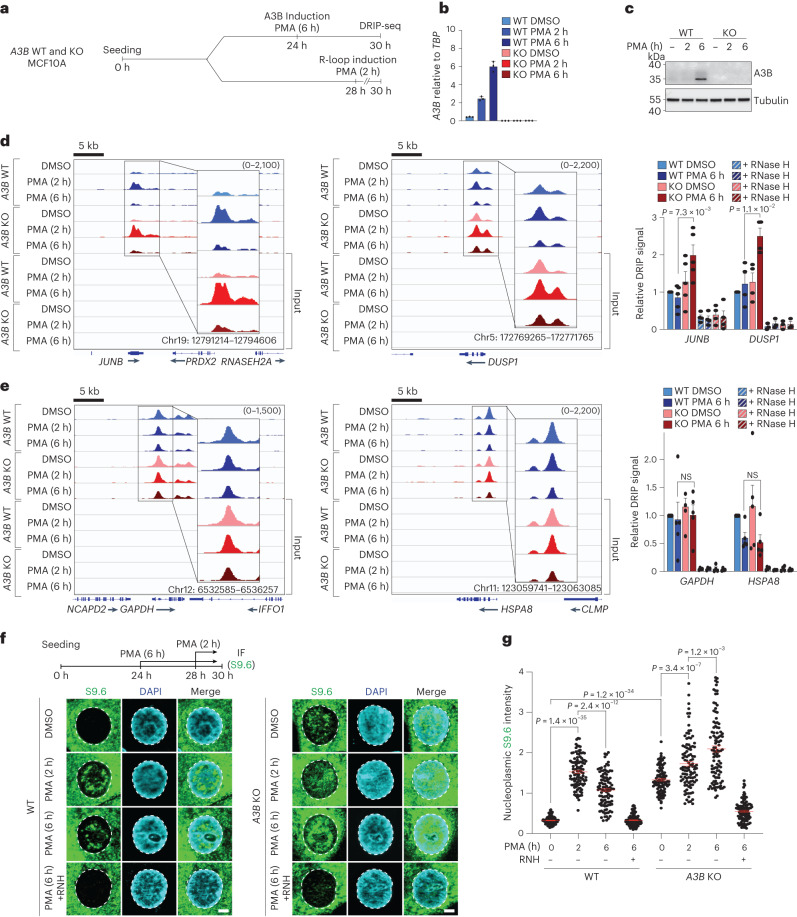
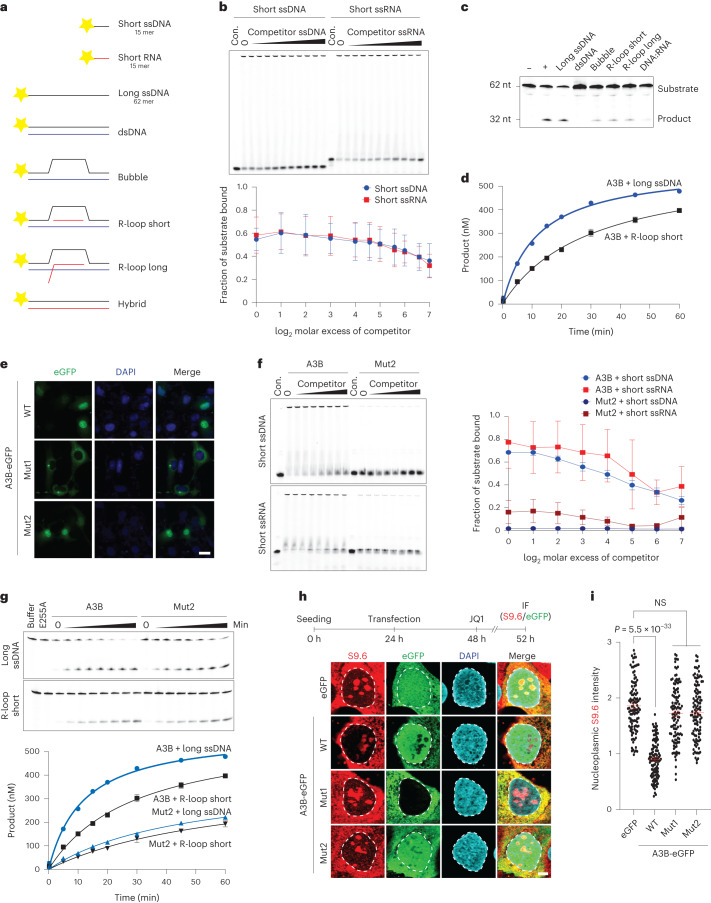
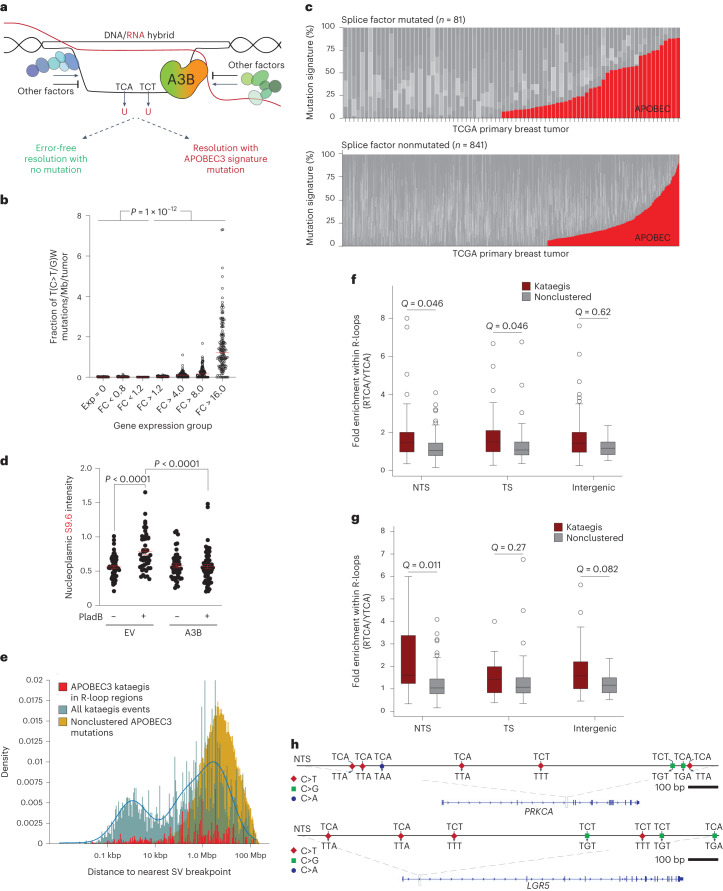
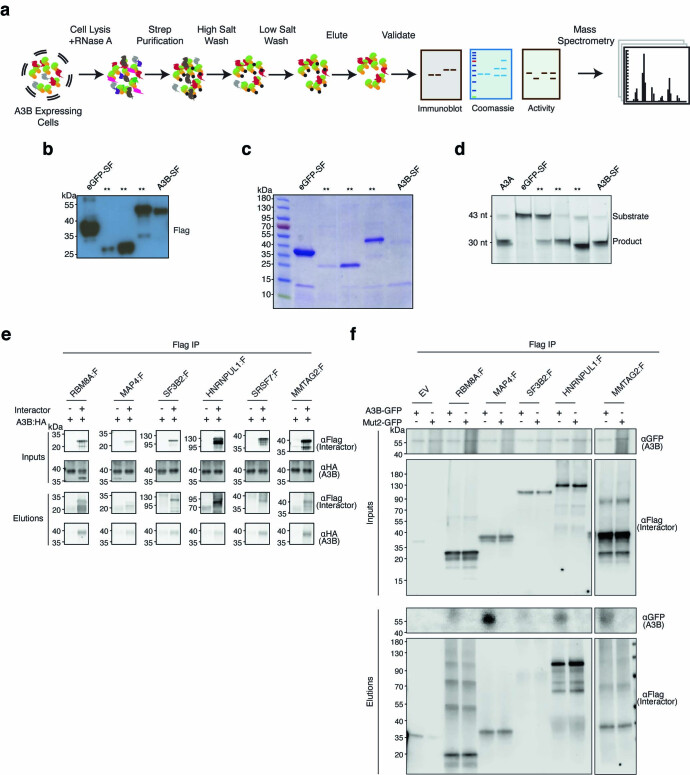
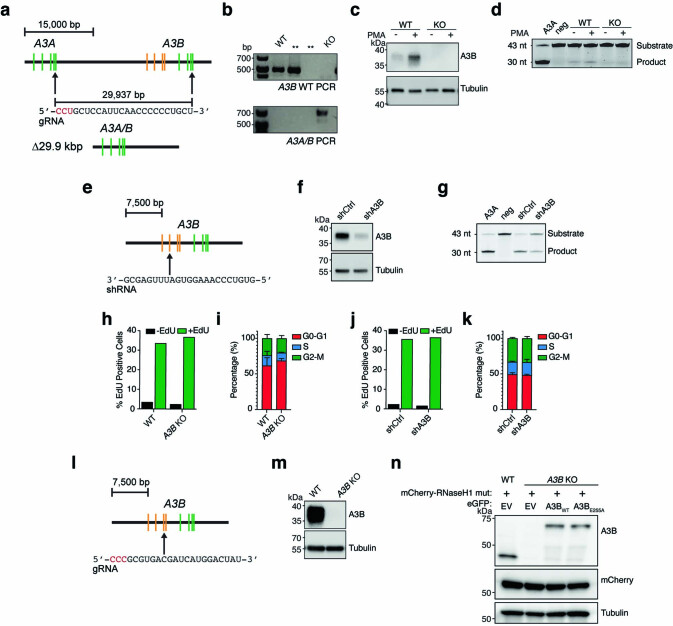
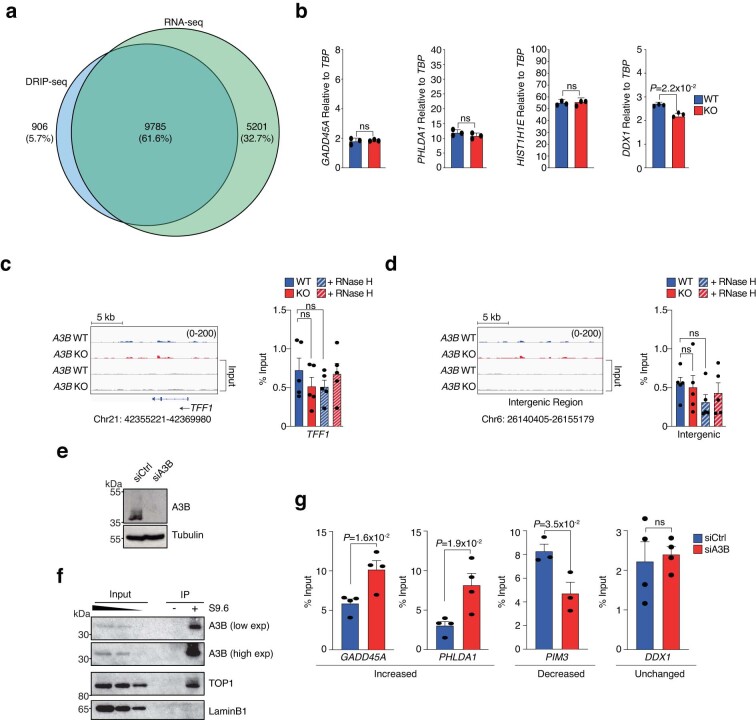
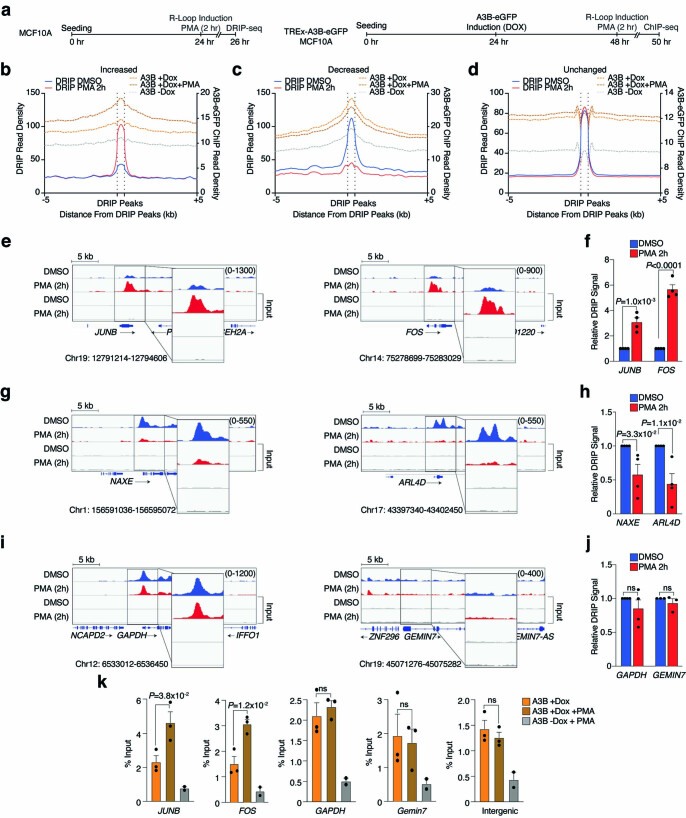
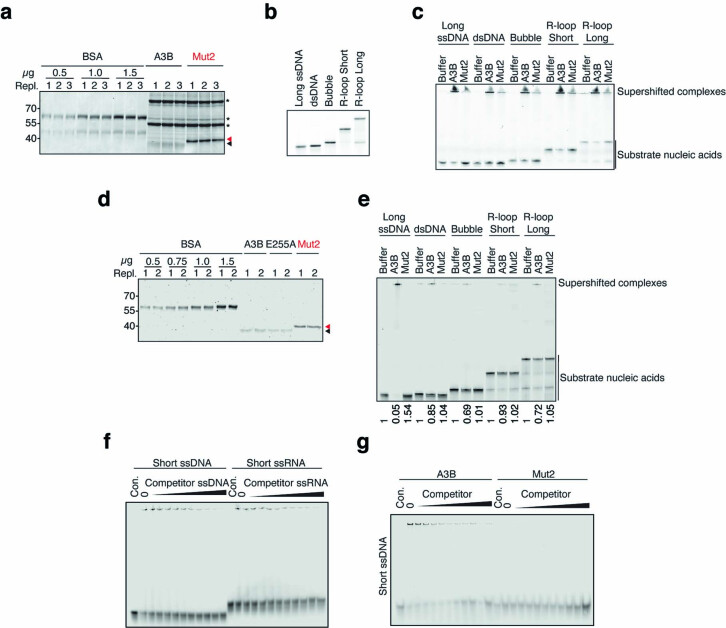
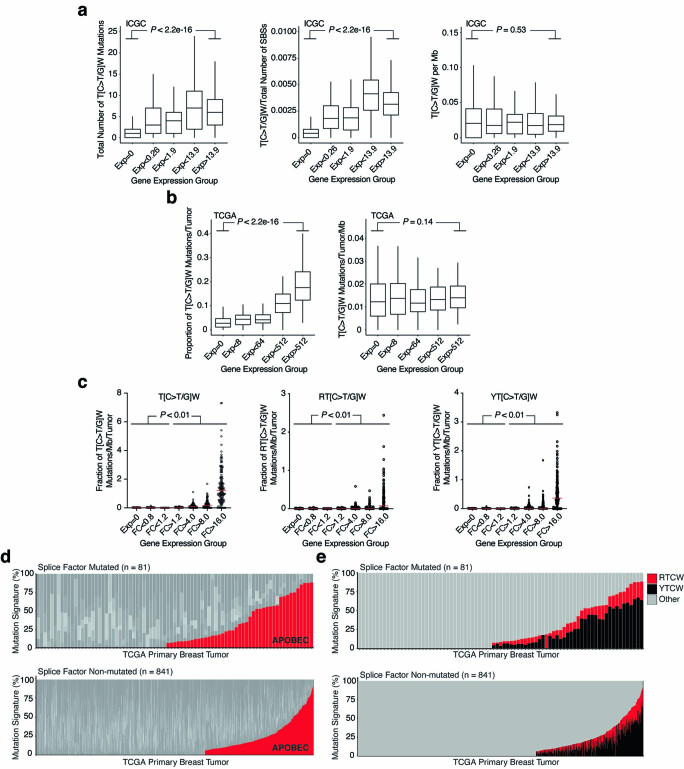
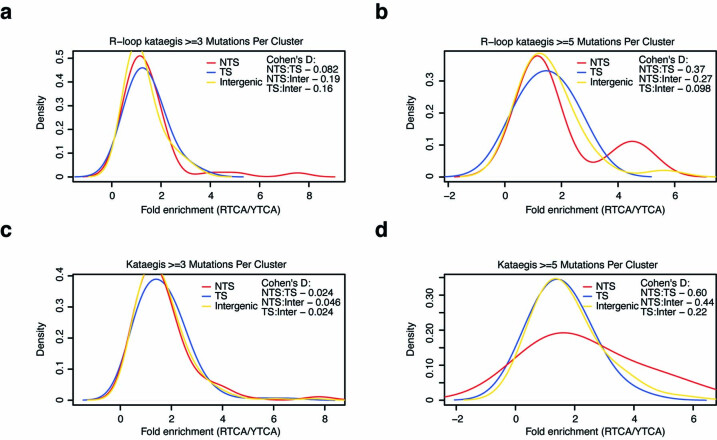
The single-stranded DNA cytosine-to-uracil deaminase APOBEC3B is an antiviral protein implicated in cancer. However, its substrates in cells are not fully delineated. Here APOBEC3B proteomics reveal interactions with a surprising number of R-loop factors. Biochemical experiments show APOBEC3B binding to R-loops in cells and in vitro. Genetic experiments demonstrate R-loop increases in cells lacking APOBEC3B and decreases in cells overexpressing APOBEC3B. Genome-wide analyses show major changes in the overall landscape of physiological and stimulus-induced R-loops with thousands of differentially altered regions, as well as binding of APOBEC3B to many of these sites. APOBEC3 mutagenesis impacts genes overexpressed in tumors and splice factor mutant tumors preferentially, and APOBEC3-attributed kataegis are enriched in RTCW motifs consistent with APOBEC3B deamination. Taken together with the fact that APOBEC3B binds single-stranded DNA and RNA and preferentially deaminates DNA, these results support a mechanism in which APOBEC3B regulates R-loops and contributes to R-loop mutagenesis in cancer.


Conflict of interest statement

The authors declare no competing interests.

Figures

Fig. 1
Fig. 1. APOBEC3B (A3B) interacts with R-loop-associated proteins.
a,b, Shared proteins in A3B and S9.6 AP–MS datasets. c, Immunoblot and IF microscopy analysis of MCF10A-TREx-A3B-eGFP cells treated with vehicle or Dox (1 µg ml−1, 24 h). A3B-eGFP (green) is predominantly nuclear (DAPI, blue). Ten-micrometer scale bar; n = 2 (left); n = 1 (right) biologically independent experiments. d, Immunoblots of indicated proteins in A3B-eGFP or IgG IP from TREx-A3B-eGFP MCF10A cells ± Dox (1 μg ml−1, 24 h), treated with PMA (25 ng ml−1, 2 h) and probed with indicated antibodies (top). Slot blot of A3B-eGFP IP from TREx-A3B-eGFP MCF10A cells ± Dox (1 μg ml−1, 24 h) ± exogenous RNase H (RNH) probed with S9.6 antibody (bottom). n = 2 biologically independent experiments. e, Immunoblots of indicated proteins in S9.6 IP reactions from MCF10A WT or A3B KO cells treated with PMA (25 ng ml−1, 5 h). n = 2 biologically independent experiments. Source data
Fig. 2
Fig. 2. Elevated nuclear R-loop levels in A3B knockout and A3B depleted cells.
a,b, IF images (a) and quantification (b) of MCF10A WT and A3B KO cells stained with S9.6 (green) and DAPI (blue) (representative images; 5 μm scale; n = 3 independent experiments with >100 nuclei per condition; red bars represent mean ± s.e.m.; P value by Mann–Whitney test). c,d, S9.6 dot-blot analysis of MCF10A WT and A3B KO genomic DNA dilution series ± exogenous RNase H (RNH; representative images); parallel dsDNA dot blots provided a loading control (c). Quantification normalized to the most concentrated WT signal (representative experiment shown from four independent experiments; mean ± s.e.m.; P value by two-tailed unpaired t-test) (d). e,f, IF images (e) and quantification (f) of U2OS shCtrl and shA3B cells stained with S9.6 (green) and DAPI (blue; representative images; 5 μm scale; n = 3 independent experiments with >100 nuclei per condition; red bars represent mean ± s.e.m.; P value by Mann–Whitney test). g,h, S9.6 dot-blot analysis of a U2OS shCtrl and shA3B genomic DNA dilution series ± exogenous RNase H (RNH; representative images); parallel dsDNA dot blots provided a loading control (g). Quantification normalized to the most concentrated shCtrl signal (representative experiment shown from three independent experiments; mean ± s.e.m.; P value by two-tailed unpaired t-test) (h). i,j, IF images (i) and quantification (j) of MCF10A WT and A3B KO cells stained with S9.6 (green), DAPI (blue) and γ-H2AX (representative images; 5 μm scale; n = 3 independent experiments with >100 nuclei per condition; red bars represent mean ± s.e.m.; P value by Mann–Whitney test (left); P value by two-tailed unpaired t-test (right). k,l, IF images (k) and quantification (l) of U2OS shCtrl and shA3B cells stained with S9.6 (green), DAPI (blue) and γ-H2AX (representative images; 5 μm scale; n = 3 independent experiments with >100 nuclei per condition; red bars represent mean ± s.e.m.; P value by Mann–Whitney test (left); P value by two-tailed unpaired t-test (right). Source data
Fig. 3
Fig. 3. A3B overexpression reduces nuclear R-loop levels.
ad, IF images (a) and quantification (b) of U2OS cells stained with S9.6 antibody (green) and treated with 0.5 µM JQ1 or 0.005% DMSO for 4 h. c,d, IF images (c) and quantification (d) of U2OS cells expressing catalytic inactive mCherry-RNaseH1 (mCherry-RNaseH1-mut, red) and treated with 0.5 µM JQ1 or 0.005% DMSO for 4 h (representative images; 5 μm scale; n = 3 independent experiments with 60 nuclei per condition; red bars represent mean ± s.e.m.; P value by Dunnett multiple comparison; NS, not significant). eh, IF images (e,g) and quantification (f,h) of U2OS cells expressing the denoted eGFP construct (green) and stained with S9.6 (red) and DAPI (blue). Top, experimental workflow and bottom, representative images (5 μm scale; n = 3 independent experiments with >60 nuclei per condition; red bars represent mean ± s.e.m.; P value by Mann–Whitney test). i, Immunoblots of U2OS shCtrl or shA3B cells complemented with empty vector (EV), A3B-HA or A3B-E255A-HA. Bottom, the results of a DNA deaminase activity assay with extracts from the indicated cell lines (reaction quantification below with purified A3A as a positive control (+) and reaction buffer as a negative control (-); n = 2 independent experiments). j,k, Dot-blot analysis of U2OS shCtrl or shA3B cells complemented with EV, A3B-HA or A3B-E255A-HA. A genomic DNA dilution series ± exogenous RNase H (RNH) was probed with either S9.6 antibody or dsDNA antibody as a loading control (representative images) (j). Quantification normalized to the most concentrated shCtrl signal (n = 3 independent experiments; mean ± s.e.m.; P value by two-tailed unpaired t-test) (k). lo, IF images (l) and quantification (m) of U2OS WT and A3B KO cells expressing GFP-EV, A3B WT or A3B E255A (green). Cells were stained with S9.6 antibody (blue). IF images (n) and quantification (o) of U2OS WT and A3B KO cells expressing GFP-EV, A3B WT or A3B E255A (green). Cells were cotransfected with catalytic inactive mCherry-RNaseH1 mutant (mCherry-RNaseH1-mut, red; representative images; 5 μm scale; n = 3 independent experiments with 60 nuclei per condition; red bars represent mean ± s.e.m.; P value by Dunnett multiple comparison). Source data
Fig. 4
Fig. 4. A3B-regulated R-loops are transcription-dependent.
a,b, IF images (a) and quantification (b) of U2OS shCtrl and shA3B cells treated with TRP (1 μM, 4 h) and subsequently stained with S9.6 (green) and DAPI (blue; representative images; 5 μm scale; n = 3 independent experiments with >100 nuclei per condition; red bars represent mean ± s.e.m.; P value by Mann–Whitney test). c,d, S9.6 dot-blot analysis of a genomic DNA dilution series ± RNH from U2OS shCtrl or shA3B cells treated with TRP (1 μM, 4 h) or FLV (1 μM, 1 h; representative images); parallel dsDNA dot blots provided a loading control (c). Quantification was normalized to the most concentrated shCtrl/DMSO signal (n = 3 independent experiments; mean ± s.e.m.; P value by two-tailed unpaired t-test) (d). TRP, triptolide; FLV, flavopiridol. Source data
Fig. 5
Fig. 5. A3B affects a large proportion of R-loops genome-wide.
a,b, Pie graphs representing R-loop distributions in MCF10A WT and A3B KO cells. ce, Meta-analysis of read density (FPKM) for DRIP–seq results from WT (blue) and A3B KO (red) MCF10A partitioned into three groups (c, increased; d, decreased and e, unchanged) as described in the text. Input read densities are indicated by overlapping gray lines. fk, DRIP–seq profiles (f,h,j) for representative genes in each of the groups defined in ce (WT, blue; KO, red). DRIP–qPCR for the indicated genes (g,i,k) ±exogenous RNase H (RNH; striped bars). Values are expressed as percentage of input (means ± s.e.m.). n = 6 (GADD45A, HIST1H1E and DDX1), n = 4 (PHLDA1), n = 8 (−RNH) and n = 6 (+RNH; HISTH1B and SYT8) biologically independent experiments for indicated gene. P value by two-tailed unpaired t-test.
Fig. 6
Fig. 6. Kinetics of R-loop induction and resolution.
a, Schematic of the DRIP–seq workflow used for de. b, RT–qPCR of A3B mRNA from MCF10A WT and A3B KO cells treated with PMA (25 ng ml−1) for the indicated times. Values are expressed relative to the housekeeping gene, TBP (n = 3; mean ± s.e.m.; KO levels not detectable). c, Immunoblots of extracts from MCF10A WT and A3B KO cells treated with PMA (25 ng ml−1) for the indicated times and probed with indicated antibodies (n = 2 independent experiments). d, DRIP–seq profiles for two PMA-responsive genes, JUNB and DUSP1, in DMSO or PMA-treated (25 ng ml−1) MCF10A WT (top profiles, blue) and A3B KO (bottom profiles, red). DRIP–qPCR ± exogenous RNase H (RNH; striped bars) is shown in the histogram to the right. Values are normalized to DMSO WT (mean ± s.e.m.). n = 5 (−RNH) and n = 4 (+RNH; JUNB) and n = 4 (−RNH) and n = 3 (+RNH; DUSP1) biologically independent experiments for indicated gene. P value by two-tailed unpaired t-test. e, DRIP–seq profiles for two PMA nonresponsive genes, GAPDH and HSPA8, in DMSO or PMA-treated (25 ng ml−1) MCF10A WT (top profiles) and A3B KO (bottom profiles). DRIP–qPCR ± exogenous RNase H (RNH; striped bars) is shown in the histogram to the right. Values are normalized to DMSO WT (mean ± s.e.m.). n = 5 (−RNH) and n = 4 (+RNH; GAPDH and HSPA8) biologically independent experiments for indicated gene. P value by two-tailed unpaired t-test. f,g, IF images (f) and quantification (g) of MCF10A WT and A3B KO cells treated with PMA (25 ng ml−1) for the indicated times and stained with S9.6 (green) and DAPI (blue; 5 μm scale; n = 2 independent experiments with >100 nuclei per condition; red bars represent mean ± s.e.m.; P value by Mann–Whitney test). Source data
Fig. 7
Fig. 7. A3B biochemical activities required for R-loop resolution.
a, Schematics of the nucleic acids used in biochemical experiments (5′ fluorescent label indicated by yellow star). The 15-mer short ssDNA and short RNA were used in EMSAs in b and f, and the 62-mer long ssDNA was used alone or as annealed to the indicated complementary nucleic acids (black, DNA; red, RNA) in other experiments. b, Native EMSAs of A3B binding to fluorescently labeled short 15 mer ssDNA or RNA in the presence of increasing concentrations of otherwise identical unlabeled competitor. The corresponding quantification shows the average fraction bound to substrate ± s.d. from n = 3 independent experiments. c, Substrates in a tested qualitatively for deamination by A3B (n = 2 independent experiments). Negative (−) and positive (+) controls are the long ssDNA alone and deaminated by recombinant A3A. d, A quantitative time course of A3B-catalyzed deamination of the long ssDNA versus the R-loop (short) substrate (mean ± s.d. of n = 3 independent experiments are shown with most error bars smaller than the symbols). e, Subcellular localization of A3B-eGFP (WT), Mut1 and Mut2 in U2OS cells (scale = 10 µM; n = 2 independent experiments). f, EMSAs comparing A3B WT and Mut2 binding to short 15 mer ssDNA and RNA in the presence of increasing concentrations of otherwise identical unlabeled competitor ssDNA or RNA. The corresponding quantification shows the average fraction bound to substrate ± s.d. from n = 3 independent experiments. g, Quantitative comparison of A3B WT and Mut2 deamination of the long ssDNA versus an R-loop (short) substrate. Representative gels are shown for the time-dependent accumulation of product, along with quantitation of n = 3 independent experiments (mean ± s.d. with most error bars smaller than the symbols; for comparison, the WT data are the same as those in d). h,i, IF images (h) and quantification (i) of U2OS cells expressing the indicated eGFP construct (green) and stained with S9.6 (red) and DAPI (blue; 5 μm scale; n = 2 independent experiments with >100 nuclei per condition; red bars represent mean ± s.e.m.; P value by Mann–Whitney test). Source data
Fig. 8
Fig. 8. R-loop mutagenesis and kataegis by APOBEC3B.
a, Model for A3B-mediated R-loop resolution with and without mutation. Other R-loop regulatory factors are depicted in shades of green and blue. Transcription, splicing and other RNA- and R-loop-associated complexes are not depicted for clarity. b, A dot plot showing the fraction of APOBEC3-attributed mutations (per Mbp per tumor) in the indicated gene expression groups (fold change (FC) in breast tumors relative to the average observed in normal breast tissues). This analysis includes only breast cancers with significant APOBEC3 signature enrichment (Q < 0.05; n = 154 tumors). Pairwise comparisons are significant for all combinations of the lowest three versus the highest four expression groups (P value by Welsh’s t-test). c, Stacked bar graphs showing the proportion of each COSMIC mutation signature in TCGA breast tumors with mutations in splice factor genes or not (n = 81 splice factor mutated tumors; n = 841 for nonsplice factor mutated tumors; P < 0.017 by Fisher’s exact test). The APOBEC3 signature percentage (red) comprises COSMIC signatures SBS2 and SBS13, and other signatures are shown in different shades of gray. d, Quantification of nucleoplasmic R-loop levels in U2OS cells expressing an empty vector (EV) control or A3B and treated with DMSO or the splicing inhibitor Plad B (4 μM, 2 h; n = 3 independent experiments with >50 nuclei per condition; red bars represent mean ± s.e.m.; P value by two-tailed unpaired t-test). e, Distribution of the distances to the nearest SV of all nonclustered APOBEC3 mutations (gold), all kataegic mutation events (teal) and R-loop-associated APOBEC3 kataegic mutations (red). f,g, Box plot representations of the fold-enrichment within R-loop regions of short (≥3) and long (≥5) APOBEC3 kataegic tracts (RTCA/YTCA) in PCAWG breast tumor WGS. Data are shown for NTS, TS and intergenic regions, and nonclustered mutations within the same regions serve as controls (Q values by Mann–Whitney U test). h, Representative NTS kataegic events in PRKCA (chromosome 17 64,627,540–64,628,540) and LGR5 (chromosome 12 71,850,425–71,852,135). WT trinucleotides and mutational outcomes are indicated.
Extended Data Fig. 1
Extended Data Fig. 1. Controls for AP-MS experiments.
a, Schematic of the AP-MS workflow used to identify the cellular A3B interactome. A3B is shaded orange/green and cellular proteins are indicated by different shapes/colors. b-c, Anti-Flag immunoblot and Coomassie gel analysis of eGFP-SF and A3B-SF following affinity purification and prior to analysis by mass spectrometry (**, samples not pertaining to this manuscript; representative images; n = 6 independent experiments). d, DNA deaminase activity of eGFP-SF and A3B-SF following affinity purification (purified A3A was used as a positive control; **, samples not pertaining to this manuscript; representative images; n = 6 independent experiments). e, co-IP of indicated Flag-tagged interactors and HA-tagged A3B in 293 T cells (representative data from n = 2 independent experiments). Upper immunoblots show the indicated proteins in whole cell lysates (input), and lower immunoblots show the Flag-immunoprecipitated samples (elution). kDa markers are shown the left of each blot and the primary antibody used for detection is shown to the right. f, co-IP of indicated Flag-tagged interactors and eGFP-tagged A3B or eGFP-tagged Mut2 from 293 T cells (representative data from n = 2 independent experiments). Upper immunoblots show the indicated proteins in whole cell lysates (inputs), and lower immunoblots show the anti-Flag immunoprecipitated samples (elutions). kDa markers are shown to the left of each blot and the primary antibody used for detection is shown to the right. Source data
Extended Data Fig. 2
Extended Data Fig. 2. Construction and validation of cell lines.
a, Schematic of the A3B knock-out strategy resulting in an A3A/B fusion. CRISPR cleavage sites are indicated by arrows and the homologous gRNA-targeted region is shown below with PAM (red). Exons are indicated by colored boxes. b, Diagnostic PCR products distinguishing WT A3B and 29.9 kbp A3B deletion allele (**, clones not pertaining to this manuscript; sequence verified). c, Immunoblot of MCF10A WT and A3B KO derivative treated with DMSO or PMA (25 ng/ml, 24 hrs) and probed with the indicated antibodies (n = 3 independent experiments). d, DNA deaminase activity assay using extracts from MCF10A WT and A3B KO derivative treated with DMSO or PMA (25 ng/ml, 24 hrs; purified A3A positive control; reaction buffer negative control; n = 3 independent experiments). e, A3B gene schematic with an arrow indicating the exon 2 mRNA region targeted by an A3B-specific shRNA in depletion experiments (target sequence shown below). f, Immunoblot of U2OS shCtrl and shA3B cell lines probed with the indicated antibodies; (n = 3 independent experiments). g, DNA deaminase activity assay of extracts from U2OS shCtrl and shA3B cell lines (purified A3A was used as a positive control and reaction buffer as a negative control; n = 3 independent experiments). h, EdU staining of MCF10A WT and A3B KO cell lines (n = 1 with a minimum of 10,000 cells per condition). i, PI staining of MCF10A WT and A3B KO cell lines (n = 3 experiments with 10,000 cells per condition; mean ± SD). j, EdU staining of U2OS shCtrl and shA3B cell lines (n = 1 with 10,000 cells per condition). k, PI staining of U2OS shCtrl and shA3B cell lines (n = 3 experiments with 10,000 cells per condition; mean ± SD). l, A3B gene schematic with an arrow indicating the exon 3 gRNA targeting region (target sequence shown below). m, Immunoblot of whole cell extracts from U2OS WT and A3B KO cell lines probed with the indicated antibodies (n = 3 independent experiments). n, Immunoblot of whole cell extracts from U2OS WT and A3B KO cell lines transfected as shown and probed with the indicated antibodies (n = 2 independent experiments). Source data
Extended Data Fig. 3
Extended Data Fig. 3. Supporting data for DRIP-seq experiments.
a, Venn diagram depicting the overlap between DRIP-seq positive genes and expressed genes (RNA-seq) in MCF10A. b, RT-qPCR analysis of mRNA levels in MCF10A (WT) and A3B knockout MCF10A (KO) cells. Values for the indicated genes are expressed relative to the housekeeping gene, TBP (n = 3 independent experiments; mean ± SEM; P-value by two-tailed unpaired t-test). c-d, DRIP-seq profiles for a non-expressed gene, TFF1, and an intergenic region in MCF10A (WT and A3B KO) cells. DRIP-qPCR ± exogenous RNase H (RNH; striped bars) is shown in histograms to the right (n = 5 biologically independent experiments; means ± SEM expressed as percentage of input; ns by two-tailed unpaired t-test). e, Immunoblot of HeLa cells transfected with either an siRNA against Luciferase (siCtrl) or A3B (siA3B) and probed with the indicated antibodies (n = 2 independent experiments). f, Immunoblots of indicated proteins in S9.6 IP reactions from HeLa cells (n = 2 independent experiments). Lamin B1 is a negative control. g, DRIP-qPCR of genes from the subgroups listed in Fig. 5c–e in HeLa cells (n = 4 for each gene, except n = 3 for PIM3, in biologically independent experiments; means ± SEM expressed as percentage of input; P-value by two-tailed unpaired t-test). Source data
Extended Data Fig. 4
Extended Data Fig. 4. Kinetics of R-loop induction and resolution.
a, Schematic of the DRIP-seq (left) and A3B-eGFP ChIP-seq (right) workflows used for panels b-j. b–d, Meta-analysis of read density (FPKM) for DRIP-seq results from DMSO (blue) or PMA-treated (25 ng/ml) MCF10A (red) partitioned into 3 groups (increased, decreased, and unchanged) as described in the text. A3B-eGFP ChIP-seq data (Dox-, Dox+, and Dox+PMA in gray, orange, and brown dashed lines, respectively) superimposed on DRIP peaks ± 5 kb (right y-axis). e, f, DRIP-seq profiles for JUNB and FOS from the increased data set in panel b. JUNB DRIP-seq profile is the same as Fig. 6d PMA 2 h. DRIP-qPCR is shown in the histogram to the right (n = 4 independent experiments; means ± SEM normalized to DMSO; P-value by two-tailed unpaired t-test). g, h, DRIP-seq profiles for NAXE and ARL4D from the decreased data set in panel c. DRIP-qPCR is shown in the histogram to the right (n = 4 independent experiments; means ± SEM normalized to DMSO; P-value by two-tailed unpaired t-test). i, j, DRIP-seq profiles for GAPDH and GEMIN7 from the unchanged data set in panel d. DRIP-qPCR is shown in the histogram to the right (n = 4 for GAPDH and n = 3 for GEMIN7 independent experiments; means ± SEM normalized to DMSO; ns by two-tailed unpaired t-test). k, ChIP-qPCR is shown in the histogram for PMA-responsive (JUNB, FOS) and PMA non-responsive (GAPDH, GEMIN7) genes as well as an intergenic control (n = 3 independent experiments for all conditions except n = 2 for -DOX + PMA; means ± SEM expressed as percentage of input; P-value by two-tailed unpaired t-test).
Extended Data Fig. 5
Extended Data Fig. 5. Purifications of A3B and Mut2 including additional EMSA results.
a, Coomassie-stained gel of Ni-NTA affinity purified A3B and Mut2 proteins from 293 T cells (3 replicate loadings for quantification). Black and red arrow heads indicate WT A3B-mycHis and Mut2-mycHis, respectively. Co-purifying proteins (*) are similar for WT and Mut2 (n = 3 independent experiments). b, Native TBE-PAGE of the 5’ fluorescently labeled substrates depicted in Fig. 7a (size standards not applicable due to native conditions; n = 3 independent experiments). c, Native EMSA comparing WT and Mut2 binding to the indicated nucleic acid substrates. Stronger WT binding is indicated by more supershifted substrates, more intense staining of complexes retained in the wells, and larger diffusion ‘tails’ within each well (an unavoidable issue if some complexes fail to enter the gel; size standards not applicable due to native conditions; n = 3 independent experiments). d, Coomassie-stained gel of purified A3B-, A3B-E72A-, and Mut2-mycHis proteins from Expi293 cells (2 replicate loadings for quantification; n = 1 independent experiments). Black and red arrow heads indicate purified A3B, A3B-E72A, and Mut2 proteins (>85% pure). e, Native EMSA comparing WT A3B and Mut2 binding to the indicated nucleic acid substrates. Stronger WT binding is indicated by a larger proportion of supershifted substrates, more intense staining of complexes retained in the wells, and a diminution of unbound substrate at the expected mobility (this experiment used proteins shown in panel d). The numbers below represent quantification of the substrate band relative to that of the buffer control; n = 3 independent experiments). f, Native EMSAs of WT binding to short 15mer ssDNA or RNA in the presence of increasing concentrations of otherwise identical unlabeled competitor (this experiment used proteins shown in panel d; n = 3 independent experiments). g, EMSAs comparing WT and Mut2 binding to short 15mer ssDNA and RNA in the presence of increasing concentrations of otherwise identical unlabeled competitor ssDNA or RNA (this experiment used proteins shown in panel d; n = 3 independent experiments). Source data
Extended Data Fig. 6
Extended Data Fig. 6. Additional analyses supporting model for R-loop mutation.
a, b, Positive correlations between gene expression levels and APOBEC signature T(C > T/G)W mutation number and frequency in ICGC and TCGA breast cancer data sets flatten upon normalization for gene size (P-value by Pearson’s correlation). ICGC expression groups are based on gene expression levels in normal breast tissue from the Genotype-Tissue Expression (GTEx) project. TCGA expression groups are 0 and quartiles for anything >0 and based on average expression levels for each gene using TCGA RNA-seq values from primary breast tumors. c, Dot plot representations of the relationship between APOBEC signature mutations (per mb per tumor) and the indicated TCGA breast cancer gene expression groups (FC, fold-change relative to mean normal expression value in the TCGA normal breast tissue RNA-seq data). Left is identical to main Fig. 8b and the center and right panels show breakdowns into RTCW and YTCW subsets, respectively. Pairwise comparisons are significant for all combinations of the lowest 3 and the highest 4 FC expression groups (P-value by Welsh’s t-test). d, Data here are identical those in Fig. 8c to facilitate comparison with tetranucleotide breakdowns in panel e. e, An alternative representation of the data in panel d, with RTCW mutation proportions shown in red, YTCW mutation proportions in black, and other signatures in gray. This analysis revealed a significant trend with only 1/43 (2.3%) of the APOBEC3 signature-enriched splice factor mutant breast tumors lacking mutations in A3B-associated RTCW motifs in comparison to 52/326 (15.9%) of the APOBEC3 signature-enriched non-splice factor mutant tumors (that is, the A3B-associated tetranucleotide preference is enriched in the splice factor mutant group and/or depleted from the non-splice factor mutant group; P = 0.028 by Fisher’s exact test).
Extended Data Fig. 7
Extended Data Fig. 7. Enrichments of R-loop kataegis across RTCA versus YTCA contexts.
a, b, Distributions of the fold-enrichment of RTCA versus YTCA sequence contexts within non-transcribed, transcribed, and intergenic regions (red, blue, and yellow lines, respectively). The Cohen’s D effect size was calculated for all pairwise region comparisons within R-loop kataegic events that include smaller clustered events (panel a) versus only larger kataegic events with ≥5 mutations per cluster (panel b). c, d, The same comparisons were performed for all kataegic events genome-wide that include smaller clustered events (panel c) and only larger kataegic events ≥5 mutations per cluster (panel d).

Similar articles

Cited by

References

    1. Green AM, Weitzman MD. The spectrum of APOBEC3 activity: from anti-viral agents to anti-cancer opportunities. DNA Repair (Amst.) 2019;83:102700. - PMC - PubMed
    1. Harris RS, Dudley JP. APOBECs and virus restriction. Virology. 2015;479–480:131–145. - PMC - PubMed
    1. Kohli RM, et al. Local sequence targeting in the AID/APOBEC family differentially impacts retroviral restriction and antibody diversification. J. Biol. Chem. 2010;285:40956–40964. - PMC - PubMed
    1. Wang M, Rada C, Neuberger MS. Altering the spectrum of immunoglobulin V gene somatic hypermutation by modifying the active site of AID. J. Exp. Med. 2010;207:141–153. - PMC - PubMed
    1. Shi K, et al. Structural basis for targeted DNA cytosine deamination and mutagenesis by APOBEC3A and APOBEC3B. Nat. Struct. Mol. Biol. 2017;24:131–139. - PMC - PubMed

Publication types

MeSH terms