. 2023 Oct;3(10):1219-1236.
doi: 10.1038/s43587-023-00491-1. Epub 2023 Sep 21.

The VCAM1-ApoE pathway directs microglial chemotaxis and alleviates Alzheimer's disease pathology

Affiliations

The VCAM1-ApoE pathway directs microglial chemotaxis and alleviates Alzheimer's disease pathology

Shun-Fat Lau et al. Nat Aging. 2023 Oct.

Abstract

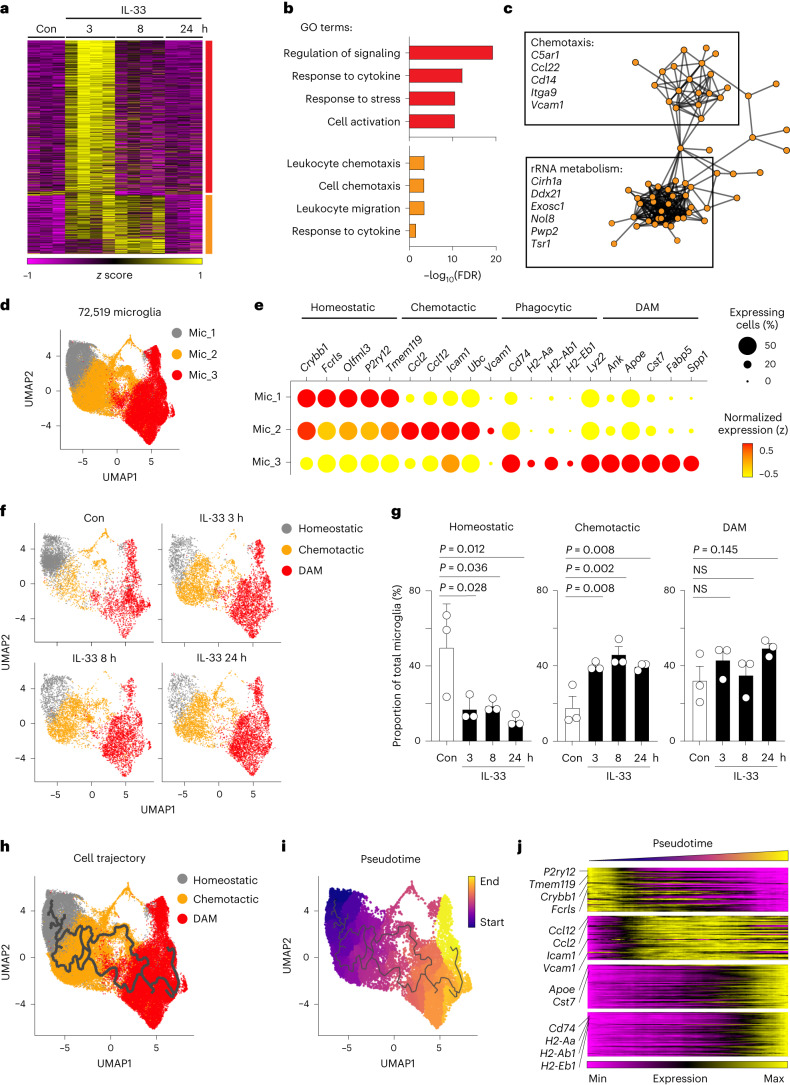
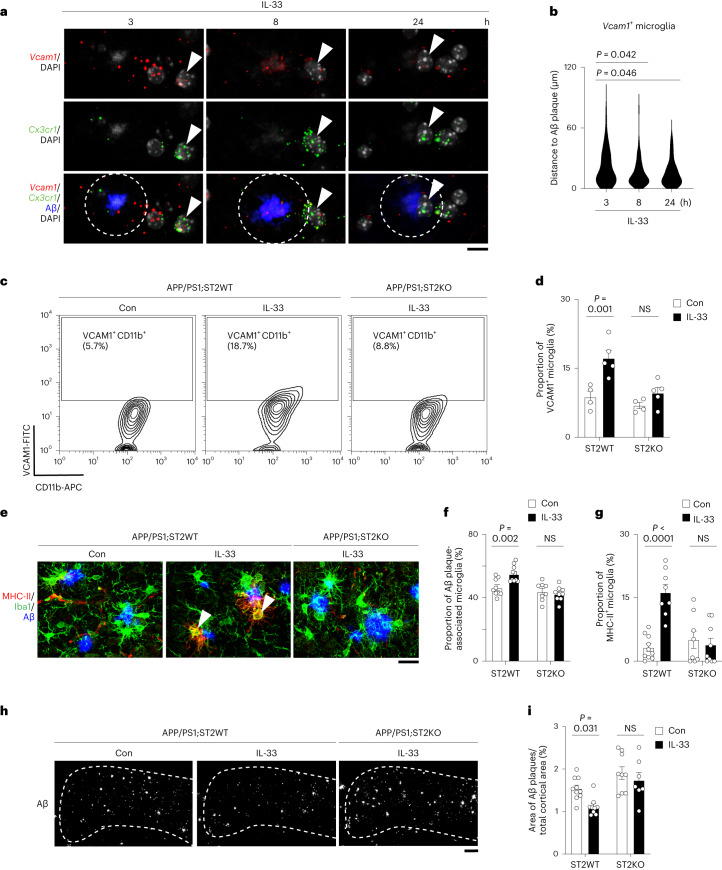
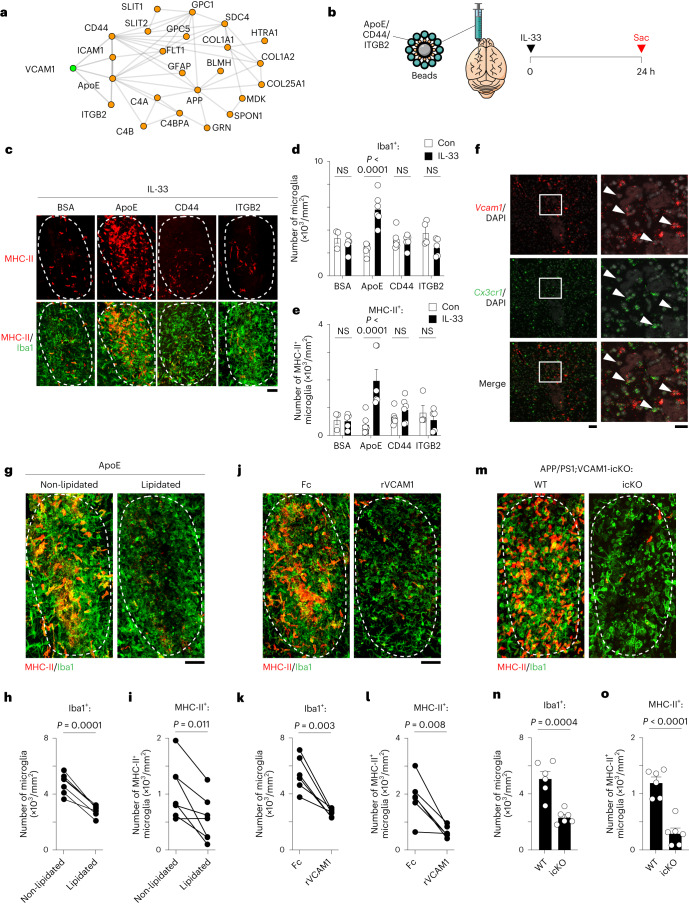
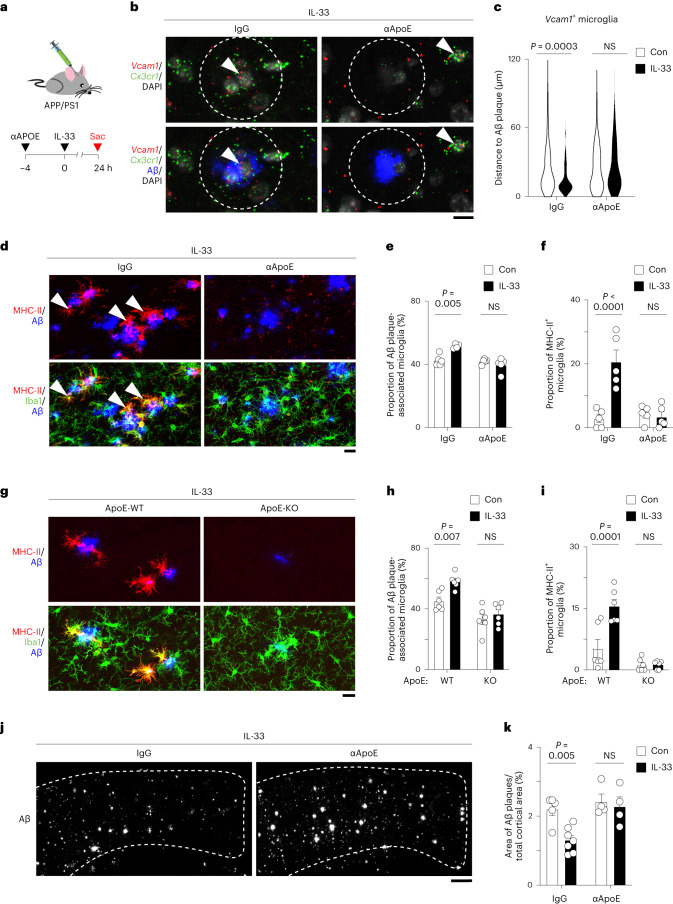
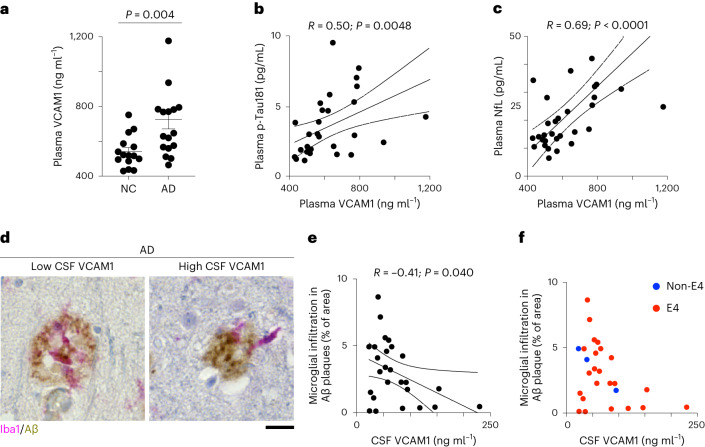
In Alzheimer's disease (AD), sensome receptor dysfunction impairs microglial danger-associated molecular pattern (DAMP) clearance and exacerbates disease pathology. Although extrinsic signals, including interleukin-33 (IL-33), can restore microglial DAMP clearance, it remains largely unclear how the sensome receptor is regulated and interacts with DAMP during phagocytic clearance. Here, we show that IL-33 induces VCAM1 in microglia, which promotes microglial chemotaxis toward amyloid-beta (Aβ) plaque-associated ApoE, and leads to Aβ clearance. We show that IL-33 stimulates a chemotactic state in microglia, characterized by Aβ-directed migration. Functional screening identified that VCAM1 directs microglial Aβ chemotaxis by sensing Aβ plaque-associated ApoE. Moreover, we found that disrupting VCAM1-ApoE interaction abolishes microglial Aβ chemotaxis, resulting in decreased microglial clearance of Aβ. In patients with AD, higher cerebrospinal fluid levels of soluble VCAM1 were correlated with impaired microglial Aβ chemotaxis. Together, our findings demonstrate that promoting VCAM1-ApoE-dependent microglial functions ameliorates AD pathology.


Conflict of interest statement

Y.J., A.K.F. and N.Y.I. are inventors on a patent licensed by The Hong Kong University of Science and Technology to Cognitact, and Y.J. co-founded Cognitact. D.M.H. is an inventor on a patent licensed by Washington University to C2N Diagnostics on the therapeutic use of anti-tau antibodies and on a patent licensed to NextCure on the therapeutic use of anti-ApoE antibodies. D.M.H. co-founded and is on the scientific advisory board of C2N Diagnostics. D.M.H. is also on the scientific advisory boards of Denali, Genentech and Cajal Neuroscience and consults for Alector. The remaining authors declare no competing interests.

Figures

Fig. 1
Fig. 1. IL-33-responsive microglia undergo stepwise transcriptomic reprogramming.
ac, IL-33 induces prolonged expression of the microglial chemotactic gene signature. a, Heatmap showing the expression levels of 1,433 IL-33-induced genes in microglia 3, 8 and 24 h after IL-33 treatment (adjusted P value < 0.05). The bar on the far right indicates genes showing transient activation (red) and prolonged activation (orange). b, Bar plot showing the top GO pathways associated with the genes showing transient (red) and prolonged (orange) activation (as in panel a). FDR, false discovery rate. c, Protein–protein interaction analysis of genes exhibiting prolonged activation. dg, IL-33 regulates microglial heterogeneity in a sequential manner. d, Uniform Manifold Approximation and Projection (UMAP) plot of three microglial subtypes showing unbiased clustering of 72,519 microglia from APP/PS1 mice treated with IL-33 or control for 3, 8, or 24 h (each condition corresponds to 3 biological independent samples). e, Dot plot showing the expression levels of the top signature genes of the 3 microglial subtypes. f,g, UMAP plots (f) and bar plots (g) showing the proportions of homeostatic, chemotactic and DAM in the four conditions (n = 3 mice in each condition; one-way ANOVA with Dunnett’s multiple comparisons test). Con, control. h–j, The developmental lineage of IL-33RM involves the sequential homeostatic–chemotactic–phagocytic state transition. UMAP plots showing the cell trajectory (h) and pseudotime ordering (i) of the IL-33RM developmental lineage. j, Heatmap visualizing the smoothed expression levels of the top homeostatic, chemotactic, DAM, and phagocytic signature genes (as described in the text) along the IL-33RM developmental lineage. All data are mean ± standard error of the mean (s.e.m.). Source data
Fig. 2
Fig. 2. ST2-dependent induction of chemotactic microglia is required for Aβ clearance upon IL-33 treatment.
a,b, Chemotactic microglia migrate toward Aβ plaques after IL-33 treatment. Representative images (a) and violin plot (b) showing the distance between chemotactic microglia (that is, Vcam1+ Cx3cr1+ cells) and the nearest Aβ plaque 3, 8 and 24 h after IL-33 treatment (3 h: n = 83 microglia from four mice; 8 h: n = 92 microglia from four mice; 24 h: n = 89 microglia from four mice; Kruskal–Wallis test with Dunn’s multiple comparisons test). Dotted circle indicates 10 μm from the perimeter of the Aβ plaque. Arrowheads indicate Vcam1-expressing microglia. Scale bar = 10 μm. c,d, Genetic ablation of ST2 inhibits the microglial chemotactic state 3 h after IL-33 treatment. Representative contour plots (c) and bar plot (d) showing the proportions of chemotactic microglia in each group (Con APP/PS1;ST2WT mice: n = 4; IL-33–treated APP/PS1;ST2WT mice: n = 5; Con APP/PS1;ST2KO mice: n = 4; IL-33–treated APP/PS1 mice; ST2KO: n = 5; two-way ANOVA with Šidák’s multiple comparisons test). eg, Genetic ablation of ST2 inhibits the induction of MHC-II+ phagocytic microglia 24 h after IL-33 treatment. Representative images (e) and bar plots showing the proportions of Aβ plaque-associated microglia (f) and phagocytic microglia (g) in each group (Con APP/PS1;ST2WT mice: n = 9 for panel f and n = 10 for panel g; IL-33-treated APP/PS1;ST2WT mice: n = 10 for panel f and n = 8 for panel g; Con APP/PS1;ST2KO mice: n = 8; IL-33-treated APP/PS1;ST2KO mice: n = 9; two-way ANOVA with Šidák’s multiple comparisons test). Arrowheads indicate phagocytic microglia. Scale bar = 20 μm. h,i, Genetic ablation of ST2 attenuates Aβ clearance induced by IL-33 48 h treatment. Representative images (h) and bar plot (i) showing the Aβ plaque area in the cortex 48 h after IL-33 treatment in each group (Con APP/PS1;ST2WT mice: n = 10; IL-33-treated APP/PS1;ST2WT mice: n = 9; Con APP/PS1;ST2KO mice: n = 9; IL-33–treated APP/PS1;ST2KO mice: n = 7; two-way ANOVA with Šidák’s multiple comparisons test). Scale bar = 200 μm. All data are mean ± s.e.m. Source data
Fig. 3
Fig. 3. VCAM1 controls the Aβ chemotaxis of chemotactic microglia and subsequent Aβ clearance upon IL-33 treatment.
a–f, VCAM1 blockade inhibits the IL-33-induced Aβ chemotaxis of microglia. a, Schematic diagram showing the protocol for neutralizing antibody administration before IL-33 treatment in APP/PS1 mice. b,c, Representative images (b) and violin plot (c) showing the distances between chemotactic microglia and the nearest Aβ plaque 24 h after administration of a VCAM1-neutralizing antibody in IL-33-treated APP/PS1 mice (IgG Con: n = 61 microglia from 5 mice; IgG IL-33: n = 131 microglia from 5 mice; αVCAM1 Con: n = 48 microglia from 5 mice; αVCAM1 IL-33: n = 109 microglia from 5 mice; Kruskal–Wallis test with Dunn’s multiple comparisons test). Dotted circle indicates 10 μm from the perimeter of the Aβ plaque. Arrowheads indicate Vcam1-expressing microglia. Scale bar = 10 μm. d–f, Representative images (d) and bar plots showing the proportions of Aβ plaque-associated microglia (e) and phagocytic microglia (f) 24 h after administration of antibody against VCAM1 in IL-33-treated APP/PS1 mice (IgG Con: n = 9; IgG IL-33: n = 8 for panel e and n = 7 for panel f; αVCAM1 IL-33: n = 9 for panel e and n = 8 for panel f; one-way ANOVA with Dunnett’s multiple comparisons test). Scale bar = 20 μm. g–k, Genetic ablation of VCAM1 in microglia inhibits the Aβ chemotaxis of microglia and microglia-mediated Aβ clearance upon IL-33 treatment. g, Schematic diagram showing the protocol for tamoxifen and IL-33 administration in APP/PS1;VCAM1-icKO mice. h,i, Representative images (h) and bar plot (i) showing the proportions of phagocytic microglia 24 h after IL-33 treatment in APP/PS1;VCAM1-icKO mice (wild-type (WT) Con: n = 11; WT IL-33: n = 12; icKO Con: n = 11; icKO IL-33: n = 13; two-way ANOVA with Šidák’s multiple comparisons test). Scale bar = 20 μm. j,k, Representative images (j) and bar plot (k) showing the Aβ plaque areas in the cortex 48 h after IL-33 treatment in APP/PS1-icKO mice (WT Con: n = 7; WT IL-33: n = 12; icKO Con: n = 11; icKO IL-33: n = 12; two-way ANOVA with Šidák’s multiple comparisons test). Scale bar = 200 μm. All data are mean ± s.e.m. Source data
Fig. 4
Fig. 4. ApoE is a chemoattractant that directs VCAM1-dependent chemotaxis of microglia.
a, STRINGdb protein–protein interaction between VCAM1 (green) and Aβ plaque-associated proteins (orange). b, Schematic diagram showing the protocol for injecting protein-coated beads followed by IL-33 treatment in APP/PS1 mice. c–e, Representative images (c) and bar plots showing the numbers of microglia (d) and MHC-II+ microglia (e) within the area of BSA-, ApoE-, CD44-, and ITGB2-coated beads after IL-33 treatment (Con: BSA: n = 3, ApoE: n = 6, CD44: n = 6, ITGB2: n = 4; IL-33: BSA: n = 5, ApoE: n = 6, CD44: n = 6, ITGB2: n = 5; two-way ANOVA with Šidák’s multiple comparisons test). Dotted line indicates bead area. Scale bar = 20 μm. f, Representative images showing the Vcam1-expressing microglia surrounding ApoE-coated beads after IL-33 treatment. Arrowheads indicate Vcam1-expressing microglia. Scale bars = 50 μm (left) and 20 μm (right). Experiment was repeated for three batches with similar results. g–i, Representative images (g) and bar plots showing the numbers of microglia (h) and MHC-II+ microglia (i) within the areas of beads coated with nonlipidated or lipidated ApoE in IL-33-treated APP/PS1 mice (nonlipidated: n = 7; lipidated: n = 7; two-tailed paired t-test). Dotted line indicates bead area. Scale bar = 20 μm. j–o, VCAM1 is essential for the ApoE chemotaxis of microglia after IL-33 treatment. j–l, Representative images (j) and bar plots showing the numbers of microglia (k) and MHC-II+ microglia (l) within the ApoE-coated bead areas after co-injection of rVCAM1 in IL-33-treated APP/PS1 mice (Fc: n = 6; rVCAM1: n = 6; two-tailed paired t-test). Dotted line indicates bead area. Scale bar = 20 μm. mo, Representative images (m) and bar plots showing the numbers of microglia (n) and MHC-II+ microglia (o) within the ApoE-coated bead areas in IL-33-treated APP/PS1;VCAM1-icKO mice (wild-type [WT]: n = 6; icKO: n = 6; two-tailed unpaired t-test). Dotted line indicates bead area. Scale bar = 20 μm. All data are mean ± s.e.m. Source data
Fig. 5
Fig. 5. VCAM1–ApoE interaction is critical for the Aβ chemotaxis of microglia and microglia-mediated Aβ clearance after IL-33 treatment.
a–c, ApoE-neutralizing antibody inhibits the Aβ chemotaxis of microglia upon IL-33 treatment. a, Schematic diagram showing the protocol for ApoE-neutralizing antibody administration before IL-33 treatment in APP/PS1 mice. b,c, Representative images (b) and violin plot (c) showing the distance between chemotactic microglia (that is, Vcam1+ Cx3cr1+ cells) and the nearest Aβ plaque 24 h after administration of ApoE-neutralizing antibody in IL-33-treated APP/PS1 mice (IgG Con: n = 107 microglia from 6 mice; IgG IL-33: n = 115 microglia from 5 mice; αApoE Con: n = 94 microglia from 6 mice; αApoE IL-33: n = 93 microglia from 6 mice; Kruskal–Wallis test with Dunn’s multiple comparisons test). Dotted circle indicates 10 μm from the perimeter of the Aβ plaque. Arrowheads indicate Vcam1-expressing microglia. Scale bar = 10 μm. di, VCAM1–ApoE interaction is required for inducing the phagocytic state transition of microglia after the induction of VCAM1 expression. df, Representative images (d) and bar plots showing the proportions of Aβ plaque-associated microglia (e) and phagocytic microglia (f) (that is, MHC-II+ Iba1+ cells) 24 h after administration of ApoE-neutralizing antibody in IL-33-treated APP/PS1 mice (IgG Con: n = 5; IgG IL-33: n = 5; αApoE Con: n = 5; αApoE IL-33: n = 5; two-way ANOVA with Šidák’s multiple comparisons test). Arrowheads indicate phagocytic microglia. Scale bar = 20 μm. gi, Representative images (g) and bar plots showing the proportions of Aβ plaque-associated microglia (h) and phagocytic microglia (i) (that is, MHC-II+ Iba1+ cells) 24 h after IL-33 treatment in APP/PS1-ApoE–knockout mice (n = 6 per condition; two-way ANOVA with Šidák’s multiple comparisons test). Scale bar = 20 μm. j,k, Representative images (j) and bar plot (k) showing the Aβ plaque areas in the cortex 48 h after administration of ApoE-neutralizing antibody in IL-33-treated APP/PS1 mice (IgG Con: n = 5; IgG IL-33: n = 7; αApoE Con: n = 4; αApoE IL-33: n = 4; two-way ANOVA with Šidák’s multiple comparisons test). Scale bar = 200 μm. All data are mean ± s.e.m. Source data
Fig. 6
Fig. 6. Dysregulated VCAM1 signaling is associated with impaired microglial infiltration into Aβ plaques in patients with AD.
a–c, Soluble VCAM1 (sVCAM1) level is elevated in the plasma of patients with AD and correlated with disease severity. a, sVCAM1 levels in the plasma of normal controls (NCs) and patients with AD (NC: n = 15; AD: n = 17; two-tailed Mann–Whitney test). b,c, Correlations between plasma levels of sVCAM1 and plasma p-Tau181 (b) (tau phosphorylated at threonine-181) and plasma NfL (c) (neurofilament light polypeptide) (n = 30 for panel b, n = 31 for panel c; linear regression). Dotted line indicates the 95% confidence interval of the regression line. df, Cerebrospinal fluid (CSF) sVCAM1 levels are inversely correlated with microglial infiltration into Aβ plaques. Representative images (d) and dot plot (e) showing the correlation between CSF sVCAM1 level and microglial infiltration into Aβ plaques in patients with AD (n = 26, linear regression). Dotted line indicates the 95% confidence interval of the regression line. Scale bar = 20 μm. f, Dot plot showing the correlations between CSF sVCAM1 level and microglial infiltration into Aβ plaques in patients with AD stratified by ApoE4 genotype. All data are mean ± s.e.m. Source data
Extended Data Fig. 1
Extended Data Fig. 1. Chemotactic microglia migrate toward amyloid-beta plaques after interleukin-33 treatment.
a-c, The induction of chemotactic microglia lasts throughout the chemotactic phase. a,b, Representative images (a) and quantification (b) showing the proportion of chemotactic microglia (that is, Vcam1+ Cx3cr1+ cells) after interleukin-33 (IL-33) treatment (3 h Con: n = 4; 3 h IL-33: n = 5; 8 h Con: n = 3; 8 h IL-33: n = 4; 24 h Con: n = 5; 24 h IL-33: n = 4; two-way ANOVA with Šidák’s multiple comparisons test). Arrowheads indicate Vcam1-expressing microglia. Scale bar = 10 μm. c, UMAP plots showing Vcam1 expression across conditions. d, Bar plot quantifying the proportions of chemotactic microglia (that is, Vcam1+ Cx3cr1+ cells) in uninjected and PBS-injected (Con) APP/PS1 mice (n = 4 mice per condition; two-tailed unpaired Student’s t-test). e, UMAP plots showing H2-Ab1 expression across conditions. f,g, Induction of MHC-II+ phagocytic microglia after IL-33 treatment. Representative contour plots (f) and quantification (g) showing the proportions of MHC-II+ phagocytic microglia (that is, MHC-II+ CD11b+ cells) after IL-33 treatment (Con: n = 3 mice; 3 h: n = 3 mice; 8 h: n = 3 mice; 24 h: n = 4 mice; one-way ANOVA with Dunnett’s multiple comparisons test). h,i, Chemotactic microglia gradually express MHC-II after IL-33 treatment. Representative contour plots (h) and quantification (i) showing the proportions of MHC-II–expressing chemotactic microglia (that is, MHC-II + VCAM1 + CD11b+ cells) after IL-33 treatment (3 h: n = 4 mice; 8 h: n = 4 mice; 24 h: n = 4 mice; one-way ANOVA with Dunnett’s multiple comparisons test). All data are mean ± s.e.m. Source data
Extended Data Fig. 2
Extended Data Fig. 2. ST2 genetic ablation inhibits the induction of the chemotactic transcriptomic state in microglia after interleukin-33 treatment.
a, Bar plot showing the distance between chemotactic microglia (that is, Vcam1+ Cx3cr1+ cells) and the nearest amyloid-beta (Aβ) plaque 3, 8, and 24 h after interleukin-33 (IL-33) treatment (n = 4 mice per condition; one-way ANOVA with Dunnett’s multiple comparisons test). b, Venn diagram showing the overlap between 529 differentially expressed genes (DEGs) (IL-33–treated APP;ST2KO vs. IL-33-treated APP;ST2WT mice) and the signature genes of chemotactic microglia (n = 4 per condition). c, Bar plots showing the expression levels of the representative chemotactic signature genes in the 3 conditions (Wald test from DESeq2). d-f, Genetic ablation of ST2 in microglia inhibits the Aβ chemotaxis of microglia and microglia-mediated Aβ clearance upon IL-33 treatment. d, Schematic diagram showing the protocol for tamoxifen and IL-33 administration in APP/PS1;ST2-icKO mice. e,f, Bar plots showing the proportions of Aβ plaque-associated microglia (e) and Aβ levels in cortical regions (f) after IL-33 treatment in APP/PS1;ST2-icKO mice (wild-type [WT] Con: n = 5; WT IL-33: n = 6; icKO Con: n = 6; icKO IL-33: n = 6; two-way ANOVA with Šidák’s multiple comparisons test). g-i, The induction of VCAM1+ chemotactic microglia is a generalized IL-33 response in microglia. g, Bar plot showing the expression level of Vcam1 in microglia 3 h after IL-33 treatment (WT Con: n = 4; WT IL-33: n = 5; APP/PS1 Con: n = 3; APP/PS1 IL-33: n = 3; two-way ANOVA with Šidák’s multiple comparisons test). h,i, Representative images (h) and quantification (i) showing the proportion of chemotactic microglia (that is, Vcam1+ Cx3cr1+ cells) after interleukin-33 (IL-33) treatment in WT mice (n = 3 mice per condition; two-tailed unpaired Student’s t-test). Arrowheads indicate Vcam1-expressing microglia. Scale bar = 10 μm. All data are mean ± s.e.m. Source data
Extended Data Fig. 3
Extended Data Fig. 3. VCAM1 regulates microglial amyloid-beta chemotaxis after interleukin-33 treatment.
a-c, Identification of a potential cell-surface receptor that controls the amyloid-beta (Aβ) chemotaxis of chemotactic microglia. a, Subcellular distribution of the 142 signature genes of chemotactic microglia. b, Gene Ontology (GO) analysis of the 39 chemotactic signature genes localized on the cell surface. FDR, false discovery rate. c, Functional classification of the 7 cell adhesion molecules. d-f, Neutralizing antibodies against ICAM1 and VCAM1 inhibit interleukin-33 (IL-33)–stimulated microglia migration in vitro. d,e, IL-33 promotes the migratory response of BV2 cells in a wound-healing assay (n = 3 from 3 independent batches; two-tailed unpaired Student’s t-test). f, Quantification showing the effects of CCR7-, ICAM1-, and VCAM1-neutralizing antibodies on the IL-33–stimulated migration of BV2 cells in a wound-healing assay (αCCR7 Con: n = 3; αCCR7 IL-33: n = 6; αICAM1 Con: n = 3; αICAM1 IL-33: n = 6; αVCAM1 Con: n = 5; αVCAM1 IL-33: n = 6; two-way ANOVA with Šidák’s multiple comparisons test). g-k, Neutralizing antibodies against CCR7, ICAM1, or isotype controls neither affect Aβ chemotaxis nor the induction of MHC-II+ microglia after IL-33 treatment.g,h, Representative images (g)and quantification (h) showing the proportions of Aβ plaque-associated microglia after administration of isotype control antibodies and IL-33 (IgG2a Con: n = 4; IgG2a IL-33: n = 4; IgG2b Con: n = 4; IgG2b IL-33: n = 4; IgG1 Con: n = 9; IgG1 IL-33: n = 8; two-way ANOVA with Šidák’s multiple comparisons test). i,j, Quantification showing the proportions of Aβ plaque-associated microglia (i) and the proportions of MHC-II+ microglia (j) after administration of neutralizing antibodies and IL-33 (IgG Con: n = 9; IgG IL-33: n = 8 for panel i and 7 for panel j; αCCR7 IL-33: n = 8; αICAM1 IL-33: n = 7; one-way ANOVA with Šidák’s multiple comparisons test). Scale bar = 20 μm. k,l, Long-term genetic ablation of microglial VCAM1 does not affect the survival of mice or the number of microglia. k, Survival curve of VCAM1-icKO mice 1 month after tamoxifen injection (n = 3 per condition). l, Quantification showing the number of microglia in VCAM1-icKO mice (n = 3 per condition; two-tailed unpaired Student’s t-test). m, Genetic ablation of microglial VCAM1 abolishes IL-33–induced Vcam1 expression in microglia (wild-type [WT] Con: n = 3; WT IL-33: n = 3; icKO Con: n = 3; icKO IL-33: n = 3; two-way ANOVA with Šidák’s multiple comparisons test). n, Genetic ablation of microglial VCAM1 inhibits microglial migration toward Aβ plaques after IL-33 treatment. Quantification showing the proportions of Aβ plaque-associated microglia in VCAM1-icKO mice after IL-33 treatment (WT Con: n = 11; WT IL-33: n = 12; icKO Con: n = 11; icKO IL-33: n = 13; two-way ANOVA with Šidák’s multiple comparisons test). All data are mean ± s.e.m. Source data
Extended Data Fig. 4
Extended Data Fig. 4. Chemotactic microglia migrate toward nonlipidated ApoE after interleukin-33 treatment.
a,b, Quality control for bead injection. Representative images (a) and quantification (b) showing the bead injection area (Con: n = 12; interleukin-33 [IL-33]: n = 18, two-tailed unpaired Student’s t-test). Scale bar = 50 μm. c,d, IL-33-induced chemotactic microglia migrate towards human ApoE isoforms. Representative images (c) and bar plot (d) showing microglial migration towards BSA-, murine ApoE (mApoE)-, human ApoE3-, and human ApoE4-coated beads after IL-33 treatment (n = 3 per condition; one-way ANOVA with Šidák’s multiple comparisons test). Dotted line indicates bead area. Scale bar = 25 μm. All data are mean ± s.e.m. Source data
Extended Data Fig. 5
Extended Data Fig. 5. VCAM1+ microglia interact with amyloid-beta plaques in the brains of patients with Alzheimer’s disease.
a,b, Representative images (a) and bar plot (b) showing the proportions of amyloid-beta (Aβ) plaque-associated VCAM1+ microglia in postmortem Alzheimer’s disease brain sections (n = 5 patients with Alzheimer’s disease; two-way ANOVA with Šidák’s multiple comparisons test). Arrowheads indicate the VCAM1+ microglia associated with plaque. Scale bar = 10 μm. All data are mean ± s.e.m. Source data
Extended Data Fig. 6
Extended Data Fig. 6. Validation of the elevated plasma soluble VCAM1 level in patients with Alzheimer’s disease.
a,b, Cross-cohort validation of the elevated plasma soluble VCAM1 (sVCAM1) level found in patients with Alzheimer’s disease (AD). a, Violin plots showing the levels of plasma sVCAM1 in the PWH cohort (obtained from Jiang et al., 2021) (normal controls [NCs]: n = 74; AD: n = 106; two-tailed Mann–Whitney test). b, Correlation between the plasma levels of sVCAM1 and neurofilament light polypeptide (NfL) (linear regression). c-e, Cerebrospinal fluid (CSF) sVCAM1 level is not correlated with sex or APOE4 genotypes in patients with AD. c, Violin plot comparing sVCAM1 levels in CSF and plasma (CSF: n = 35; Plasma: n = 32; two-tailed Mann–Whitney test). d,e, Bar plots showing the effects of APOE4 gene dosage (e) (0: n = 3; 1: n = 14; 2: n = 9; Kruskal–Wallis test with Dunn’s multiple comparisons test) and sex (e) on sVCAM1 level in patients with AD (male: n = 18; female: n = 17; two-tailed Mann–Whitney test). Data are mean ± s.e.m. Source data

Comment in

References

    1. Heneka MT, et al. Neuroinflammation in Alzheimer’s disease. Lancet Neurol. 2015;14:388–405. doi: 10.1016/S1474-4422(15)70016-5. - DOI - PMC - PubMed
    1. Ransohoff RM, Perry VH. Microglial physiology: Unique stimuli, specialized responses. Annu. Rev. Immunol. 2009;27:119–145. doi: 10.1146/annurev.immunol.021908.132528. - DOI - PubMed
    1. Perry VH, Holmes C. Microglial priming in neurodegenerative disease. Nat. Rev. Neurol. 2014;10:217–224. doi: 10.1038/nrneurol.2014.38. - DOI - PubMed
    1. Glass CK, Natoli G. Molecular control of activation and priming in macrophages. Nat. Immunol. 2016;17:26–33. doi: 10.1038/ni.3306. - DOI - PMC - PubMed
    1. De Strooper B, Karran E. The cellular phase of Alzheimer’s disease. Cell. 2016;164:603–615. doi: 10.1016/j.cell.2015.12.056. - DOI - PubMed

Publication types