. 2024 Jul;42(7):1075-1083.
doi: 10.1038/s41587-023-01950-1. Epub 2023 Sep 21.

A DNA nanodevice for mapping sodium at single-organelle resolution

Affiliations

A DNA nanodevice for mapping sodium at single-organelle resolution

Junyi Zou et al. Nat Biotechnol. 2024 Jul.

Abstract

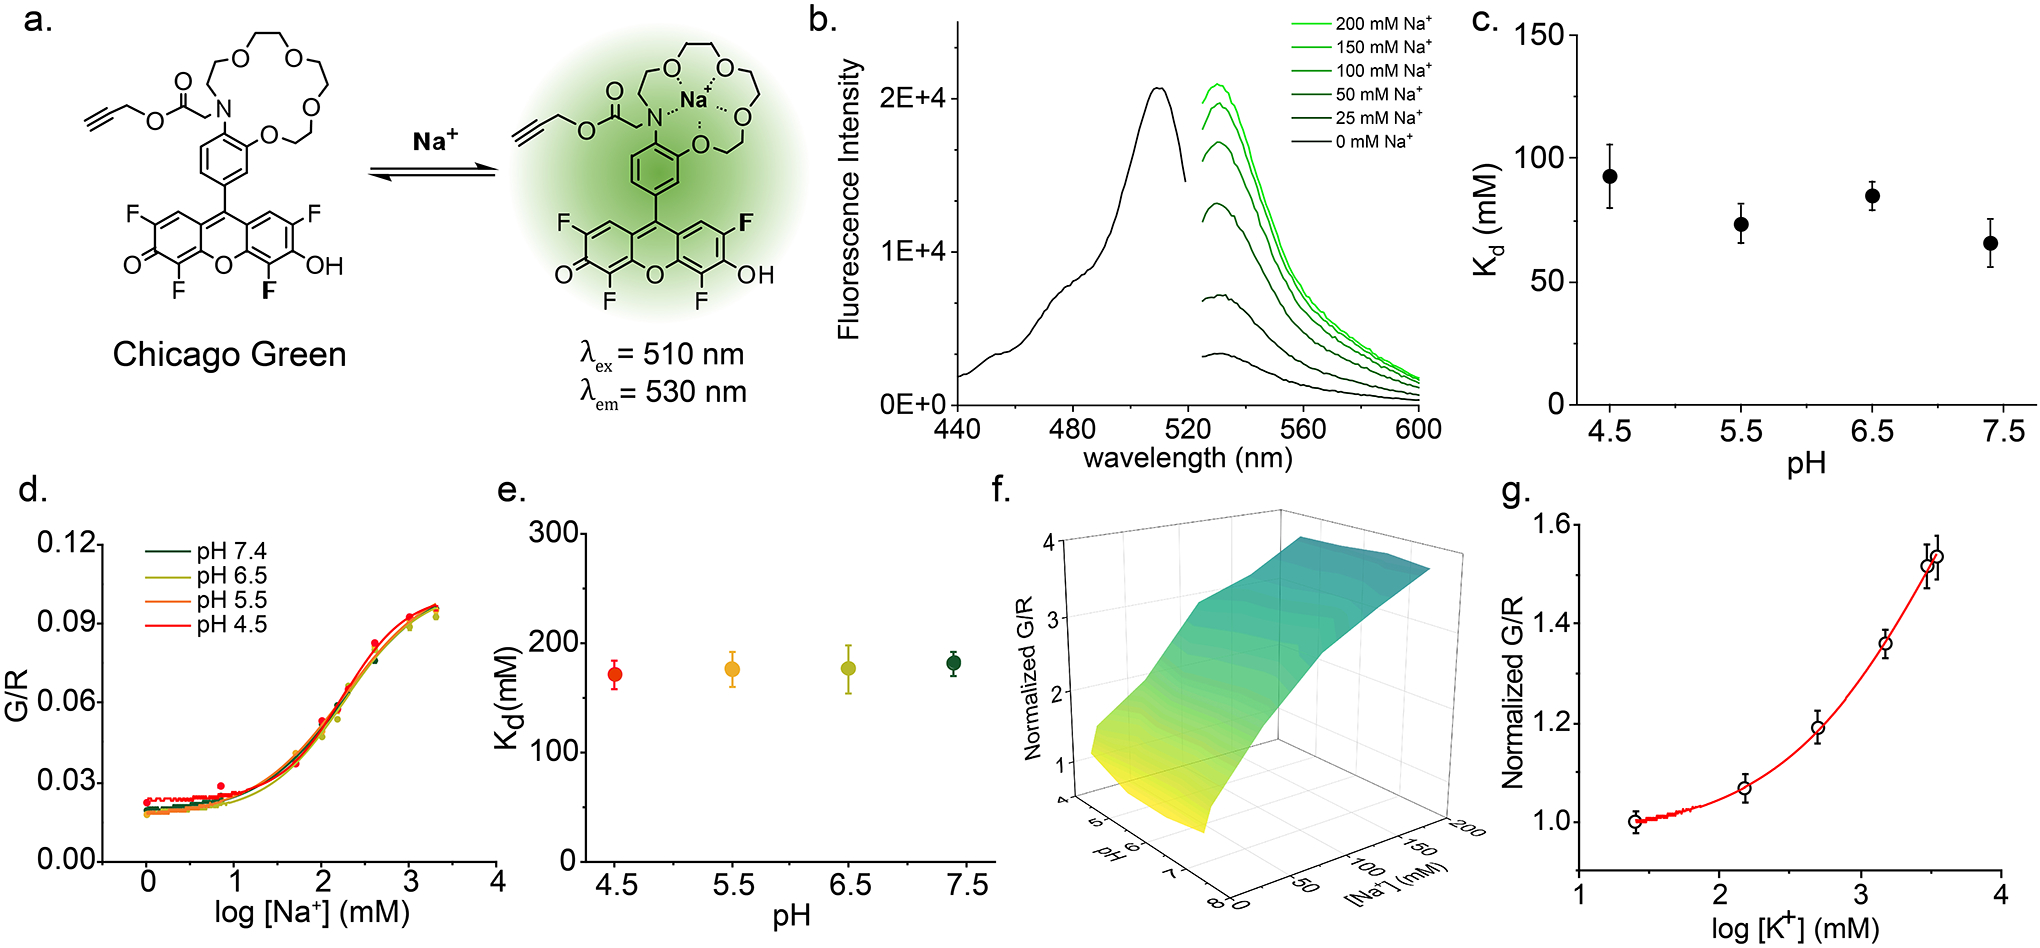
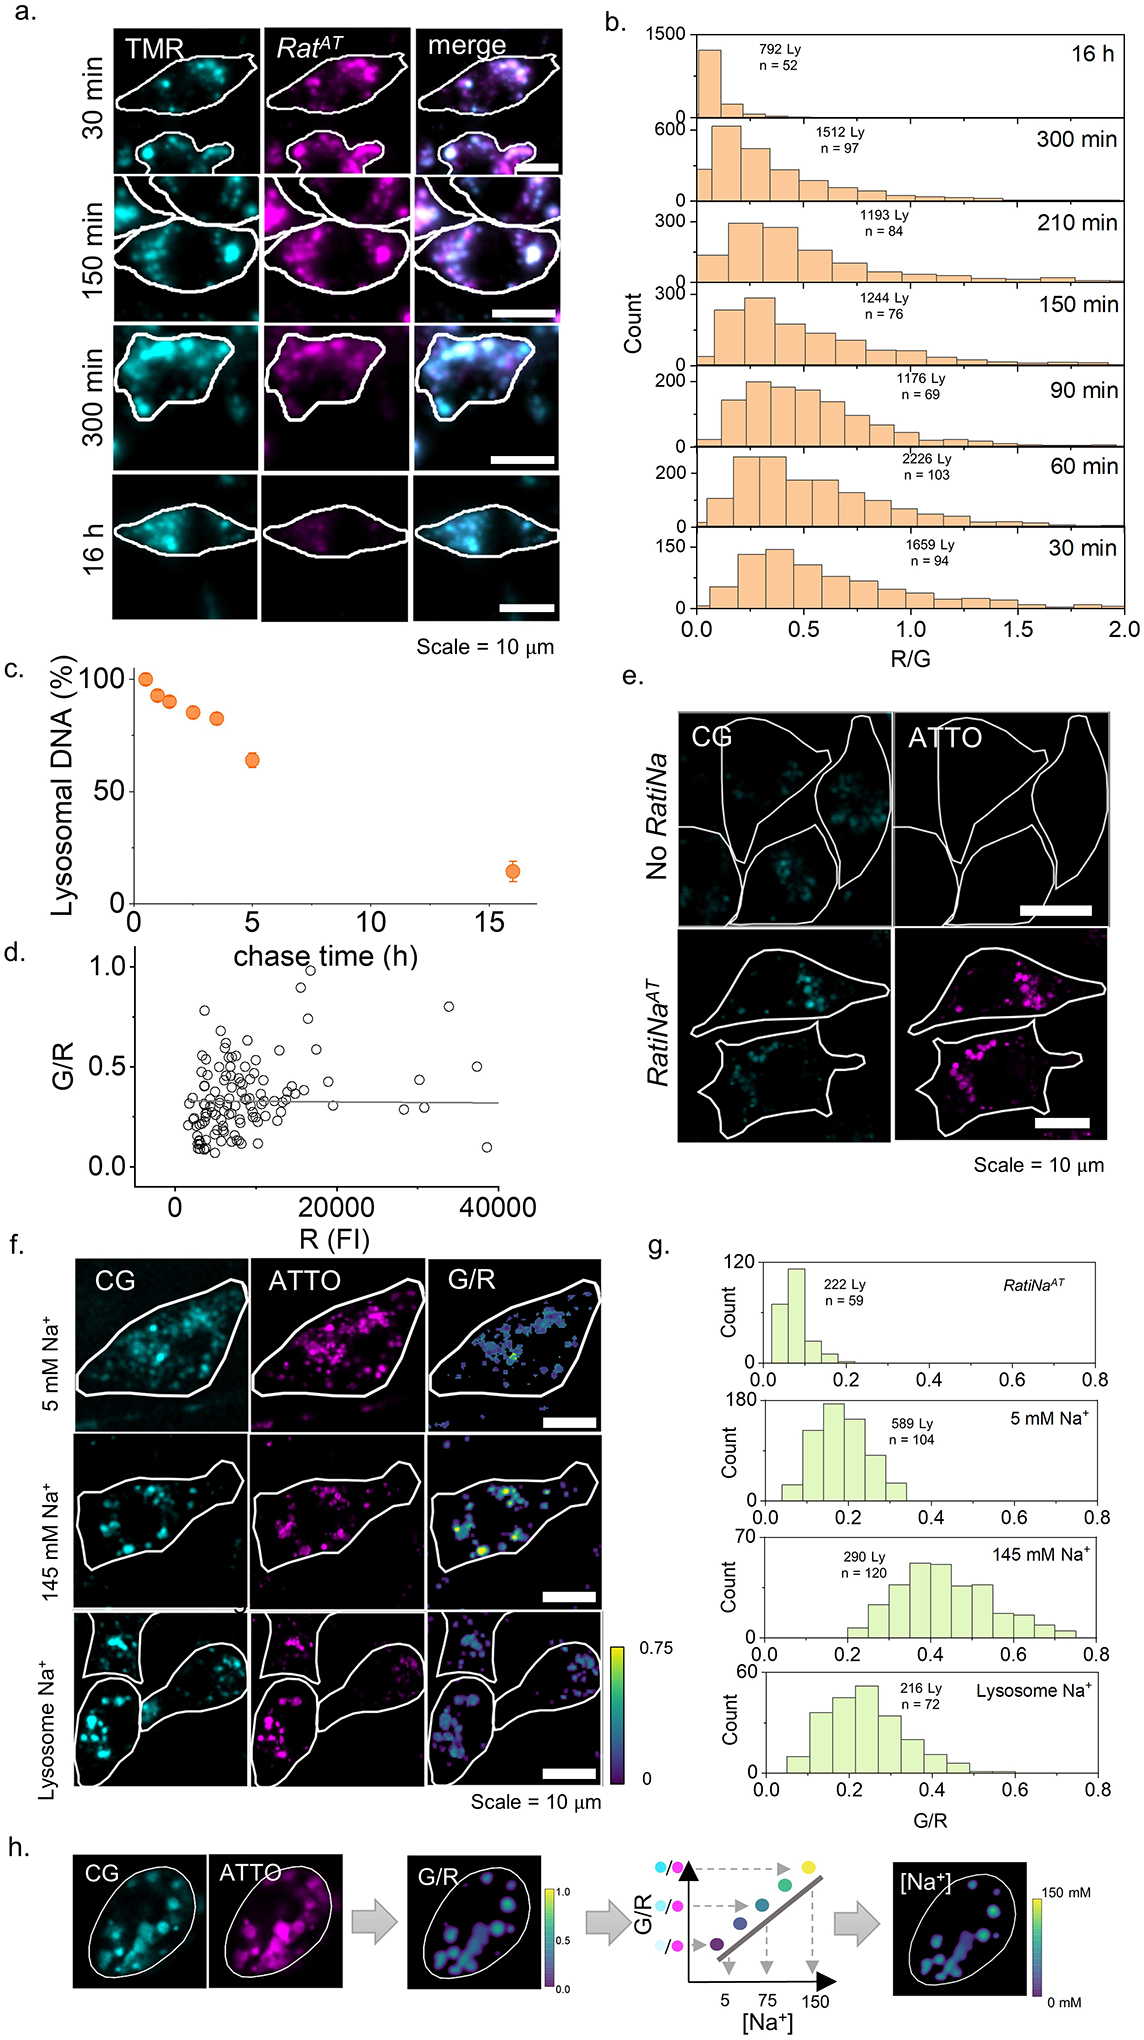
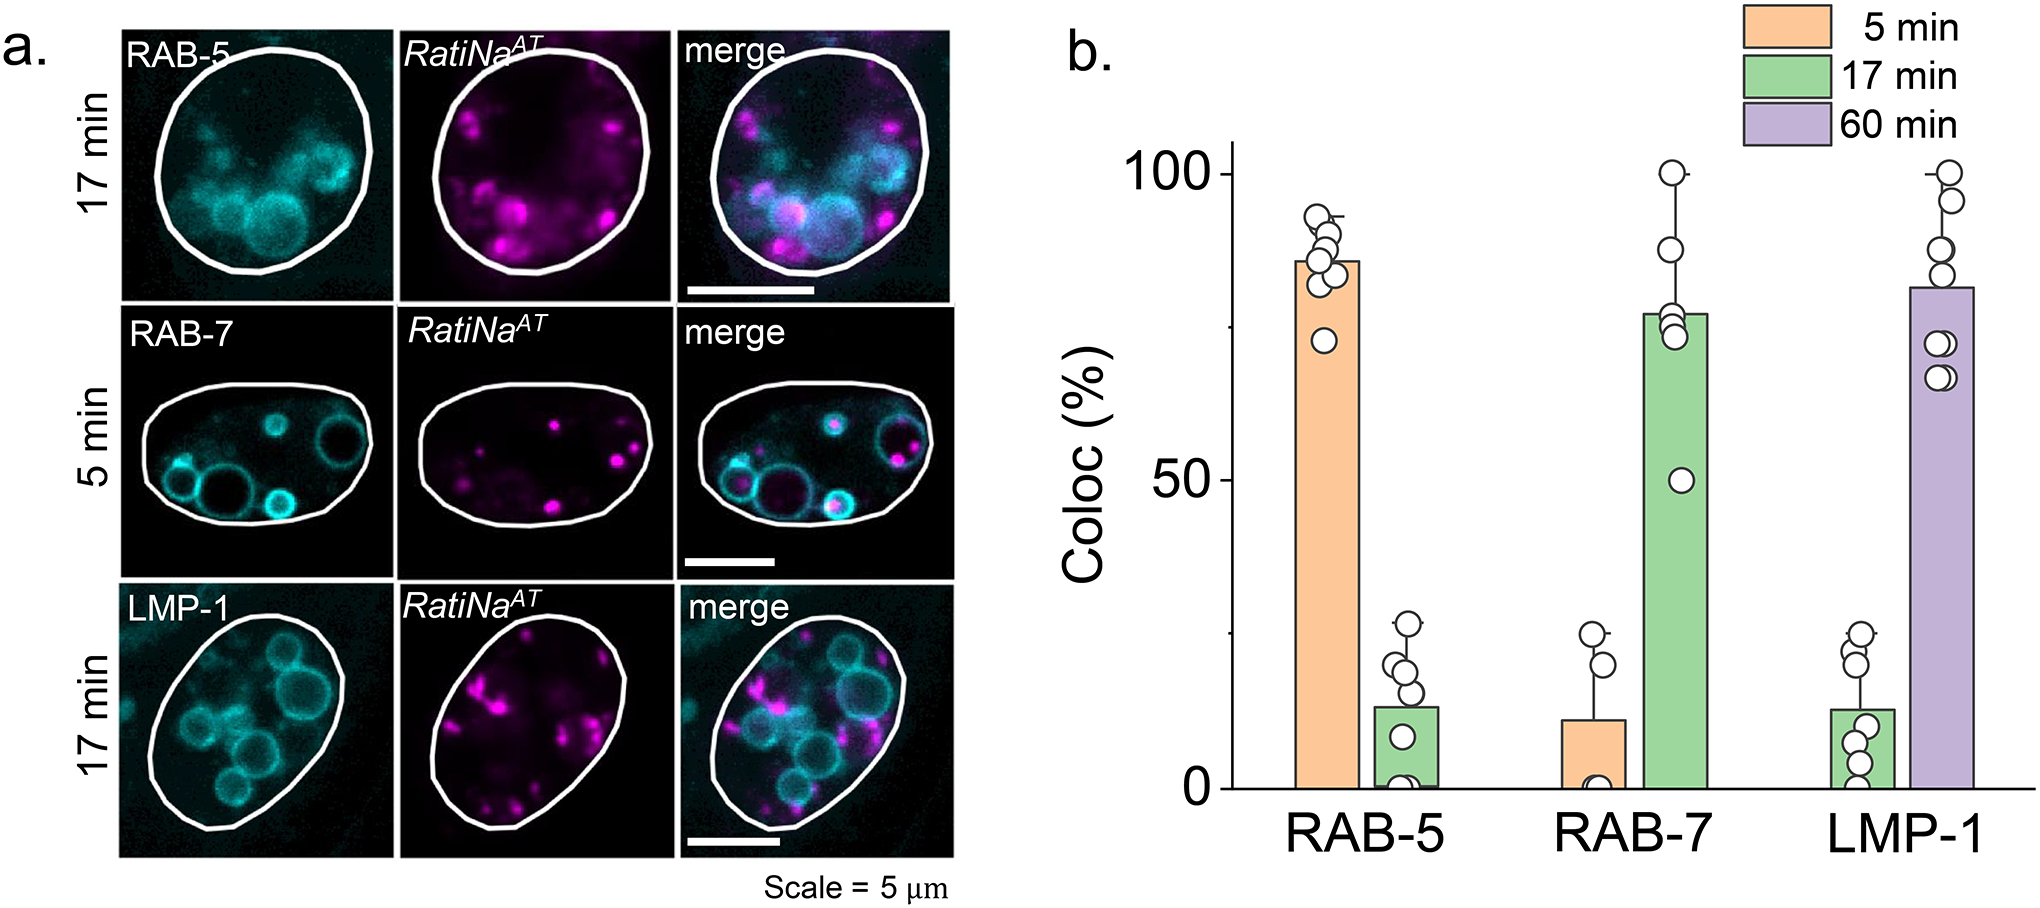
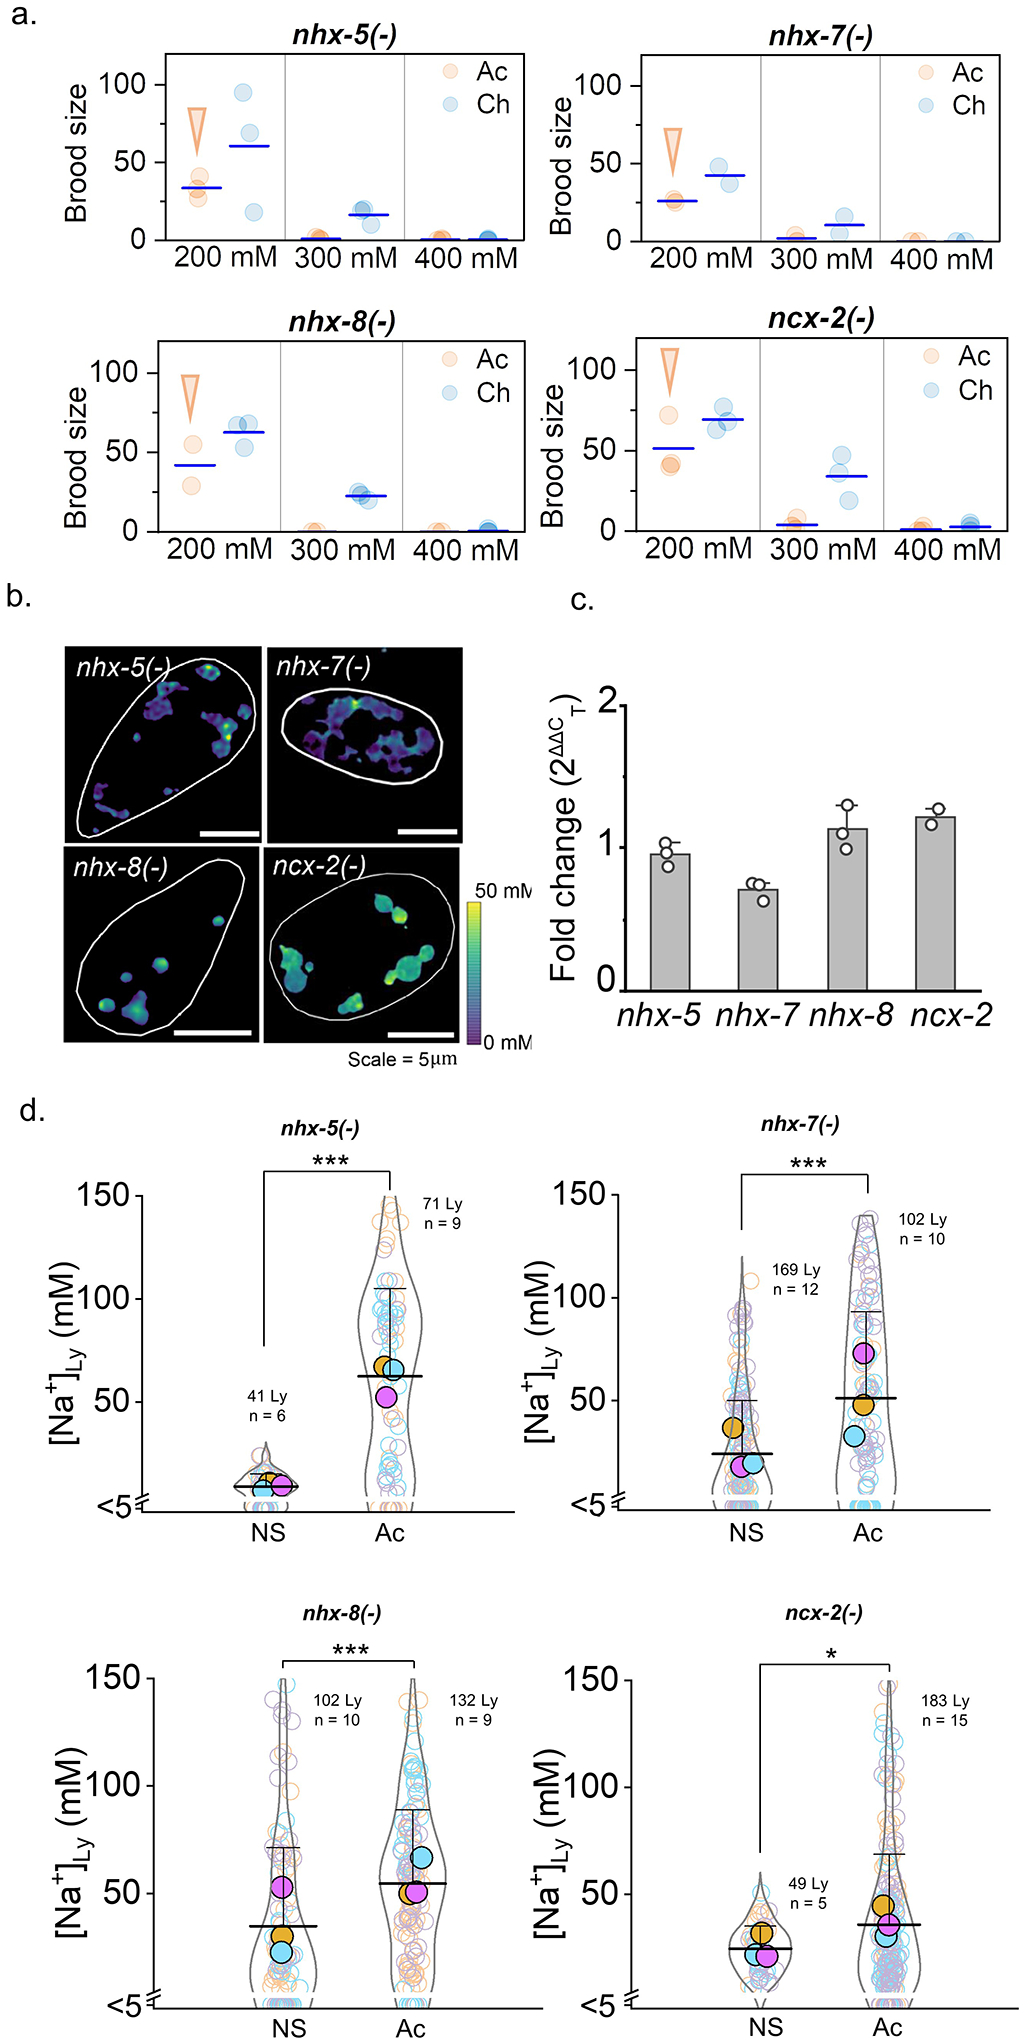
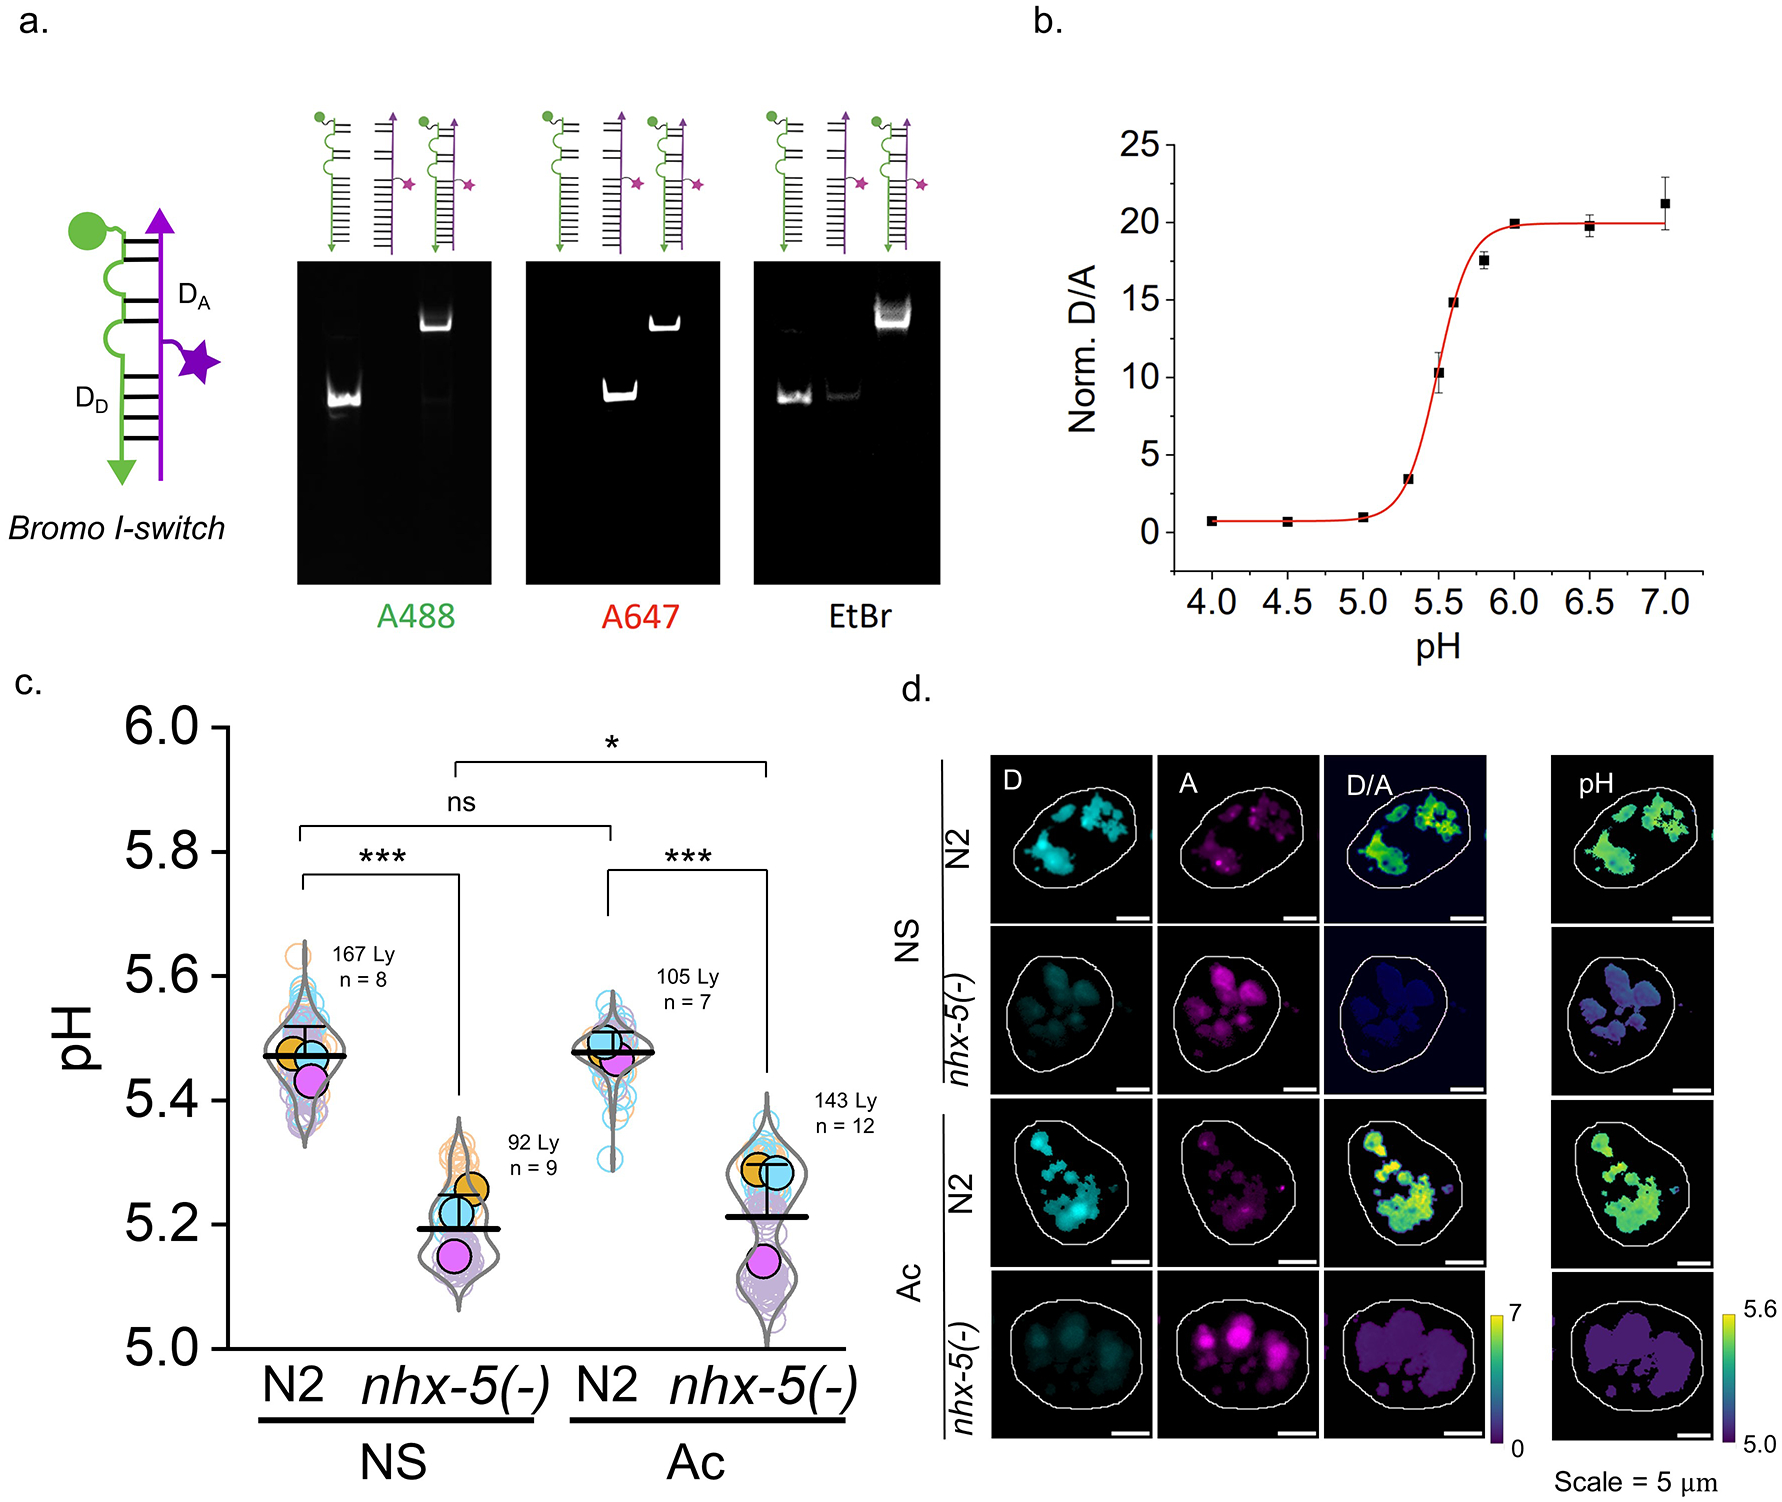
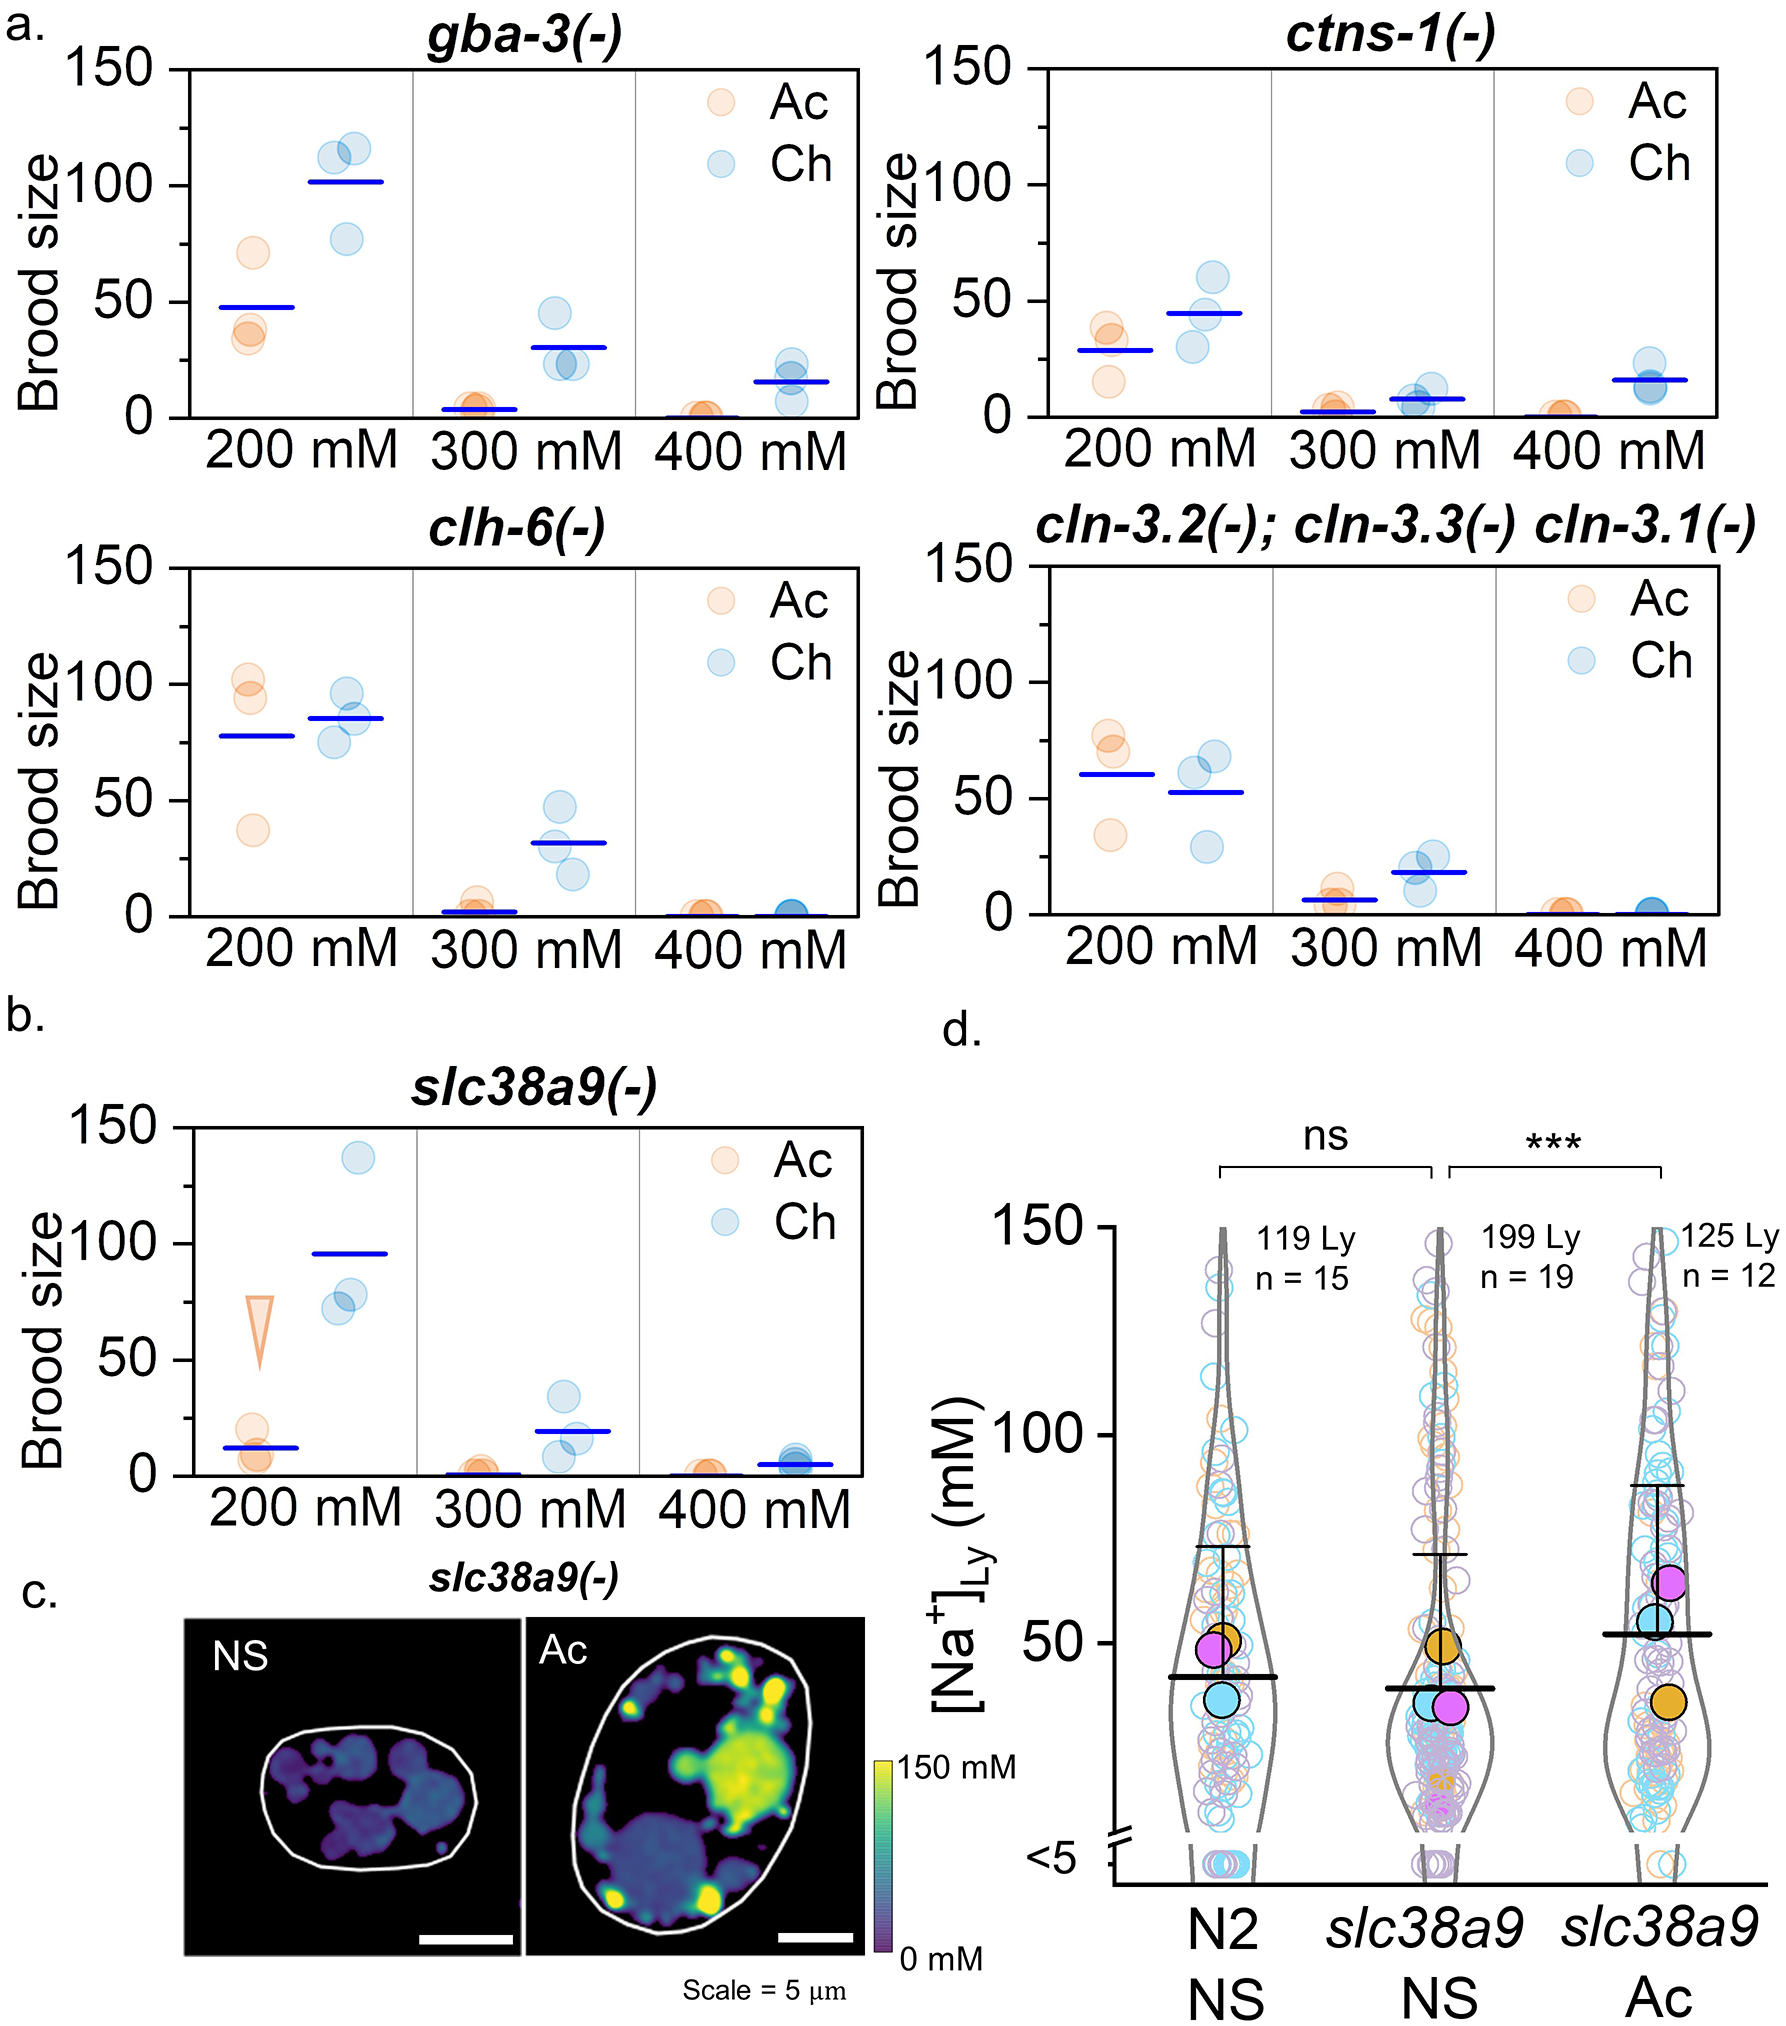
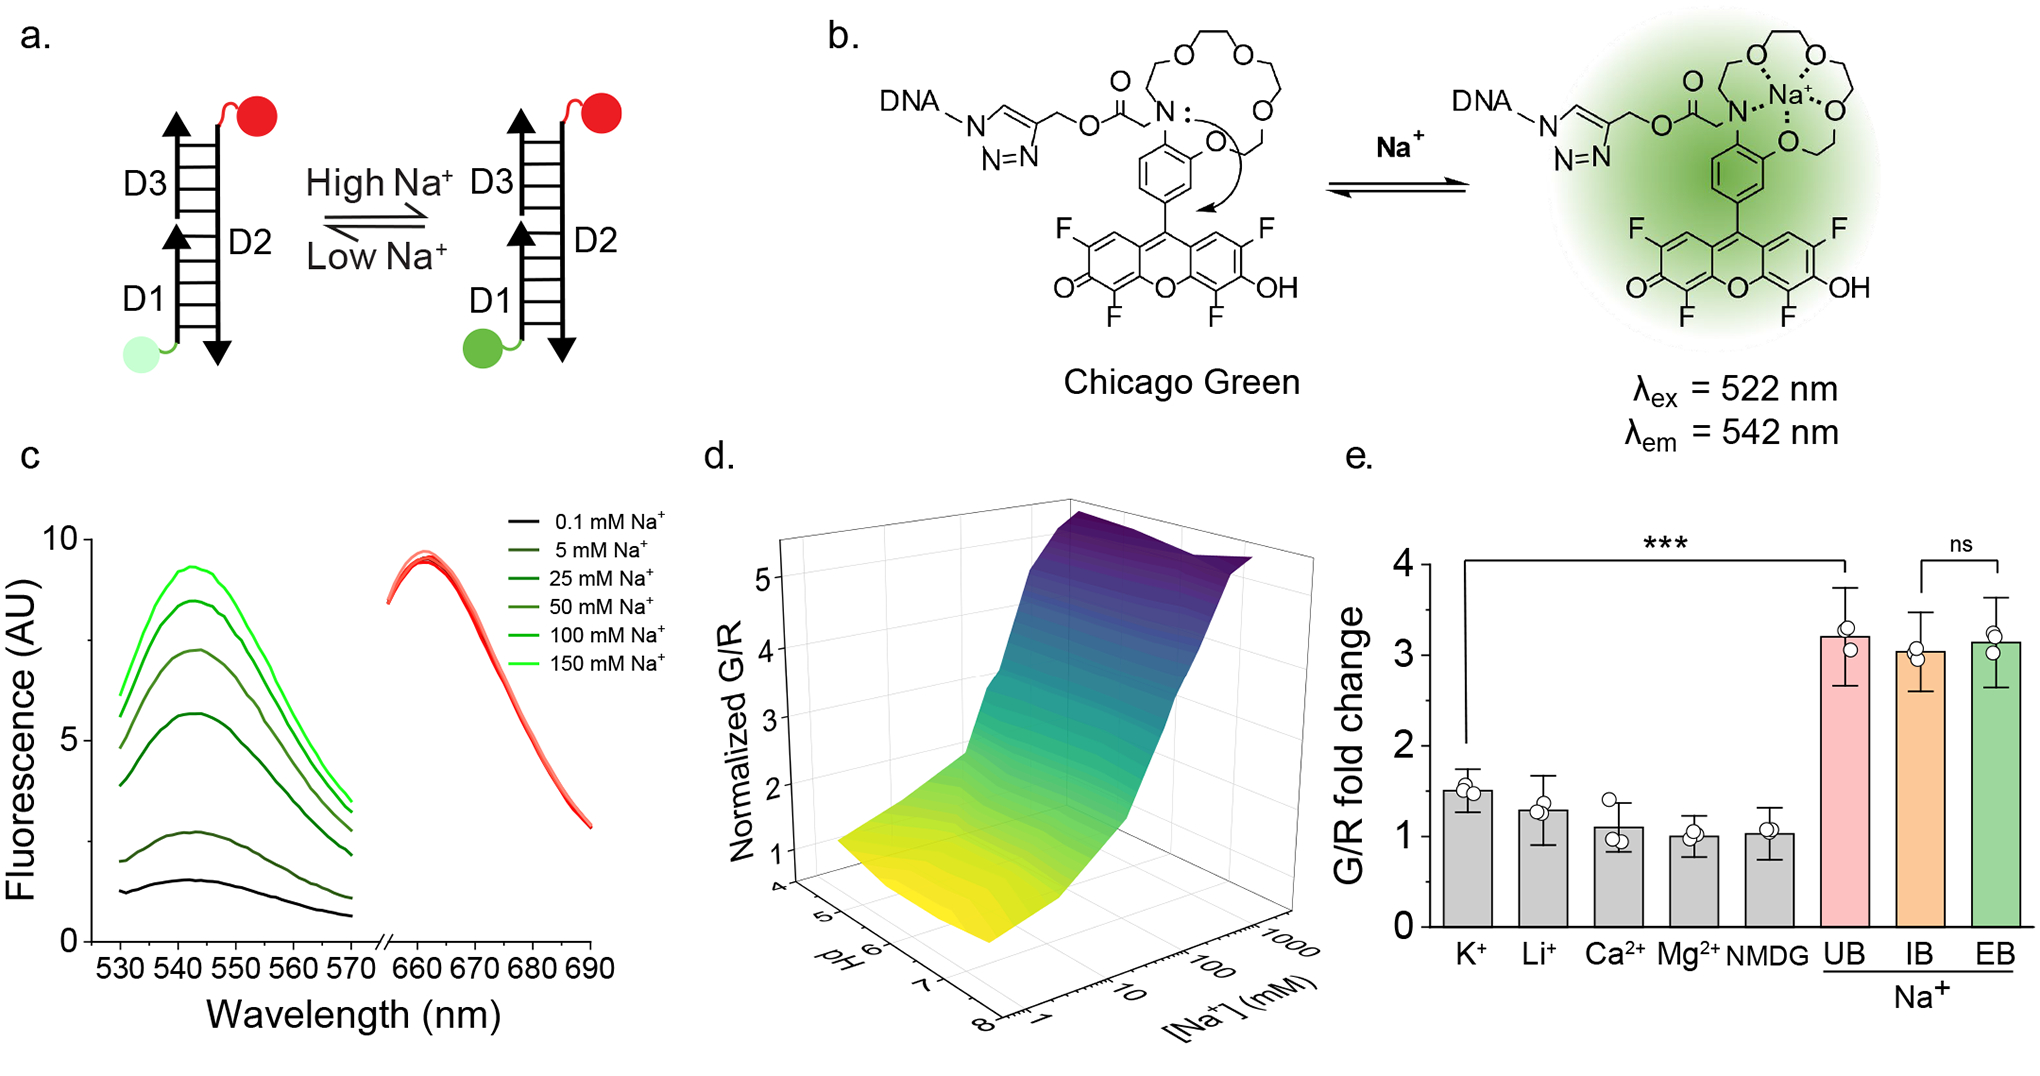
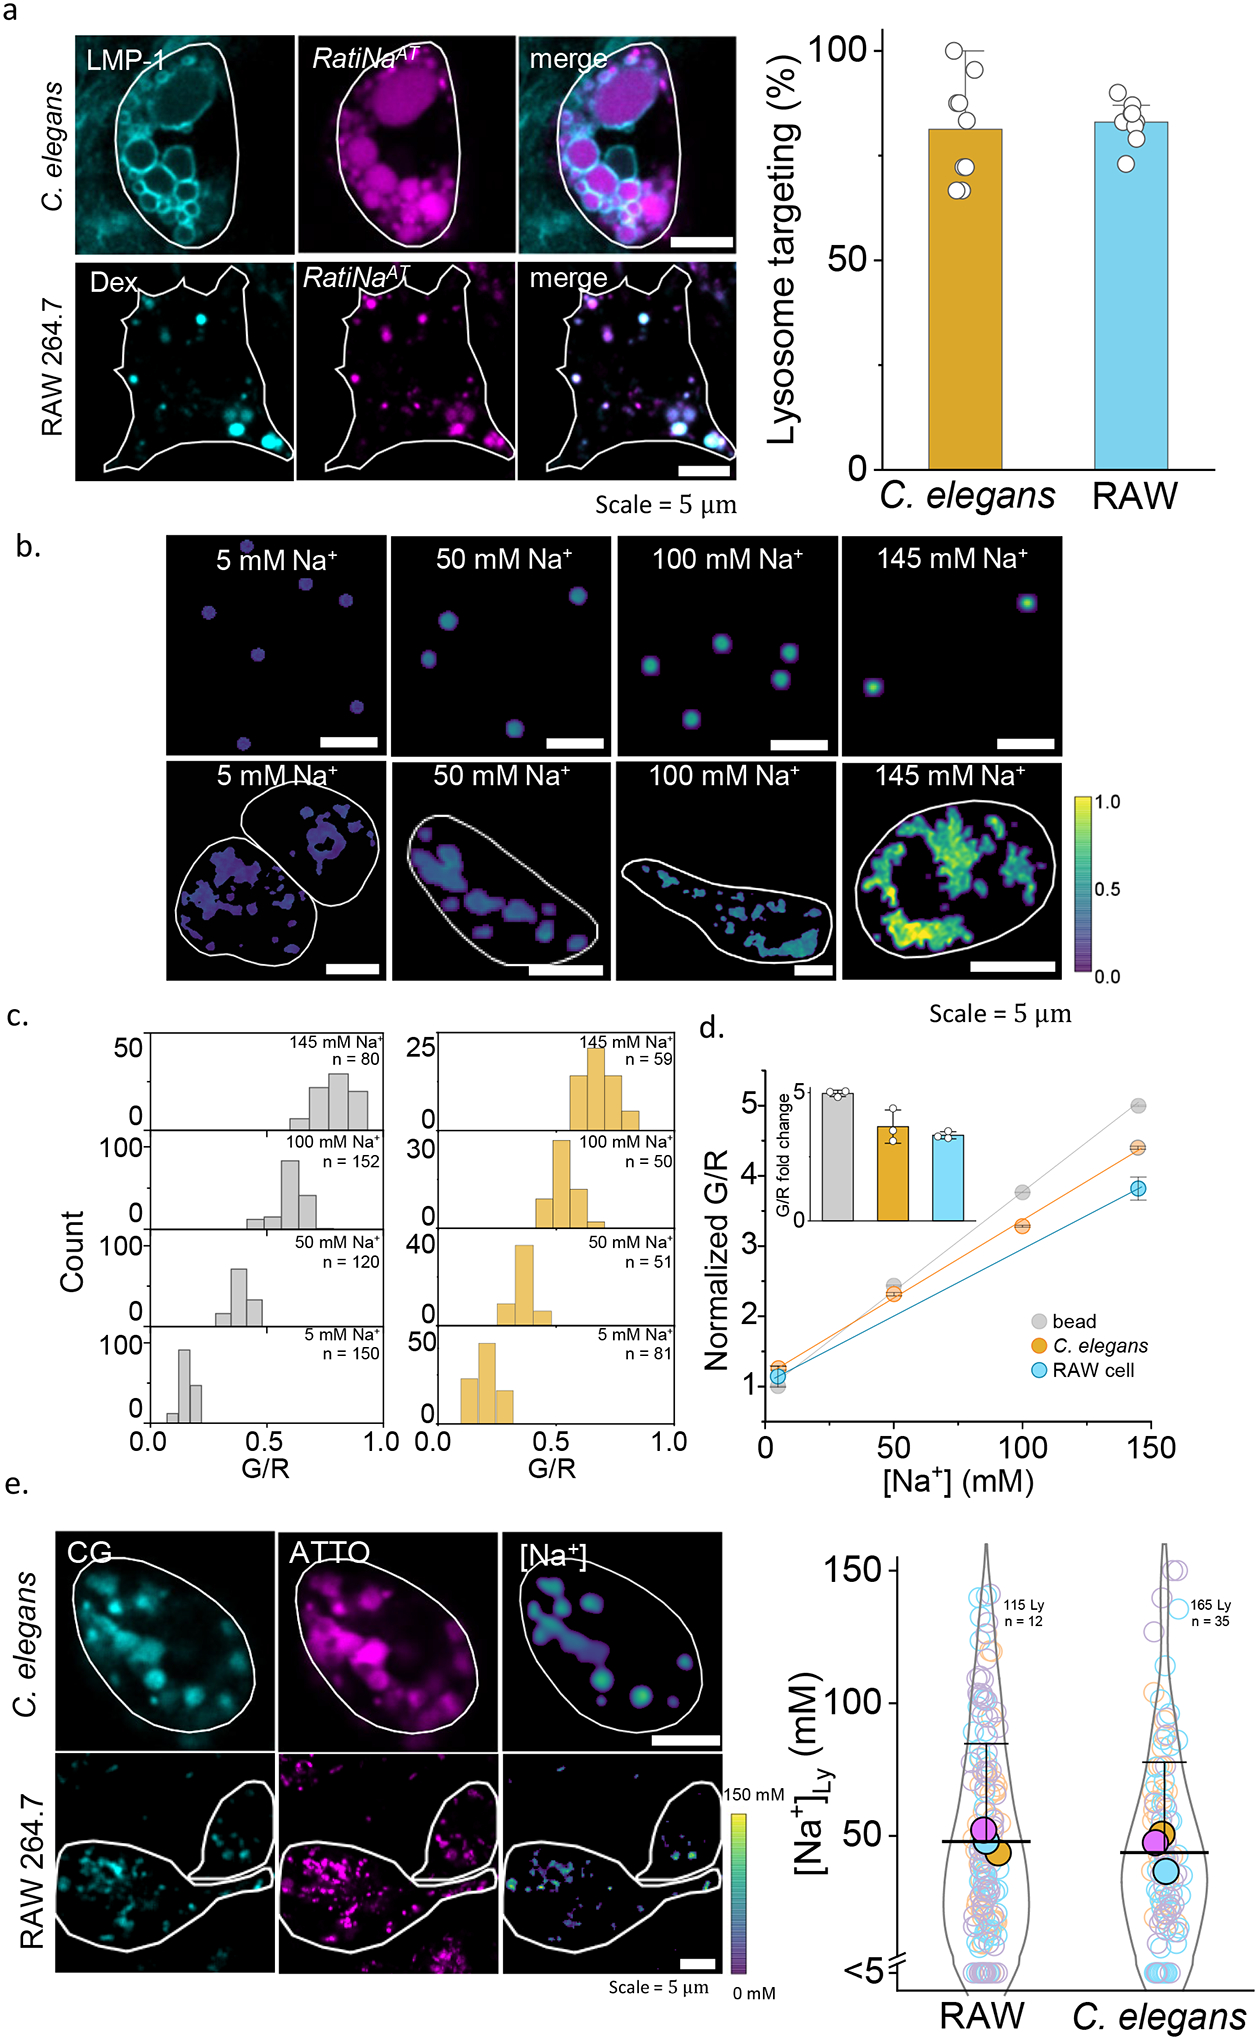
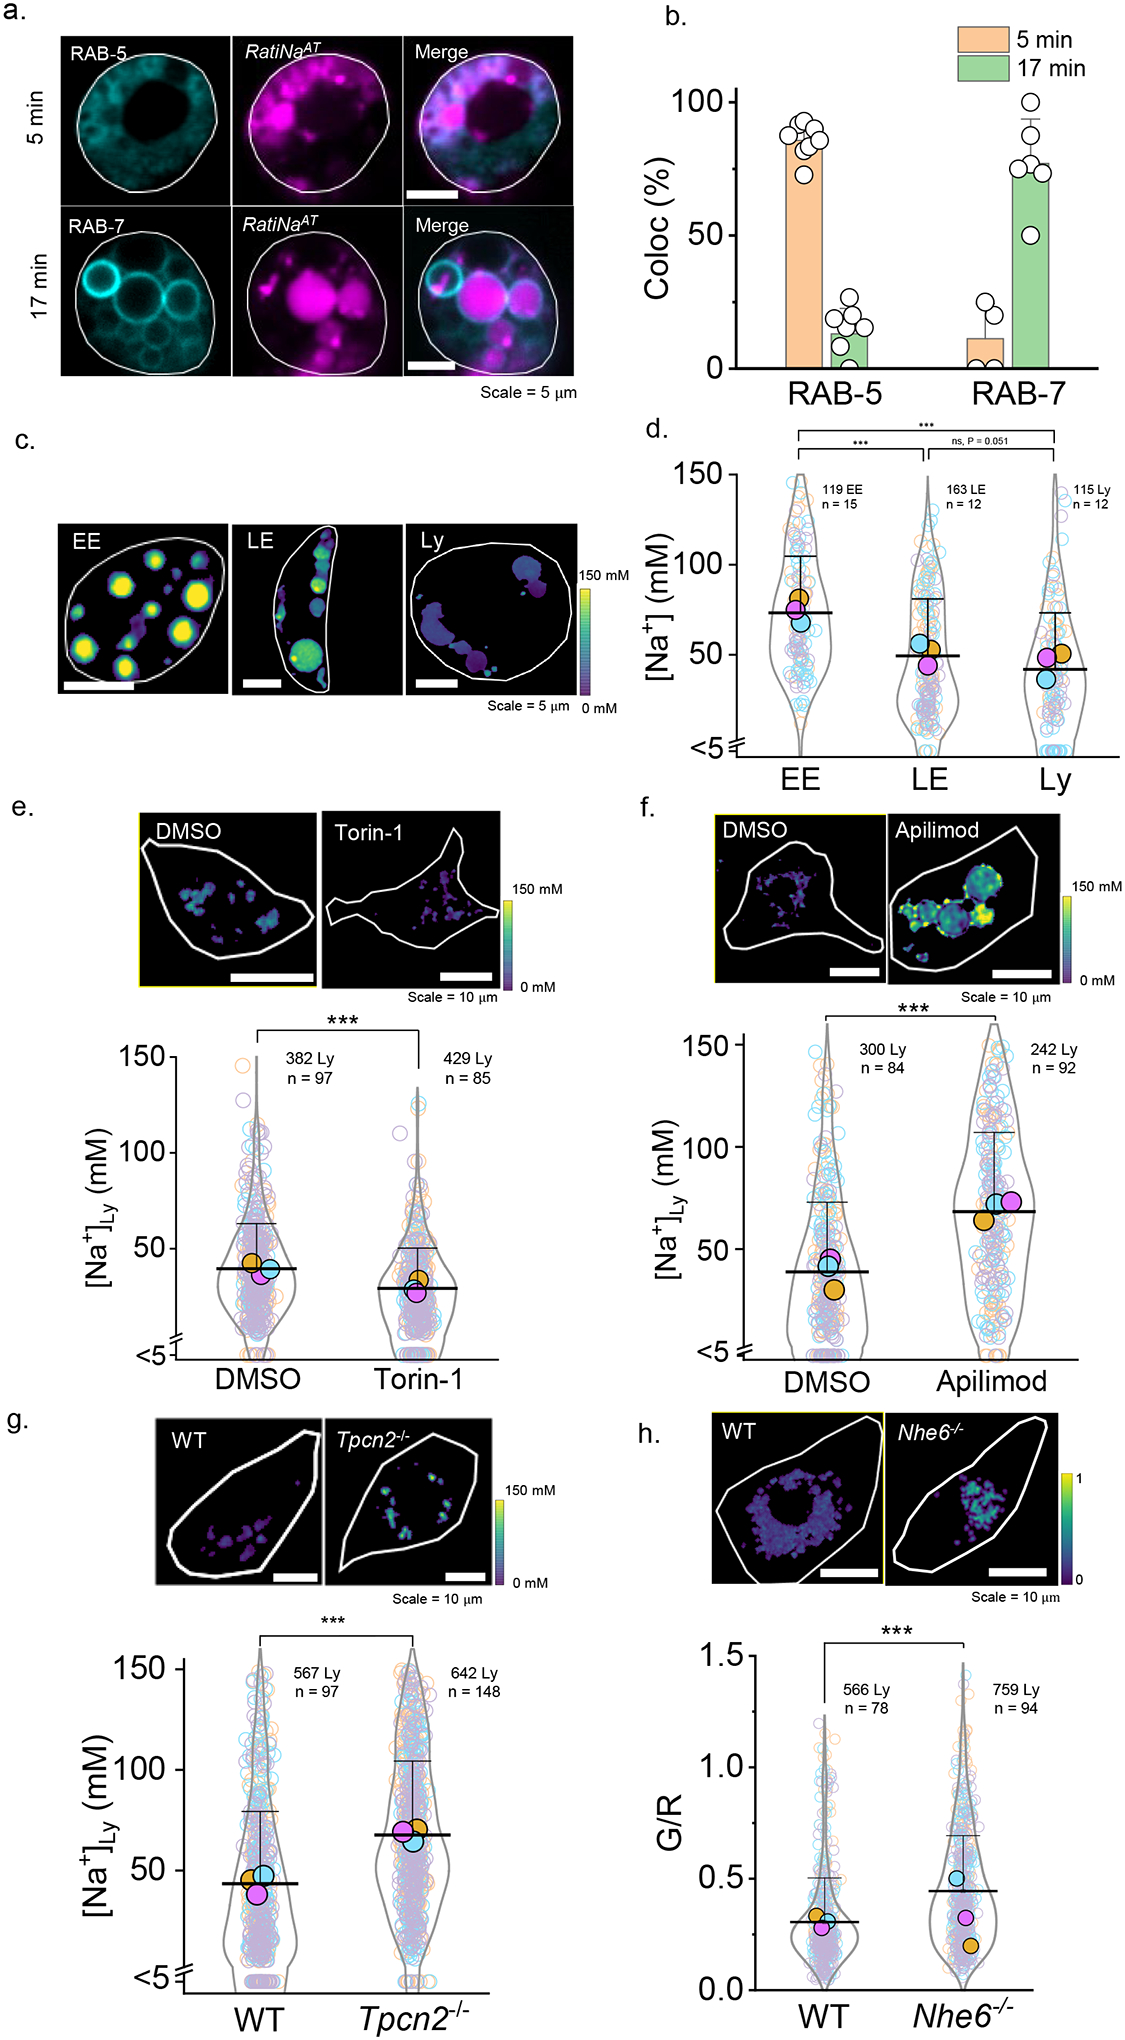
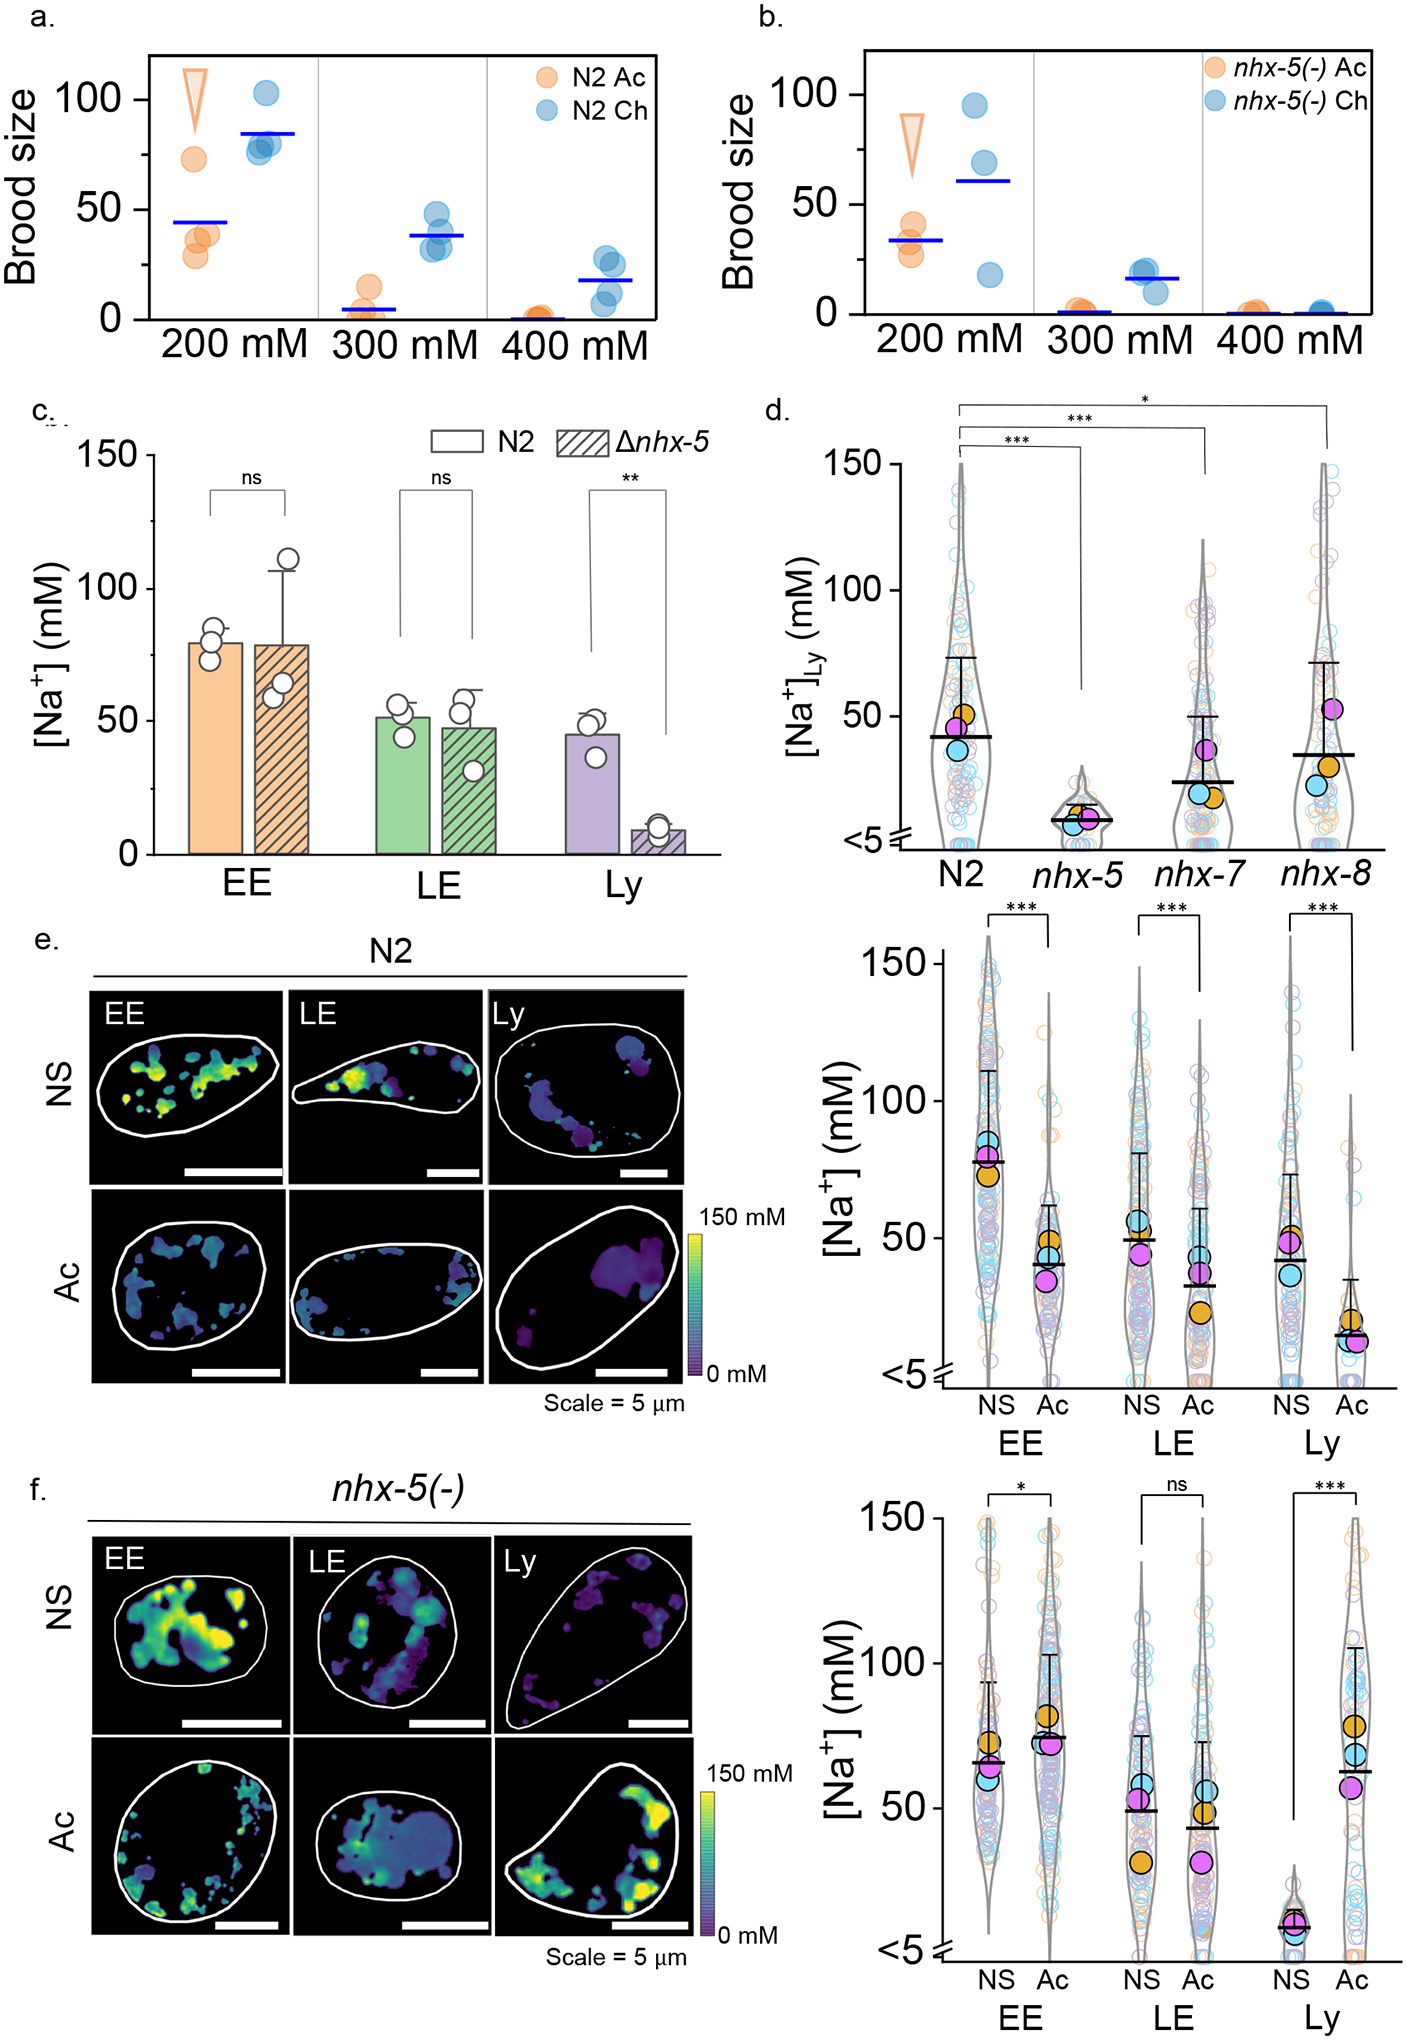
Cellular sodium ion (Na+) homeostasis is integral to organism physiology. Our current understanding of Na+ homeostasis is largely limited to Na+ transport at the plasma membrane. Organelles may also contribute to Na+ homeostasis; however, the direction of Na+ flow across organelle membranes is unknown because organellar Na+ cannot be imaged. Here we report a pH-independent, organelle-targetable, ratiometric probe that reports lumenal Na+. It is a DNA nanodevice containing a Na+-sensitive fluorophore, a reference dye and an organelle-targeting domain. By measuring Na+ at single endosome resolution in mammalian cells and Caenorhabditis elegans, we discovered that lumenal Na+ levels in each stage of the endolysosomal pathway exceed cytosolic levels and decrease as endosomes mature. Further, we find that lysosomal Na+ levels in nematodes are modulated by the Na+/H+ exchanger NHX-5 in response to salt stress. The ability to image subcellular Na+ will unveil mechanisms of Na+ homeostasis at an increased level of cellular detail.


Conflict of interest statement

Competing interests

The authors declare no competing interests. YK is a co-founder of Esya Inc and MacroLogic Inc that use DNA nanodevices to develop diagnostics and therapeutics respectively.

Figures

Extended Data Fig 1 |
Extended Data Fig 1 |. Chicago Green (CG) is pH insensitive and selective to Na+ prior to incorporation into RatiNa.
a, Na+ sensing mechanism of CG b, Excitation (black) and emission (green) spectra of free CG increases with increasing Na+. c, Dissociation constant (Kd) of CG for Na+ does not vary with pH from pH 4.5 – 7.4 d, Individual in vitro calibration profiles of RatiNa at different pH in Fig. 1d. e, Kd of RatiNa for Na+ at different pH values as calculated from d. Kd of RatiNa is higher than that of CG but is still pH invariant from pH 4.5 – 7.4. f, RatiNa response to K+ yields a Kd of 4.5 M and 27-fold selectivity for Na+ over K+. g, Magnified view of RatiNa Na+ calibration profile from 1 mM to 200 mM Na+.
Extended Data Fig 2 |
Extended Data Fig 2 |. Calibration of RatiNa and its stability in lysosomes of RAW264.7 macrophages.
a, Lysosomes in RAW264.7 macrophages prelabeled with TMR-dextran (cyan) and imaged at different chase times of RatiNaAT (magenta). b, Histogram of single lysosome signal ratio of RatiNaAT/TMR-dextran (R/G) at different chase time. A decrease of R/G indicates DNA degradation in lysosome over time. c, DNA degradation as a function of chase time calculated from b. Note that for 30 min chase time DNA is intact and ratiometry is valid. Error bar represents standard deviation. d, Normalized RatiNa signal (G/R) of single lysosome in RAW macrophage are plotted against the normalizing dye signal (R). The PCC analysis shows no correlation between G/R and R, indicating RatiNa signal and Na+ measurement is independent of probe concentration. e, Fluorescence images of RatiNaAT labeled RAW264.7 macrophages in CG (G) and ATTO (R) channels. Low amount of autofluorescence can be detected in the CG channel. f, Images of RatiNa-labeled lysosomes clamped at high and low Na+ of 145 mM and 5 mM in native lysosomes. G/R heat maps show adequate change that Na+ can be measured in native lysosomes.g, Histogram of G/R values of RatiNa-labeled single lysosomes. Accounting for autofluorescence represented by G/R in RatiNaAT sample, the fold change in G/R signal of RatiNa in lysosomes of RAW264.7 macrophages is comparable to that in C. elegans and on beads. h, Schematic of workflow from raw images to Na+ heat maps of single organelles. Fluorescent images in the CG (G) and ATTO (R) channels are used to construct the G/R image. Then the Na+ heatmap was generated from the calibration curve of G/R to [Na+].
Extended Data Fig 3 |
Extended Data Fig 3 |. Specificity of RatiNa targeting to endocytic organelles.
a, Representative images of C. elegans coelomocytes reveal negligible off-target labeling between RatiNaAT and indicated endocytic markers and chase times. b, RatiNa is targeted to a specific endocytic organelle at fixed chase time. Colocalization is calculated as percentage of organelles having both lumenal RatiNaAT and membrane marker fluorescence over all RatiNaAT containing organelles (n = 9 coelomocytes of 6 worms in 5 min chase of RAB-5::GFP, 7 coelomocytes of 6 worms in 17 min chase of RAB-5::GFP, 4 coelomocytes of 4 worms in 5 min chase of RAB-7::GFP, 6 coelomocytes in 5 worms of 17 min chase of RAB-7::GFP, 7 coelomocytes in 6 worms of 17 min chase of LMP-1::GFP, 9 coelomocytes in 6 worms for 60 min chase of LMP-1::GFP)
Extended Data Fig 4 |
Extended Data Fig 4 |. RatiNa reports lysosomal Na+ changes with inhibition of TPC2 and mTOR.
a, Apilimod is a strong inhibitor of PIKfyve that phosphorylate PI3P to PI(3,5)P2, which activate TPC2 channel to export lysosomal Na+. Inhibiting PIKfyve causes less efflux of lysosomal Na+. Lysosomal Na+ increases from 39 mM in vehicle to 68 mM in 100 nM apilimod treated RAW macrophages. b, Torin-1 inhibits mTOR and induces autophagy. After acute 1 h treatment of 1 uM Torin-1, lower lysosomal Na+ of 22 mM is observed compared to 40 mM in vehicle. *P ≤ 0.05; **P ≤ 0.01; ***P ≤ 0.001; ns, no statistical significance by two sample t-test.
Extended Data Fig 5 |
Extended Data Fig 5 |. Na+ transporter mutants are susceptible to salt stress.
a, Brood sizes of Na+ transporter mutants upon high salt stress. Na+ transporter deletion mutants cannot survive 400 mM NaCl compared to WT worms. Arrows indicates condition used for lysosomal Na+ measurement in salt stress worms is acute 200 mM (Ac worm in d.) b, Representative Na+ heatmaps of Na+ transporter deletion mutant worms. c, qRT-PCR shows that mRNA expression level of Na+ transporters do not change appreciably upon high salt stress in N2 worms. Fold change of between Ac and Ch condition N2 worms is plotted for mRNA level of Na+ transporters. act-1 was used as reference gene. d, Lysosomal Na+ levels of Na+ transporter mutant worms under NS and Ac condition. Higher lysosomal Na+ is observed in all investigated Na+ transporter mutant worms: 9 mM in NS and 63 mM in Ac for nhx-5(−) worms. 24 mM in NS and 51 mM in Ac for nhx-7(−) worms. 34 mM in NS and 55 mM in Ac for nhx-8(−) worms. 25 mM in NS and 36 mM in Ac for ncx-2(−) worms. *P ≤ 0.05; **P ≤ 0.01; ***P ≤ 0.001; ns, no statistical significance by two sample t-test.
Extended Data Fig 6 |
Extended Data Fig 6 |. Lysosomal pH of salt stressed worms.
a. PAGE analysis of the I-switch-based pH reporter module denoted Br-I-switch. DD strand has Alexa488N as a donor dye and DA strand has Alexa647N as acceptor dye. b. pH calibration curve of Br-I-switch shows ~20 fold change of D/A signal from pH 5.0 to 6.0, with highest sensitivity near pH 5.5 which is the pH of coelomocyte lysosome. c. pH measurement of single lysosome of N2 and nhx-5(−) worms in normal salt (NS) and acutely salt stressed (Ac) condition. nhx-5(−) has lower pH in both NS and Ac conditions. *P ≤ 0.05; **P ≤ 0.01; ***P ≤ 0.001; ns, no statistical significance by two sample t-test. d. Representative images of Br- I-switch in Donor (D), acceptor (A) FRET (D/A) channels and calculated pH heatmaps.
Figure 1 |
Figure 1 |. RatiNa is a ratiometric, pH-independent and specific reporter of Na+.
a, Schematic of the single stranded DNA molecules comprising RatiNa: D1 displays a Na+ sensing dye, Chicago Green (CG, green circle), D2 bears a reference ATTO647 fluorophore (red circle) and D3 harbors an organelle targeting motif. Na+ binding makes CG fluoresce (dark green circle). D1 and D3 are complementary to D2. b, Working principle of CG. CG is quenched by the N lone pair on the aza-crown ether via photoinduced electron transfer (PET). Na+ binding relieves PET and turns on CG fluorescence (right). c, RatiNa ratiometrically reports Na+. Increasing Na+ elevates fluorescence of CG (green traces) but not of ATTO647 (red traces). d, In vitro calibration profile of RatiNa on beads as a function of Na+ and pH levels. Na+ response of RatiNa is unaffected from pH 4.5 to 7.4. e, RatiNa responds specifically to Na+ in the presence of other physiologically relevant cations. RatiNa G/R fold change in universal buffer (UB, grey) with K+ = 145 mM; Li+, Ca2+, Mg2+ = 10 mM; NMDG = 0.3 M. G/R fold change with Na+ = 145 mM in UB (pink), intracellular buffer (IB, salmon) and extracellular buffer (EB, pistachio) n = 3 independent experiments. Data are presented as mean values ± standard deviation (SD). Two sample two-tailed t-test was used for statistical analysis with no multiple comparison correction, P = 3.18E-5.
Figure 2 |
Figure 2 |. In cell and in vivo calibration of RatiNa to measure lysosomal Na+.
a, Fluorescence images (left) show RatiNaAT (DNA, magenta) colocalized with lysosome markers (cyan), LMP-1 in C. elegans and TMR-dextran (Dex) in RAW macrophages. Percentage colocalization of RatiNaAT in lysosomes (right) in n = 9 coelomocytes and n = 8 RAW cells in two independent experiments. b, Ratiometric images of RatiNabiotin on beads (upper panels) and RatiNa-labeled, Na+ clamped C. elegans lysosomes (lower panels) at the indicated Na+ levels. Cell outline shown in white. c, G/R values increase with increasing Na+ on beads (grey, n = 100–150) and in worm lysosomes (ochre, n = 50–75). d, Linear fits of normalized G/R values of RatiNa as a function of [Na+] on beads (grey), in C. elegans lysosomes (ochre) and in RAW macrophages (cyan). Inset shows RatiNa response from 5 to 145 mM Na+. All experiments performed in triplicate. Absolute Na+ heatmaps of single, native, RatiNa-labeled lysosomes in C. elegans and RAW macrophages imaged in the CG (cyan) and ATTO647 (magenta) channels. Na+ values in single lysosomes of RAW macrophages and C. elegans coelomocytes (n = 100–150 lysosomes from 35–50 cells). Experiments were performed in triplicate and data from each trial is colour coded. Mean value of each trial is given by a filled circle of the corresponding colour. Lysosomes with Na+ values < 5 mM are shown below the break in the Y-axis (n = 21 and 17 for RAW cells and C. elegans). All error bar represents mean values ± SD.
Figure 3 |
Figure 3 |. RatiNa captures physiological changes in organellar Na+.
a, RatiNaAT (magenta) colocalizes with early endosome (EE) marker, RAB-5-GFP (cyan), and late endosome (LE) marker, RAB-7-GFP (cyan), time-dependently in C. elegans coelomocytes. b, Quantification of colocalization between RatiNaAT and the indicated markers at 5 min (n = 8, 4 coelomocytes) and 17 min (n = 7, 6 coelomocytes) respectively. Data are presented as mean values ± SD. c, RatiNa maps lumenal Na+ levels at each stage of endosomal maturation in coelomocytes of N2 C. elegans. Images are taken at 5 min, 7 min and 40 min post microinjection. d, Na+ levels decrease as endosomes mature with the biggest change from EE to LE. (n = 115–163 endosomes/lysosome from 12–15 worms). P = 2.6E-13 for EE to Ly, 7.7E-10 for EE to LE and 0.051 for LE to Ly. e, Pharmacological inhibition of mTOR with Torin-1 (1 mM) reduces lysosomal Na+. P = 9.3E-11. f, Pharmacological inhibition of TPCN2 by apilimod (100 nM) elevates lysosomal Na+ in RAW macrophages. Lysosomal Na+ is elevated in g, RAW264.7 macrophages where Tpcn2 is knocked out and h, in bone marrow derived macrophages from Nhe6−/− mice (n = 300–759 lysosomes from 84–148 cells). P = 1.3E-19, 7.5E-30, 5.5E-27 for f, g, h. *P ≤ 0.05; **P ≤ 0.01; ***P ≤ 0.001; ns, no statistical significance. Data in d-f are presented as mean values, error bars represent SD and two sample two-tailed t-test was used for statistical analysis assuming equal variance.
Figure 4 |
Figure 4 |. Lysosomal Na+ transport is vital for salt adaptation in C. elegans.
a,b, Brood size of acutely (Ac) and chronically salt stressed (Ch) N2 and nhx-5 (−) worms for the indicated salt levels. Arrows indicates condition used for lysosomal Na+ measurement in salt stressed worms is acute 200 mM c, Lumenal Na+ levels at each stage of the endolysosomal pathway in N2 and nhx-5(−) worms in normal salt (NS). Note that nhx-5(−) worms show lower Na+ levels only in lysosomes (Ly) and not in early (EE) or late endosomes (LE). P = 0.95, 0.71, 1.5E-3 for EE, LE, Ly d, In worms lacking the indicated nhx genes, Na+ levels in single lysosomes are affected specifically by loss of nhx-5. Levels in n = 100–150 lysosomes from 12–16 worms. For nhx-5 (−) alone, n=41 lysosomes, 6 worms. P = 1.4E-10, 2.2E-7, 0.11 for N2 to nhx-5 (−), nhx-7 (−), nhx-8 (−). e, f, Lysosomal Na+ reduces upon chronic salt stress in N2 worms but increases in nhx-5 (−) worms. Lumenal Na+ levels at each endosomal stage in normal salt (NS) and acutely (Ac) salt stressed N2 (e) and nhx-5(−) (f) worms. Cell outline is shown in white. All experiments were performed in triplicate and data from each trial is colour coded. Mean value of each trial given by a filled circle of the corresponding colour. P = 8.9E-19, 2.7E-6, 2.2E-6 for EE, LE, Ly in N2 and P = 0.01, 0.09, 2.1E-13 for EE, LE, Ly in nhx-5(−) worms. For all trials, n = 130–160 organelles from 8–12 worms. Only for Ac N2 and NS nhx-5(−) worms, data is from n = 40 lysosomes from 6 worms. Data in c-f are presented as mean values, error bars represent SD and two sample two-tailed t-test was used for statistical analysis assuming equal variance.

Similar articles

Cited by

References

    1. Shapovalov G et al. Organelle membrane derived patches: reshaping classical methods for new targets. Sci. Rep 7, 14082 (2017). - PMC - PubMed
    1. Nass R, Cunningham KW & Rao R Intracellular sequestration of sodium by a novel Na+/H+ exchanger in yeast is enhanced by mutations in the plasma membrane H+-ATPase. Insights into mechanisms of sodium tolerance. J. Biol. Chem 272, 26145–26152 (1997). - PubMed
    1. Nass R & Rao R Novel localization of a Na+/H+ exchanger in a late endosomal compartment of yeast. Implications for vacuole biogenesis. J. Biol. Chem 273, 21054–21060 (1998). - PubMed
    1. Orlowski J & Grinstein S Na+/H+ exchangers. Compr. Physiol 1, 2083–2100 (2011). - PubMed
    1. Pedersen SF & Counillon L The SLC9A-C Mammalian Na+/H+ Exchanger Family: Molecules, Mechanisms, and Physiology. Physiol. Rev 99, 2015–2113 (2019). - PubMed

Methods only references

    1. Ellison DH & Welling P Insights into Salt Handling and Blood Pressure. N. Engl. J. Med 385, 1981–1993 (2021). - PubMed
    1. Müller DN, Wilck N, Haase S, Kleinewietfeld M & Linker RA Sodium in the microenvironment regulates immune responses and tissue homeostasis. Nat. Rev. Immunol 19, 243–254 (2019). - PubMed
    1. Kitada K et al. High salt intake reprioritizes osmolyte and energy metabolism for body fluid conservation. J. Clin. Invest 127, 1944–1959 (2017). - PMC - PubMed
    1. Schindelin J et al. Fiji: an open-source platform for biological-image analysis. Nat. Methods 9, 676–682 (2012). - PMC - PubMed
    1. Suresh B et al. Tubular lysosomes harbor active ion gradients and poise macrophages for phagocytosis. Proc. Natl. Acad. Sci 118, (2021). - PMC - PubMed

Grants and funding

LinkOut - more resources