

Left Ventricular Myocardial Dysfunction Evaluation in Thalassemia Patients Using Echocardiographic Radiomic Features and Machine Learning Algorithms
- PMID: 37735309
- PMCID: PMC10584796
- DOI: 10.1007/s10278-023-00891-0
Left Ventricular Myocardial Dysfunction Evaluation in Thalassemia Patients Using Echocardiographic Radiomic Features and Machine Learning Algorithms
Abstract
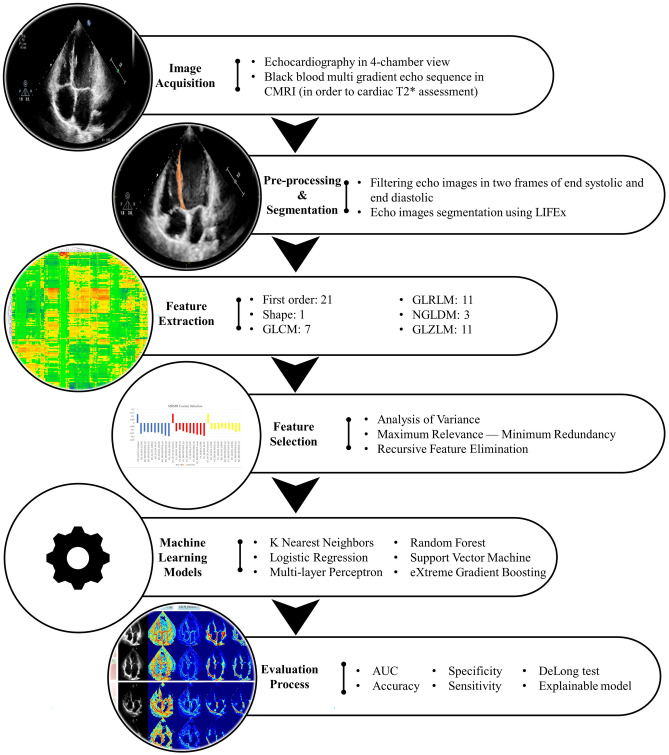
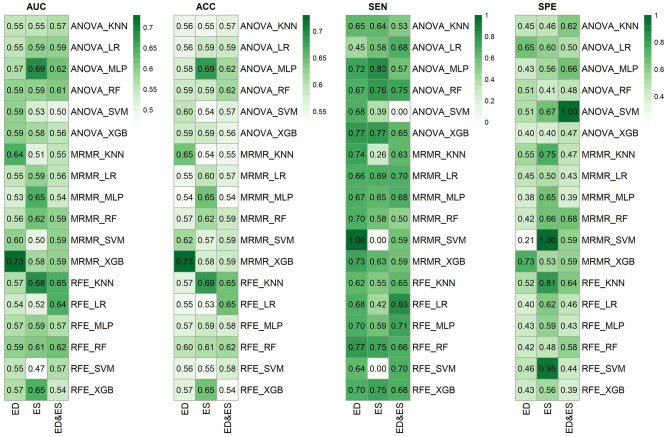
Heart failure caused by iron deposits in the myocardium is the primary cause of mortality in beta-thalassemia major patients. Cardiac magnetic resonance imaging (CMRI) T2* is the primary screening technique used to detect myocardial iron overload, but inherently bears some limitations. In this study, we aimed to differentiate beta-thalassemia major patients with myocardial iron overload from those without myocardial iron overload (detected by T2*CMRI) based on radiomic features extracted from echocardiography images and machine learning (ML) in patients with normal left ventricular ejection fraction (LVEF > 55%) in echocardiography. Out of 91 cases, 44 patients with thalassemia major with normal LVEF (> 55%) and T2* ≤ 20 ms and 47 people with LVEF > 55% and T2* > 20 ms as the control group were included in the study. Radiomic features were extracted for each end-systolic (ES) and end-diastolic (ED) image. Then, three feature selection (FS) methods and six different classifiers were used. The models were evaluated using various metrics, including the area under the ROC curve (AUC), accuracy (ACC), sensitivity (SEN), and specificity (SPE). Maximum relevance-minimum redundancy-eXtreme gradient boosting (MRMR-XGB) (AUC = 0.73, ACC = 0.73, SPE = 0.73, SEN = 0.73), ANOVA-MLP (AUC = 0.69, ACC = 0.69, SPE = 0.56, SEN = 0.83), and recursive feature elimination-K-nearest neighbors (RFE-KNN) (AUC = 0.65, ACC = 0.65, SPE = 0.64, SEN = 0.65) were the best models in ED, ES, and ED&ES datasets. Using radiomic features extracted from echocardiographic images and ML, it is feasible to predict cardiac problems caused by iron overload.
Keywords: Cardiac magnetic resonance imaging; Echocardiography; Machine learning; Radiomics; Thalassemia.
© 2023. The Author(s).
Conflict of interest statement
The authors declare no competing interests.
Figures
Similar articles
-
Four‑Dimensional Echocardiographic Evaluation of Cardiac Iron Overload in Patients with Beta-Thalassemia Major.Cardiovasc Toxicol. 2024 Jan;24(1):41-48. doi: 10.1007/s12012-023-09813-6. Epub 2023 Dec 18. Cardiovasc Toxicol. 2024. PMID: 38108958
-
Role of CMR feature-tracking derived left ventricular strain in predicting myocardial iron overload and assessing myocardial contractile dysfunction in patients with thalassemia major.Eur Radiol. 2021 Aug;31(8):6184-6192. doi: 10.1007/s00330-020-07599-7. Epub 2021 Mar 15. Eur Radiol. 2021. PMID: 33721061
-
The correlation between cardiac magnetic resonance T2* and left ventricular global longitudinal strain in people with β-thalassemia.Echocardiography. 2018 Apr;35(4):438-444. doi: 10.1111/echo.13801. Epub 2018 Feb 4. Echocardiography. 2018. PMID: 29399871
-
T2* magnetic resonance and myocardial iron in thalassemia.Ann N Y Acad Sci. 2005;1054:373-8. doi: 10.1196/annals.1345.045. Ann N Y Acad Sci. 2005. PMID: 16339685 Review.
-
Cardiovascular magnetic resonance in β-thalassemia major: beyond T2.Radiol Med. 2024 Dec;129(12):1812-1822. doi: 10.1007/s11547-024-01916-6. Epub 2024 Nov 7. Radiol Med. 2024. PMID: 39511065 Review.
Cited by
-
Cardiac injury caused by iron overload in thalassemia.Front Pediatr. 2025 Jan 27;13:1514722. doi: 10.3389/fped.2025.1514722. eCollection 2025. Front Pediatr. 2025. PMID: 39931654 Free PMC article. Review.
-
Progression prediction of coronary artery lesions by echocardiography-based ultrasomics analysis in Kawasaki disease.Ital J Pediatr. 2024 Sep 18;50(1):185. doi: 10.1186/s13052-024-01739-1. Ital J Pediatr. 2024. PMID: 39294681 Free PMC article.
-
Revolutionizing Cardiology: The Role of Artificial Intelligence in Echocardiography.J Clin Med. 2025 Jan 19;14(2):625. doi: 10.3390/jcm14020625. J Clin Med. 2025. PMID: 39860630 Free PMC article. Review.
-
Artificial Intelligence in the Differential Diagnosis of Cardiomyopathy Phenotypes.Diagnostics (Basel). 2024 Jan 10;14(2):156. doi: 10.3390/diagnostics14020156. Diagnostics (Basel). 2024. PMID: 38248033 Free PMC article. Review.
-
ELTIRADS framework for thyroid nodule classification integrating elastography, TIRADS, and radiomics with interpretable machine learning.Sci Rep. 2025 Mar 13;15(1):8763. doi: 10.1038/s41598-025-93226-8. Sci Rep. 2025. PMID: 40082527 Free PMC article.
References
-
- Aydinok Y. Thalassemia. Hematol. 2012;17:s28–s31. - PubMed
-
- Muncie HL, Jr, Campbell JS. Alpha and beta thalassemia. Am Fam Physician. 2009;80:339–344. - PubMed
-
- Said Othman KM, Elshazly SA, Heiba NM. Role of non-invasive assessment in prediction of preclinical cardiac affection in multi-transfused thalassaemia major patients. Hematol. 2014;19:380–387. - PubMed
Publication types
MeSH terms
LinkOut - more resources
Full Text Sources
Medical
