. 2023 Sep 21;20(1):212.
doi: 10.1186/s12974-023-02875-x.

Nrf2 regulates iron-dependent hippocampal synapses and functional connectivity damage in depression

Affiliations

Nrf2 regulates iron-dependent hippocampal synapses and functional connectivity damage in depression

Ting Zeng et al. J Neuroinflammation. .

Abstract

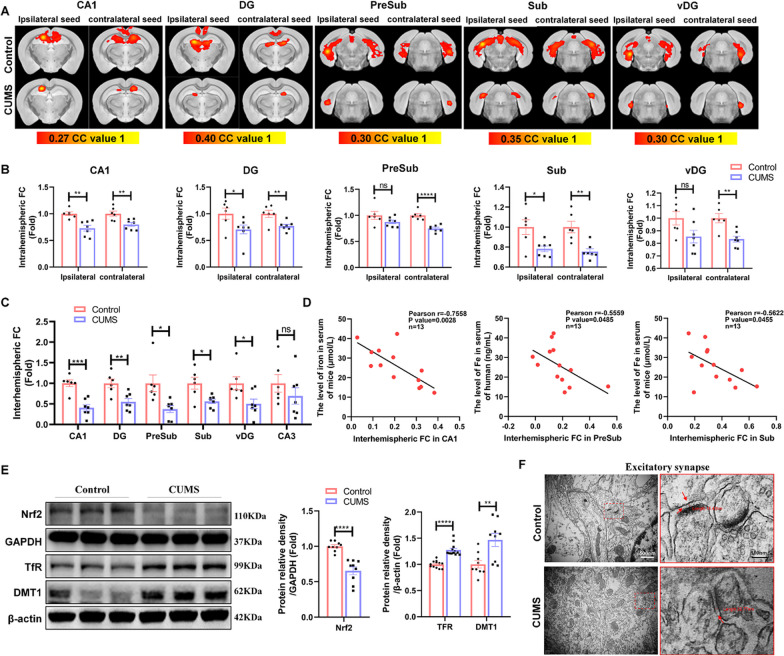
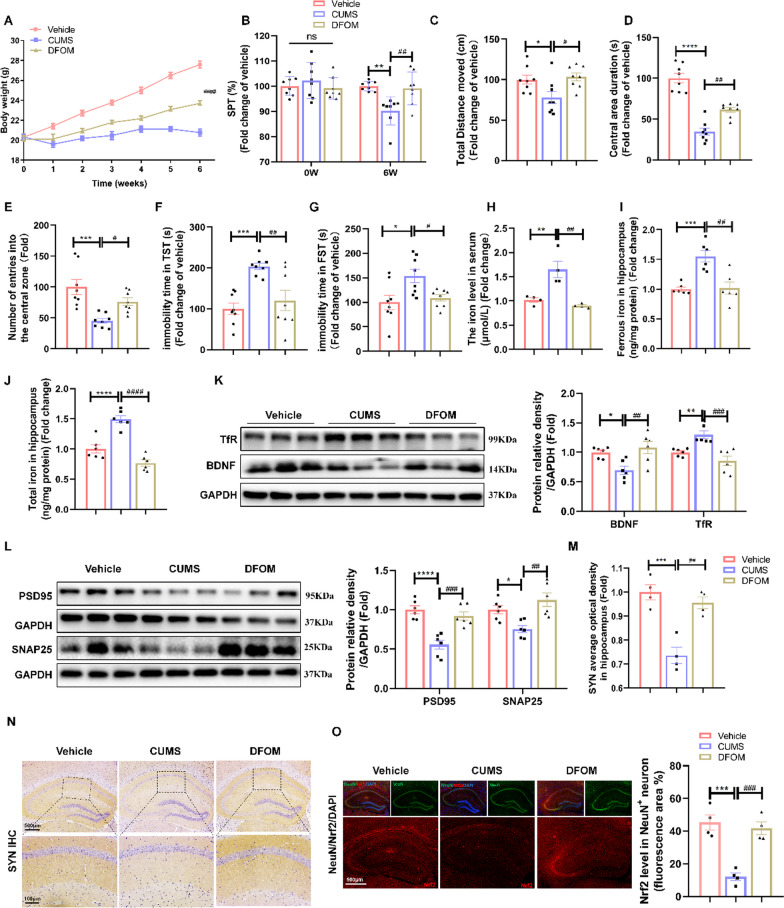
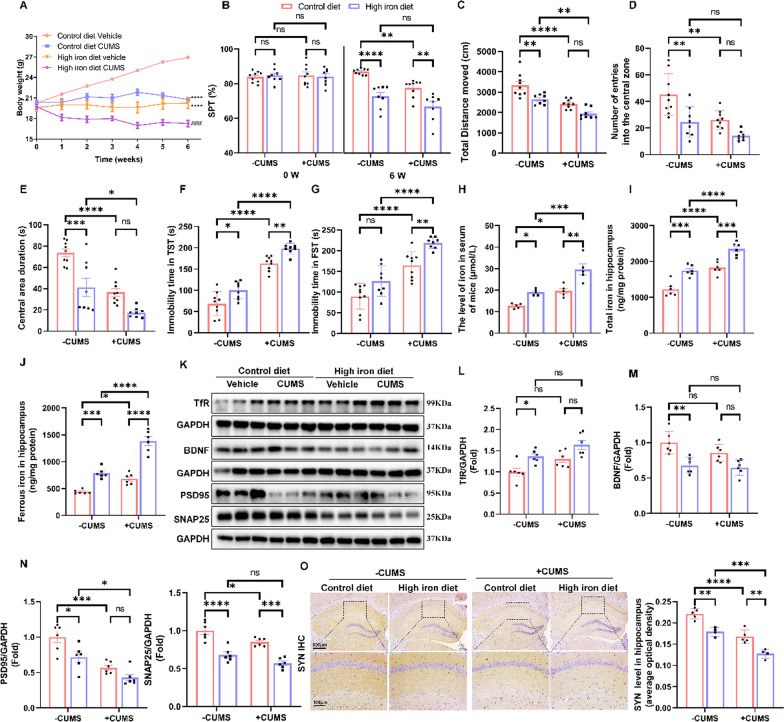
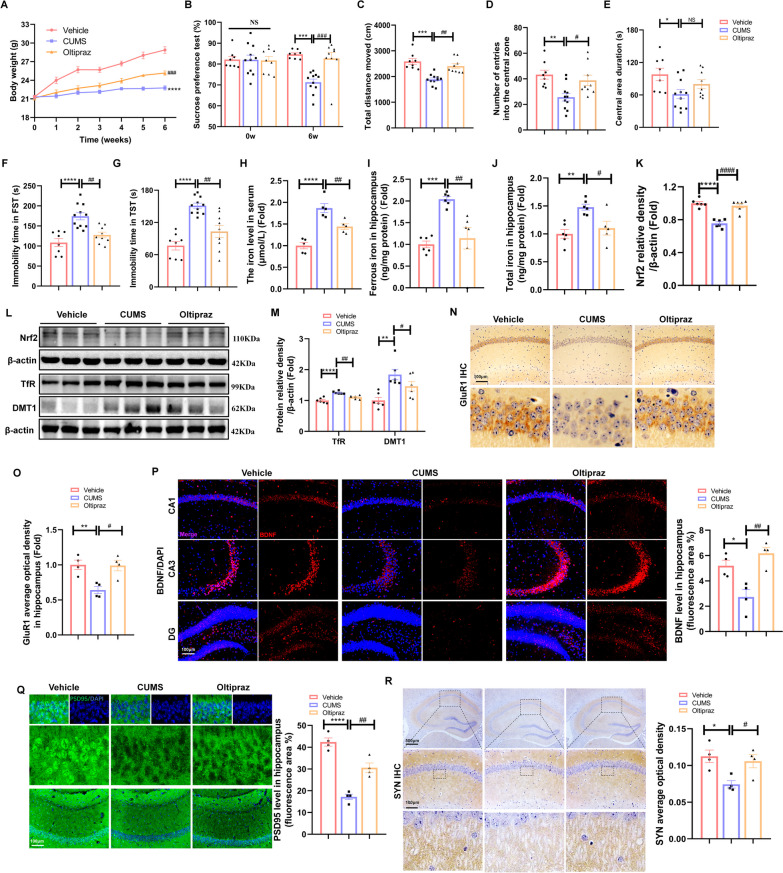
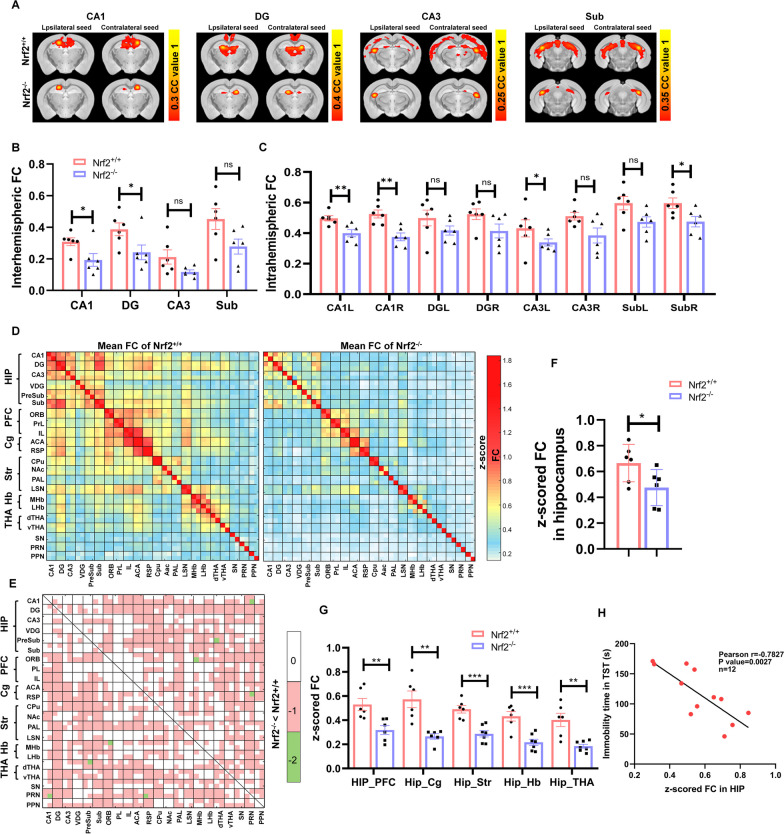
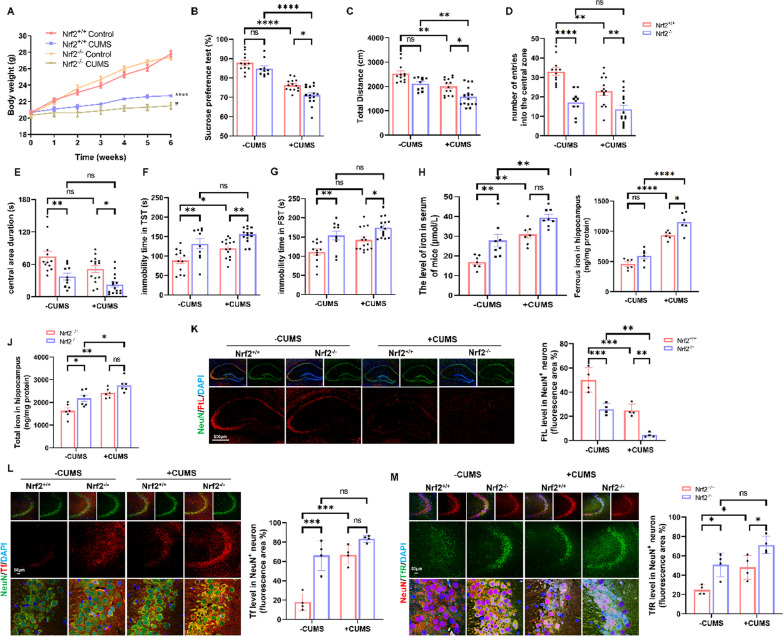
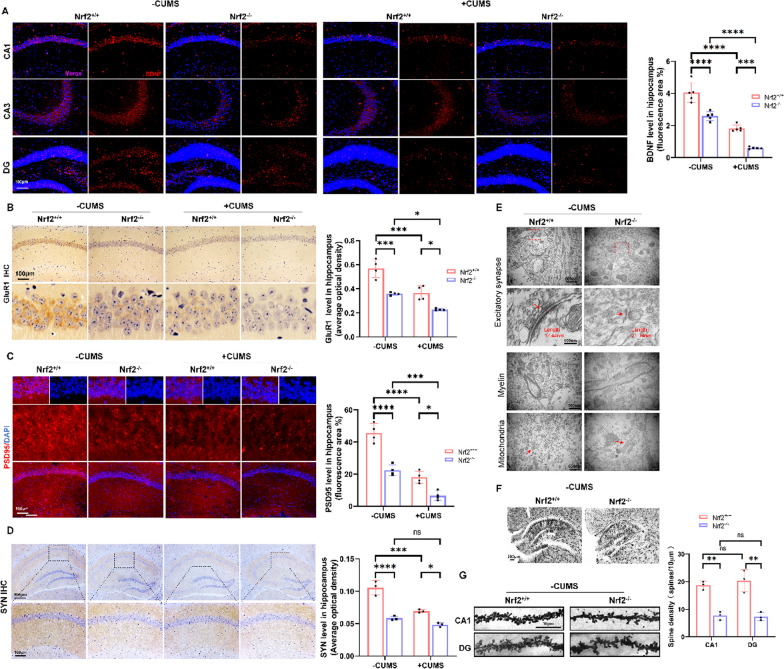
Neuronal iron overload contributes to synaptic damage and neuropsychiatric disorders. However, the molecular mechanisms underlying iron deposition in depression remain largely unexplored. Our study aims to investigate how nuclear factor-erythroid 2 (NF-E2)-related factor 2 (Nrf2) ameliorates hippocampal synaptic dysfunction and reduces brain functional connectivity (FC) associated with excessive iron in depression. We treated mice with chronic unpredictable mild stress (CUMS) with the iron chelator deferoxamine mesylate (DFOM) and a high-iron diet (2.5% carbonyl iron) to examine the role of iron overload in synaptic plasticity. The involvement of Nrf2 in iron metabolism and brain function was assessed using molecular biological techniques and in vivo resting-state functional magnetic resonance imaging (rs-fMRI) through genetic deletion or pharmacologic activation of Nrf2. The results demonstrated a significant correlation between elevated serum iron levels and impaired hippocampal functional connectivity (FC), which contributed to the development of depression-induced CUMS. Iron overload plays a crucial role in CUMS-induced depression and synaptic dysfunction, as evidenced by the therapeutic effects of a high-iron diet and DFOM. The observed iron overload in this study was associated with decreased Nrf2 levels and increased expression of transferrin receptors (TfR). Notably, inhibition of iron accumulation effectively attenuated CUMS-induced synaptic damage mediated by downregulation of brain-derived neurotrophic factor (BDNF). Nrf2-/- mice exhibited compromised FC within the limbic system and the basal ganglia, particularly in the hippocampus, and inhibition of iron accumulation effectively attenuated CUMS-induced synaptic damage mediated by downregulation of brain-derived neurotrophic factor (BDNF). Activation of Nrf2 restored iron homeostasis and reversed vulnerability to depression. Mechanistically, we further identified that Nrf2 deletion promoted iron overload via upregulation of TfR and downregulation of ferritin light chain (FtL), leading to BDNF-mediated synapse damage in the hippocampus. Therefore, our findings unveil a novel role for Nrf2 in regulating iron homeostasis while providing mechanistic insights into poststress susceptibility to depression. Targeting Nrf2-mediated iron metabolism may offer promising strategies for developing more effective antidepressant therapies.

Keywords: Depression; Iron metabolism; Nrf2; Rs-fMR; Synapse damage.


Conflict of interest statement

The authors declare that they have no competing interests.

Figures

Fig. 1
Fig. 1
Iron accumulation was associated with hippocampal functional connectivity dysfunction in CUMS mice. A Seed-based analysis represented by functional connectivity maps for WT and CUMS mice. The strength of connectivity for the seed region, indicated above each image, is mapped by a colour scale representing the correlation coefficient (CC) value. (Control n = 6 and CUMS n = 7; abbreviations: CA1 = field of CA1 in the hippocampus, DG = dentate gyrus, PreSub = presubiculum, Sub = subiculum, vDG = ventral dentate gyrus). B Average interhemispheric functional connectivity for CA1, DG, PreSub, Sub, and vDG in Control and CUMS mice. C Intrahemispheric functional connectivity for the ipsilateral and contralateral seeds of CA1, DG, PreSub, Sub, and vDG in control and CUMS mice. D Pearson linear correlation tests for Fe levels in serum and interhemispheric FC in CA1, PreSub, and Sub. E Western blot analysis of the relative density ratios of TfR, Nrf2 and DMT1 expression in the hippocampus of the control and CUMS groups. GAPDH and β-Actin served as a loading control. The density of β-actin, GAPDH, TfR, Nrf2 and DMT1 protein was measured using ImageJ software. (Nrf2 and DMT1: n = 9/group; TfR: n = 12/group). F Electron microscopy image of excitatory/asymmetric spines (arrows point to the synaptic cleft, scale bars, 500 nm, n = 3 mice/group). Bars represent the mean ± SEM; statistical analysis was performed by using an unpaired two-tailed t test. *P < 0.05, **P < 0.01, ***P < 0.001, and ****P < 0.0001
Fig. 2
Fig. 2
Alleviation of iron overload attenuated depression-like behaviours by ameliorating synaptic damage and activating Nrf2. A Body weight changes in mice during the CUMS procedure in the vehicle, CUMS and DFOM groups (n = 8/group). B SPT in each group (n = 8/group). CE OFT in each group (n = 8/group). F and G TST and FST in each group (all Groups n = 8/group). H The level of Fe in the serum of mice (n = 4/group). I and J Ferrous iron and total iron in the hippocampus of the different indicated groups (n = 6/group). K Western blot analysis of the relative density ratios of TfR and BDNF expression in the hippocampus of each group (n = 6/group). GAPDH served as a loading control. The density of GAPDH, TfR and BDNF protein was measured using ImageJ software. L Western blot analysis of the relative density ratios of PSD95 and SNAP25 expression in the hippocampus of each group (n = 6/group). GAPDH served as a loading control. The density of GAPDH, PSD95 and SNAP25 protein was measured using ImageJ software. M and N Immunohistochemical staining of SYN (sepia) in the hippocampus (n = 4/group; scale bars, 100 μm). O Immunofluorescence of the hippocampus costained with Nrf2 (red) and the mature neuron marker NeuN (green) (n = 4/group; scale bars, 500 μm). All images of immunostaining were analysed with ImageJ software. Bars represent the mean ± SEM. Bars represent the mean ± SEM. Statistical analysis was performed by one-way ANOVA with Tukey’s post hoc test. Body weight data were analysed by two-way repeated measures analysis of variance. * Represents comparison with the control group; # represents comparison with the CUMS group. *P < 0.05, **P < 0.01, ***P < 0.001, and ****P < 0.0001
Fig. 3
Fig. 3
Iron overload contributed to depression-like behaviour and synaptic plasticity impairment in mice. A Body weight changes in mice during the CUMS procedure in the control diet vehicle, control diet CUMS, high-iron diet vehicle and high-iron diet CUMS groups (n = 8–9/group). B SPT in each group (n = 8–9/group). CE OFT in each group (n = 8–9/group). F and G TST and FST in each group (all Groups n = 8–9/group). H The level of Fe in the serum of mice (n = 5/group). I and J Ferrous iron and total iron in the hippocampus of the different indicated groups (n = 6/group). K–L Western blot analysis of the relative density ratios of TfR, BDNF, PSD95 and SNAP25 expression in the hippocampus in each group. GAPDH served as a loading control. The density of each protein was measured using ImageJ software (n = 6/group). O Immunohistochemical staining of SYN (sepia) in the hippocampus (n = 5/group; scale bars, 100 μm). All images of immunostaining were analysed with ImageJ software. Bars represent the mean ± SEM. Statistical analysis was performed by two-way ANOVA with Bonferroni’s post hoc test. * Represents comparison with the control (vehicle) group, # represents comparison with the model group. *P < 0.05, **P < 0.01, ***P < 0.001, and ****P < 0.0001
Fig. 4
Fig. 4
Induction of Nrf2 by Oltipraz prevented CUMS-induced depression-like behaviours and iron deposition by TfR inhibition. AG Body weight, SPT, OFT, TST and FST in the different indicated groups (Control n = 8, CUMS n = 11, Oltipraz n = 9). H The level of Fe in the serum of mice (Control n = 10, CUMS n = 9, Oltipraz n = 7). I and J Ferrous iron and total iron in the hippocampus of the different indicated groups (n = 5/group). KM Western blot analysis of the relative density ratios of Nrf2, TfR and DMT1 expression in the hippocampus. β-Actin served as a loading control. The density of β-actin, Nrf2, TfR and DMT1 protein was measured using ImageJ software. (n = 6/group). N and O Immunohistochemical staining of GluR1 (sepia) in the hippocampus (n = 4/group; scale bars, 100 μm). P Immunofluorescence staining of BDNF in the hippocampus (n = 4/group; scale bars, 100 μm). Q Immunofluorescence staining of the astrocyte marker PSD95 in the hippocampus (n = 4/group; scale bars, 100 μm). R Immunohistochemical staining of SYN (sepia) in the hippocampus (n = 4/group; scale bars, 100 μm). All images of immunostaining were analysed with ImageJ software. Bars represent the mean ± SEM. Statistical analysis was performed by one-way ANOVA with Tukey’s post hoc test. Body weight data were analysed by two-way repeated measures analysis of variance. * Represents comparison with the control group, # represents comparison with the model group. *P < 0.05, **P < 0.01, ***P < 0.001, and ****P < 0.0001
Fig. 5
Fig. 5
Nrf2−/− mice showed impaired bilateral-brain functional connectivity. A Seed-based analysis represented by functional connectivity maps for Nrf2+/+ and Nrf2−/− mice. The strength of connectivity for the seed region, indicated above each image, is mapped by a colour scale representing the correlation coefficient value (CC) value (abbreviations: CA3 = field of CA3 in hippocampus). B and C Average interhemispheric and intrahemispheric functional connectivity for ipsilateral and contralateral seeds in Nrf2+/+ and Nrf2−/− mice. D Functional connectivity matrices of Nrf2+/+ mice (left) and Nrf2−/− mice (right) (postnatal week 12), in which functional correlation (z score) between pairs of regions is represented by a colour scale (abbreviations: ORB = orbital, PL = prelimbic, IL = infralimbic, ACA = anterior cingulate area, RSP = retrosplenial area, Cpu = caudate putamen, NAc = nucleus accumbens, LSN = lateral septal nucleus, MHb = medial habenula, LHb = lateral habenula, dTHA = dorsal nucleus of thalamus, vTHA = ventral medial nucleus of the thalamus, SN = substantia nigra, PRN = pontine reticular nucleus, PPN = pedunculopontine nucleus). E The functional connectivity matrix of Nrf2+/+ and Nrf2−/− mice was subjected to a two-sample T test to obtain a statistically significant matrix, where 0 represents P > 0.05, 1 represents P < 0.05, and 2 represents P < 0.01. F Based on the matrix in D and E, the average functional connectivity strength of the hippocampus with all other regions was calculated for Nrf2+/+ and Nrf2−/− mice. G As shown in D, functional connectivity was averaged between the hippocampus and the PFC, Cg, Str, Hb, and THA (n = 6/group). H Pearson linear correlation tests for immobility time in the TST and z scores in the hippocampus. Bars represent the mean ± SEM; statistical analysis was performed by using an unpaired two-tailed t test. *P < 0.05, **P < 0.01
Fig. 6
Fig. 6
Genetic ablation of Nrf2 aggravated the depression-like phenotypes with or without CUMS exposure in mice by regulating iron metabolism in neurons. A–G Body weight, SPT, OFT, TST and FST in the different indicated groups (control n = 12, CUMS n = 14, Nrf2−/− control n = 10, Nrf2−/− CUMS n = 15 mice). H The level of Fe in the serum of mice (control n = 7, CUMS n = 7, Nrf2−/− control n = 8, Nrf2−/− CUMS n = 8 mice). I and J Ferrous iron and total iron in the hippocampus of the different indicated groups (n = 6/group). K Immunofluorescence of the hippocampus costained with FtL (red) and the mature neuron marker NeuN (green) (n = 4/group; scale bars, 50 μm). L Immunofluorescence of the hippocampus costained with Tf (red) and the mature neuron marker NeuN (green) (n = 4/group; scale bars, 50 μm). M Immunofluorescence of the hippocampus costained with TfR (green) and the mature neuron marker NeuN (red) (n = 4/group; scale bars, 50 μm). All images of immunostaining were analysed with ImageJ software. Bars represent the mean ± SEM. Statistical analysis was performed by two-way ANOVA with Bonferroni’s post hoc test. Body weight data were analysed by two-way repeated measures analysis of variance. *Represents comparison with the control group, # represents comparison with the model group. *P < 0.05, **P < 0.01, ***P < 0.001, and ****P < 0.0001
Fig. 7
Fig. 7
Nrf2 deficiency contributed to impaired synaptic plasticity in mice by iron accumulation. A Immunofluorescence staining of BDNF in the hippocampus. (n = 5/group; scale bars, 100 μm). B Immunohistochemical staining of GluR1 (sepia) in the hippocampus (n = 4/group; scale bars, 100 nm). The AOD of GluR1 staining was measured using ImageJ software (n = 4/group). C Immunofluorescence staining of PSD95 in the hippocampus (n = 4/group; scale bars, 50 μm). D Immunohistochemical staining of the microglial marker SYN (sepia) in the hippocampus (n = 3/group; scale bars, 100 μm). E Electron microscopy image of excitatory/asymmetric spines (arrows point to the synaptic cleft), myelin and mitochondria (n = 3/group; scale bars, 500 nm). F and G Neuroanatomical alterations were analysed in unperfused brains using Golgi staining. The spine density in hippocampal CA1 and DG assessments was analysed by the microscopic image analysis software Imaris (Imaris 8.1, BitPlane) (n = 3/group, 15–20 dendrites/mice, per dendritic segments of 10 μm, the scale bars in the dendritic images represent 10 µm). All images of immunostaining were analysed with ImageJ software. Bars represent the mean ± SEM. Statistical analysis was performed by two-way ANOVA with Bonferroni’s post hoc test. *Represents comparison with the control group, # represents comparison with the model group. *P < 0.05, **P < 0.01, ***P < 0.001, and ****P < 0.0001

Similar articles

Cited by

References

    1. Malhi GS, Mann JJ. Depression. Lancet. 2018;392:2299–2312. - PubMed
    1. Kupfer DJ, Frank E, Phillips ML. Major depressive disorder: new clinical, neurobiological, and treatment perspectives. Lancet. 2012;379:1045–1055. - PMC - PubMed
    1. Duman RS, Aghajanian GK, Sanacora G, Krystal JH. Synaptic plasticity and depression: new insights from stress and rapid-acting antidepressants. Nat Med. 2016;22:238–249. - PMC - PubMed
    1. Duman RS, Aghajanian GK. Synaptic dysfunction in depression: potential therapeutic targets. Science. 2012;338:68–72. - PMC - PubMed
    1. Yu D, Cheng Z, Ali AI, Wang J, Le K, Chibaatar E, Guo Y. Chronic unexpected mild stress destroys synaptic plasticity of neurons through a glutamate transporter, GLT-1, of astrocytes in the ischemic stroke rat. Neural Plast. 2019;2019:1615925. - PMC - PubMed