. 2023 Sep 21;14(1):5890.
doi: 10.1038/s41467-023-41656-1.

Decoding the endometrial niche of Asherman's Syndrome at single-cell resolution

Affiliations

Decoding the endometrial niche of Asherman's Syndrome at single-cell resolution

Xavier Santamaria et al. Nat Commun. .

Abstract

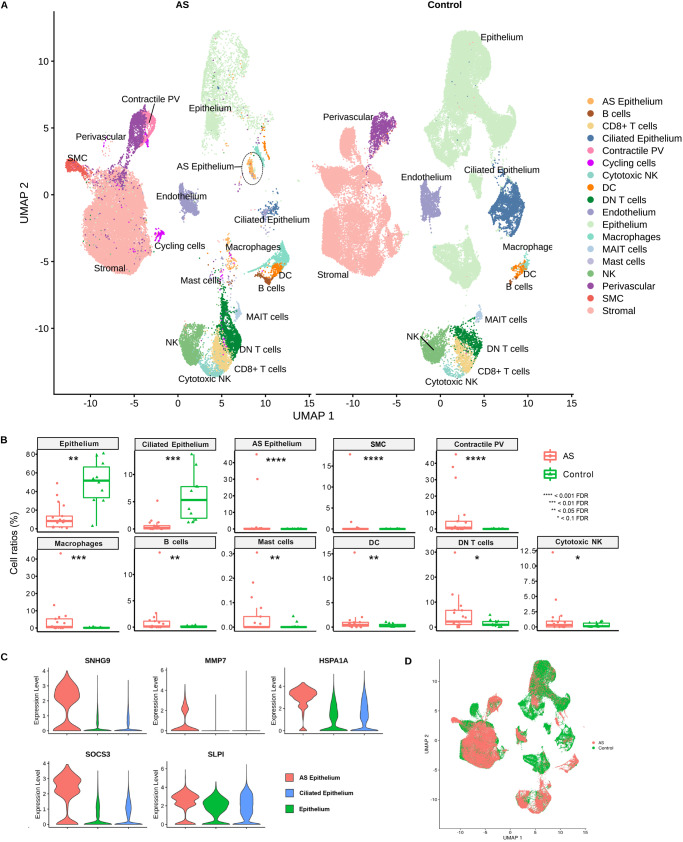
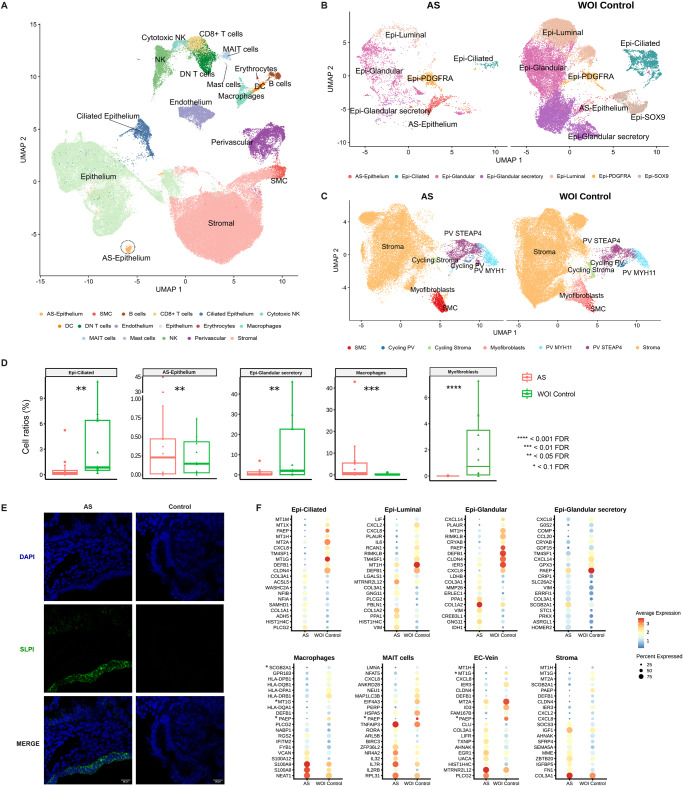
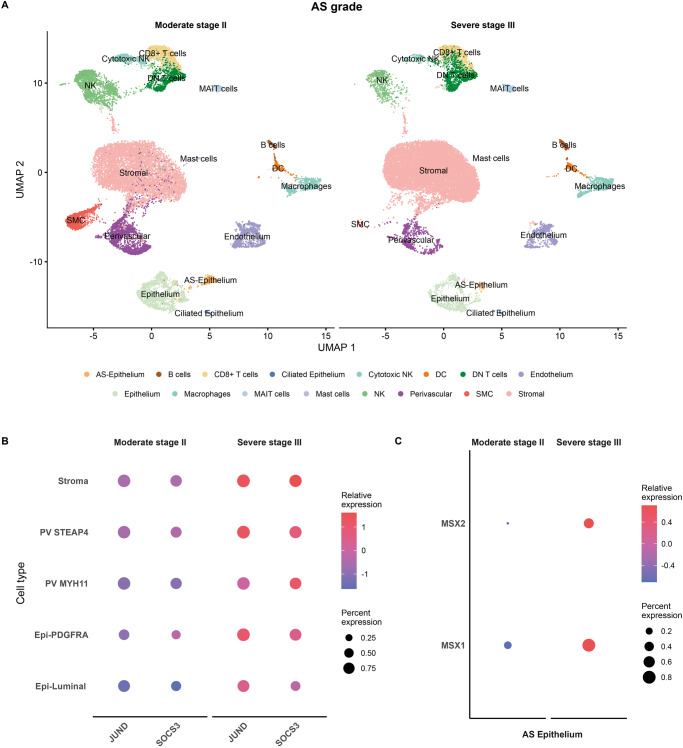
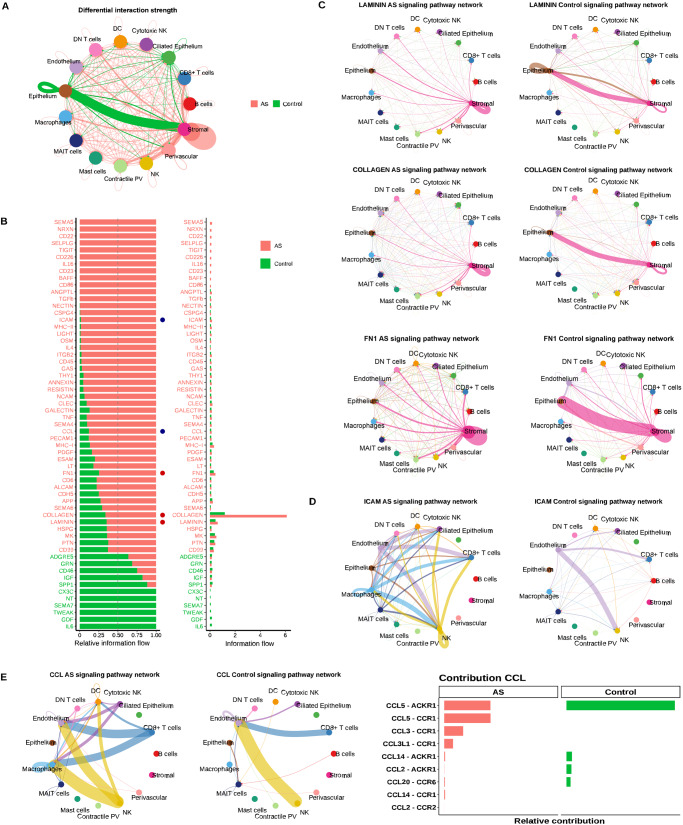
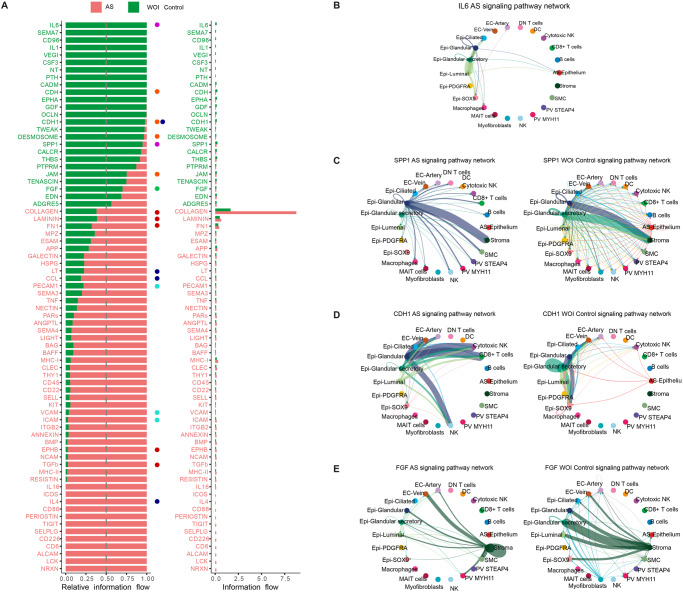
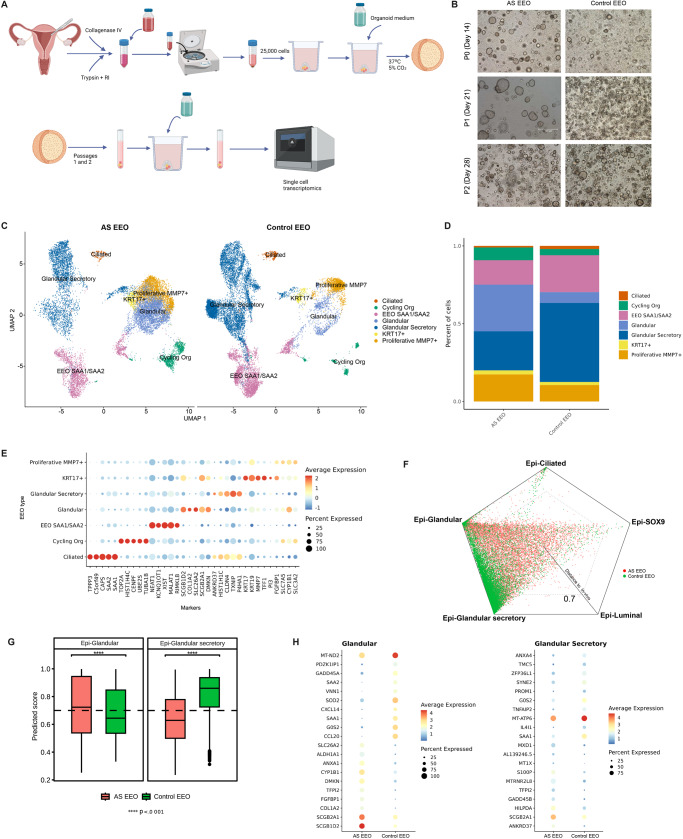
Asherman's Syndrome is characterized by intrauterine adhesions or scarring, which cause infertility, menstrual abnormalities, and recurrent pregnancy loss. The pathophysiology of this syndrome remains unknown, with treatment restricted to recurrent surgical removal of intrauterine scarring, which has limited success. Here, we decode the Asherman's Syndrome endometrial cell niche by analyzing data from over 200,000 cells with single-cell RNA-sequencing in patients with this condition and through in vitro analyses of Asherman's Syndrome patient-derived endometrial organoids. Our endometrial atlas highlights the loss of the endometrial epithelium, alterations to epithelial differentiation signaling pathways such as Wnt and Notch, and the appearance of characteristic epithelium expressing secretory leukocyte protease inhibitor during the window of implantation. We describe syndrome-associated alterations in cell-to-cell communication and gene expression profiles that support a dysfunctional pro-fibrotic, pro-inflammatory, and anti-angiogenic environment.


Conflict of interest statement

C.S. and X.S. are founders and shareholders of Asherman Therapy S.L. and inventors of patents granted in Europe, Australia, Canada, Japan, Russian Federation, Mexico, and the US derived from PCT application PCT/IB2015/001715. M.P-F. is partially employed by Asherman Therapy S.L. The remaining authors declare no competing interests.

Figures

Fig. 1
Fig. 1. Single-cell RNA-sequencing cartography of the human endometrium in Asherman´s syndrome patients and healthy controls.
A UMAP integration of 109,538 cells from nine AS patients (40,336 cells) and ten healthy individuals (Control) covering the secretory phase from the GSE111976 dataset (69,202 cells). Characteristic AS epithelium highlighted within a dotted circle. B Cell ratios comparing the endometrium of healthy (Control) and AS patients (two-sided NB-GLM statistical test; n = 9 for independent AS patients, n = 10 for independent control endometrium). C Marker gene expression in AS epithelium. D Integrated UMAP highlighting characteristic AS types. AS Asherman’s syndrome, DC dendritic cells, DN double negative, FDR false discovery rate, MAIT mucosal-associated invariant T, NK natural killer, PV perivascular, SMC smooth muscle cells.
Fig. 2
Fig. 2. Single-cell RNA-sequencing-based fine-grain identification of epithelial and stromal subpopulations in Asherman’s syndrome patients compared to healthy window of implantation controls.
A UMAP integration of scRNA-seq data obtained from 106,400 cells, including nine AS patients (n = 40,336 cells) and twelve healthy WOI controls (n = 66,064 cells) showing the main cell types present in the endometrium during the WOI. Specific zoom-in UMAP of B epithelial cell composition and C stromal and PV cell compositions. D Ratios of specific cell types comparing AS patients to WOI controls (two-sided NB-GLM statistical test; n = 9 for independent AS patients, n = 12 for independent WOI control samples). E Representative RNAscope images showing the expression of SLPI as a marker of the characteristic AS epithelium cell type in AS patients. Images show an example of SLPI expression in AS and control endometria. SLPI (green) expression counterstained with DAPI shown merged and in separate channels for clarity. Scale bar = 20 µm. F Differential gene expression dot plots for epithelial subtypes, macrophages, MAIT cells, EC-Vein, and stroma in AS and WOI control endometria (two-sided Wilcoxon Rank Sum test; FDR < 0.05). Note: the genes marked with and asterisk (*) in the differential expression results may have been influenced by ambient RNA ambient contamination. AS Asherman’s syndrome, DC dendritic cells, DN double negative, Epi epithelial, FDR false discovery rate, MAIT mucosal-associated invariant T, NK natural killer, PV perivascular, SLPI Secretory Leukocyte Peptidase Inhibitor, SMC smooth muscle cells, WOI window of implantation.
Fig. 3
Fig. 3. Single-cell RNA-sequencing-defined alterations according to Asherman’s syndrome severity.
A UMAP displaying the primary cell population detected in AS patients with moderate (Stage II) and severe (Stage III) forms of the disease. B Dot plot of differential gene expression analysis between AS severity groups (two-sided Wilcoxon Rank Sum test; FDR < 0.05). C Dot plot of the differential expression analysis of MSX genes in AS epithelium stratified by AS severity. AS Asherman’s syndrome, Epi epithelium, PV perivascular, UMAP uniform manifold approximation and projection.
Fig. 4
Fig. 4. Differential cell-to-cell communications between Asherman’s syndrome and control endometria.
A Chord plot displaying differentially active CCC comparing AS and control endometria. Arrows between cell types depict the direction of interactions. Relative thicknesses of red (AS) and green (Control) arrow lines represent the expression-based strength of the interaction between cell types. B Relative and absolute flows of differentially active signaling pathways between AS and control endometria (two-sided Wilcoxon test; FDR > 0.05). Blue dots = pathways involved in immune cell recruitment and inflammation. Red dots = pathways involved in ECM and fiber formation. CCC chord plots of C LAMININ, COLLAGEN, FN1, and D ICAM signaling pathways in AS and control endometria. Arrows follow the color code of cell types commonly detected in AS and control cartographies. E CCC chord diagrams of CCL signaling pathway in AS and control endometria (left panel). Ligands and receptors contributing to CCCs of the C-C motif chemokine ligand (CCL) signaling pathway (right panel). AS Asherman’s syndrome, DC dendritic cells, DN double negative, MAIT mucosal-associated invariant T, NK natural killer, PV perivascular, SMC smooth muscle cells.
Fig. 5
Fig. 5. Molecular profiling and refined cell-to-cell communication analysis of Asherman’s syndrome compared to control endometria during the window of implantation.
A Relative and absolute information flow for each differentially detected signaling pathway differentially detected in AS and WOI control endometria (two-sided Wilcoxon test, FDR > 0.05). Blue dots = immune system signaling pathways. Red dots = ECM- related pathways. Green dots = pathways involved in epithelial development. Cyan dots = pathways related to immune cell recruitment. Purple dots = signaling pathways of the WOI and decidualization processes. Orange dots = signaling pathways related to cell junctions and cellular unions. CCC chord diagrams displaying B IL6 (AS only), C SSP1, D CDH1, and E FGF signaling pathways in AS and WOI control endometria. AS Asherman’s syndrome, DC dendritic cells, DN double negative, Epi epithelial, FDR false discovery rate, MAIT mucosal-associated invariant T, NK natural killer, PV perivascular, SMC smooth muscle cells, WOI window of implantation.
Fig. 6
Fig. 6. Analysis of endometrial epithelial organoids derived from the window of implantation controls and Asherman´s syndrome patients.
A Scheme of EEO generation and analysis. B Representative images of EEOs generated from AS endometria (AS EEO, n = 3) at different passages (P0, 1, 2 = Passage 0, 1, 2) and WOI controls (Control EEO, n = 3). C UMAP integration of main cell types detected in EEOs derived from AS patient and WOI control endometria (AS EEOs, 14,459 cells; control EEOs, 15,594 cells). D Cell type distribution across groups in EEOs generated from AS patient and WOI control endometria. E Dot plot displaying the expression of selected genes that distinguish the main EEO cell populations. F Polygonal representation of cell-type identity probabilities predicted by a logistic model trained on epithelial cell subtypes from in vivo WOI samples. G Box plot prediction scores for each cell type and organoid group. H Differential gene expression dot plots for epithelial glandular subtypes in AS EEOs and control EEOs (two-sided Wilcoxon Rank Sum test; FDR < 0.05). Dunn test applied to evaluate differences between groups; two-side Dunn test was applied to evaluate differences between groups; p-values were adjusted using the Bonferroni method (n = 3 independent samples for each group); **p < 0.01; ****p < 0.0001. AS Asherman’s syndrome, EEO endometrial epithelial organoids, Epi epithelial, P passage.

References

    1. Dmowski WP, Greenblatt RB. Asherman’s syndrome and risk of placenta accreta. Obstet. Gynecol. 1969;34:288–299. - PubMed
    1. Public summary of opinion on orphan designation. Committee Orphan Medicinal Products (COMP). EMA/206895/2017 (2017).
    1. Conforti A, Alviggi C, Mollo A, Placido GD, Magos A. The management of Asherman syndrome: a review of literature. Reprod. Biol. Endocrinol. 2013;11:118. - PMC - PubMed
    1. Wallach EE, Schenker JG, Margalioth EJ. Intrauterine adhesions: an updated appraisal. Fertil. Steril. 1982;37:593–610. - PubMed
    1. Yu D, Wong Y-M, Cheong Y, Xia E, Li T-C. Asherman syndrome—one century later. Fertil. Steril. 2008;89:759–779. - PubMed

Publication types