. 2023 Sep 21;14(1):5871.
doi: 10.1038/s41467-023-41067-2.

The NCOR-HDAC3 co-repressive complex modulates the leukemogenic potential of the transcription factor ERG

Affiliations

The NCOR-HDAC3 co-repressive complex modulates the leukemogenic potential of the transcription factor ERG

Eitan Kugler et al. Nat Commun. .

Abstract

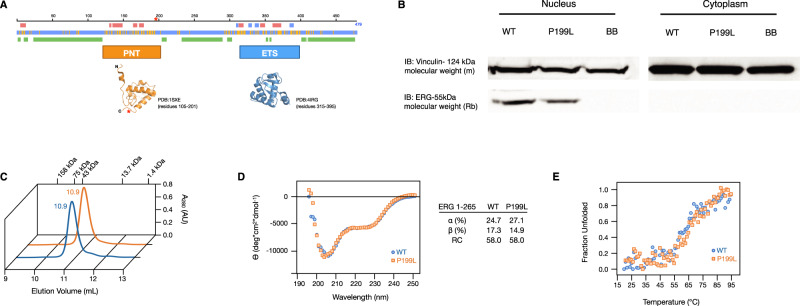
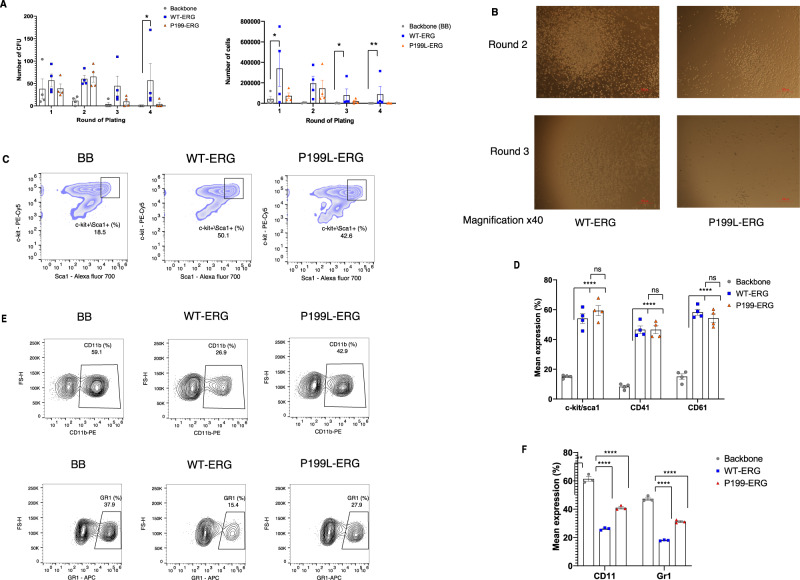
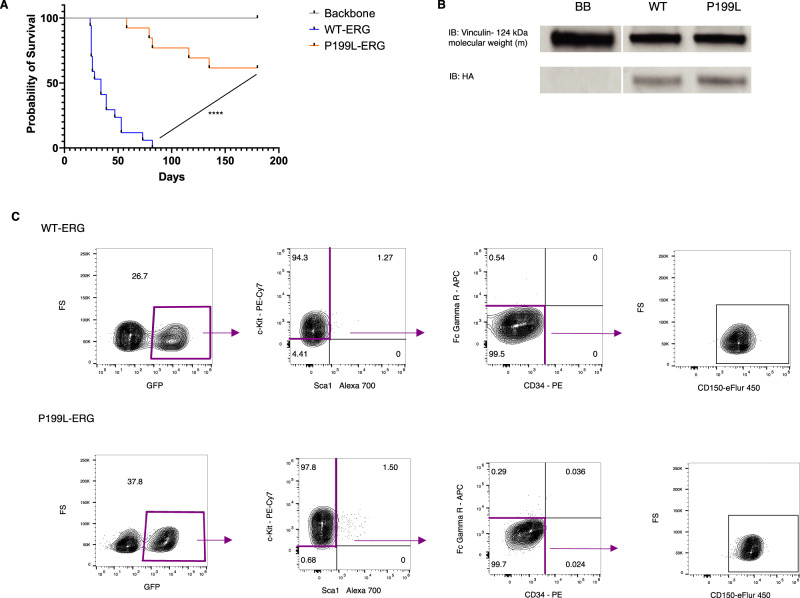
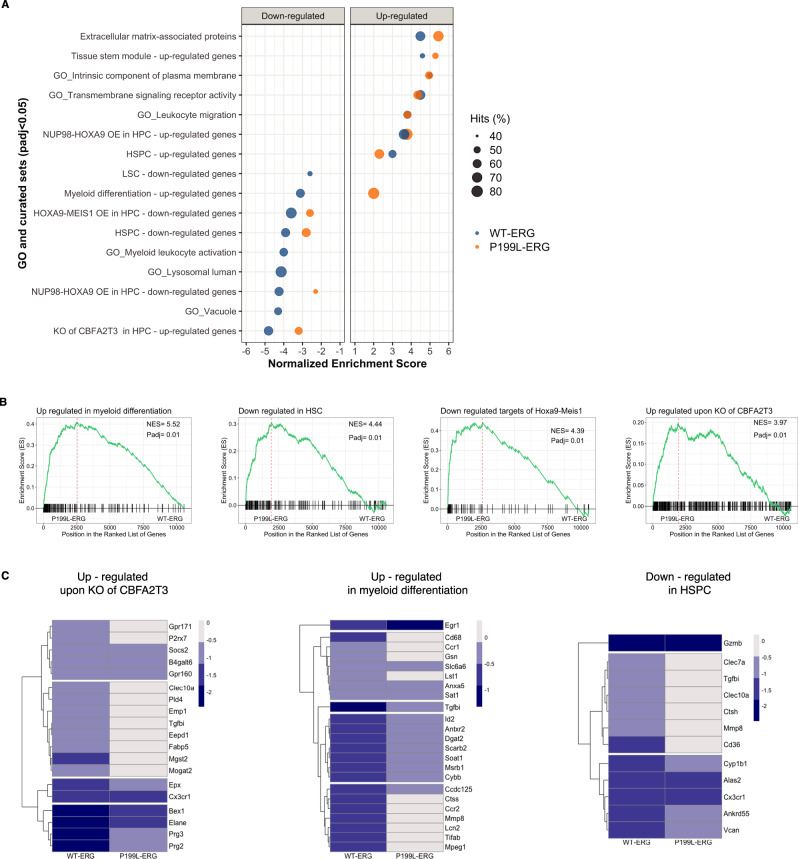
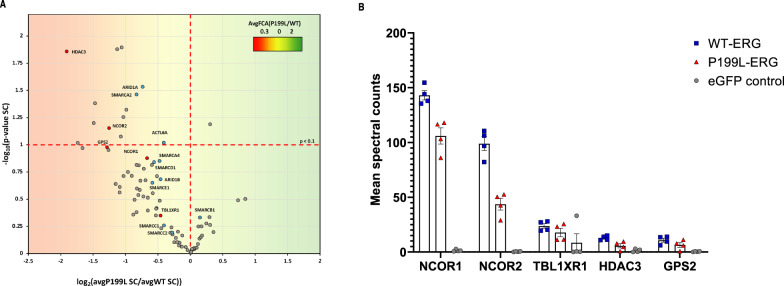
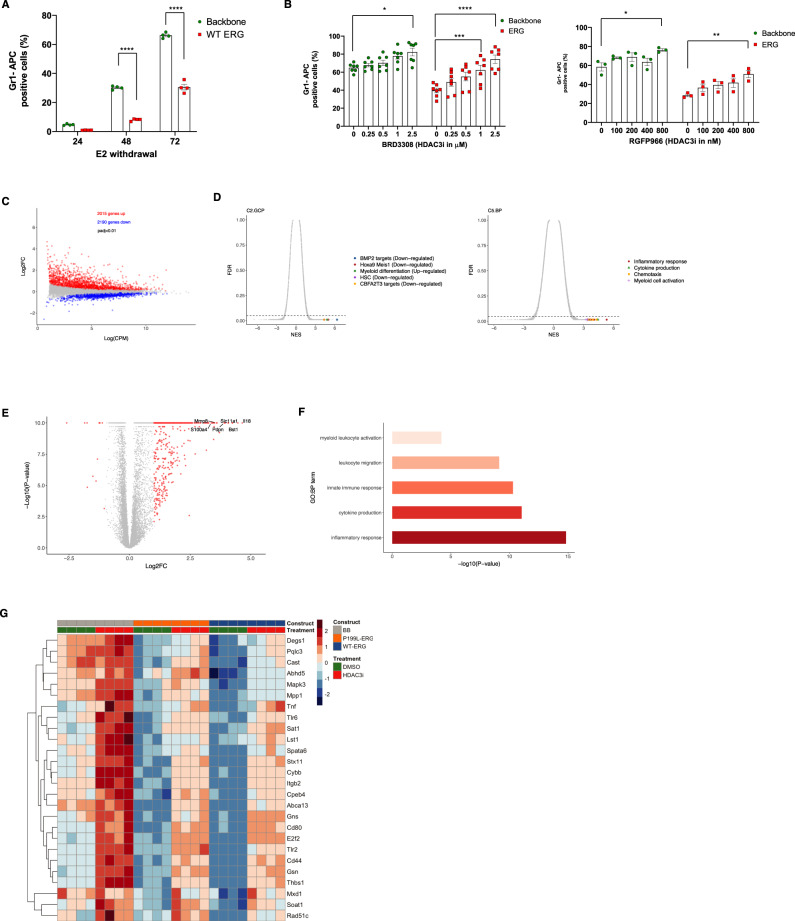
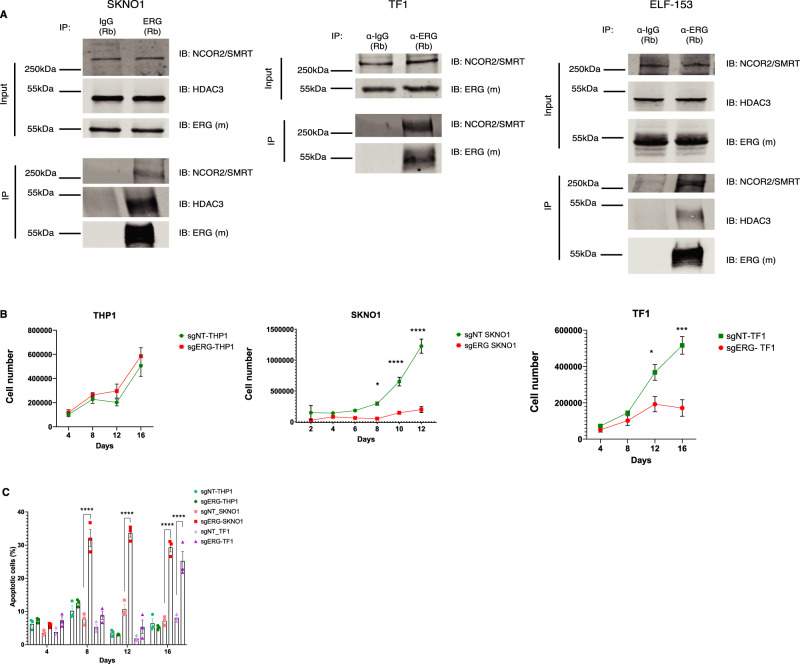
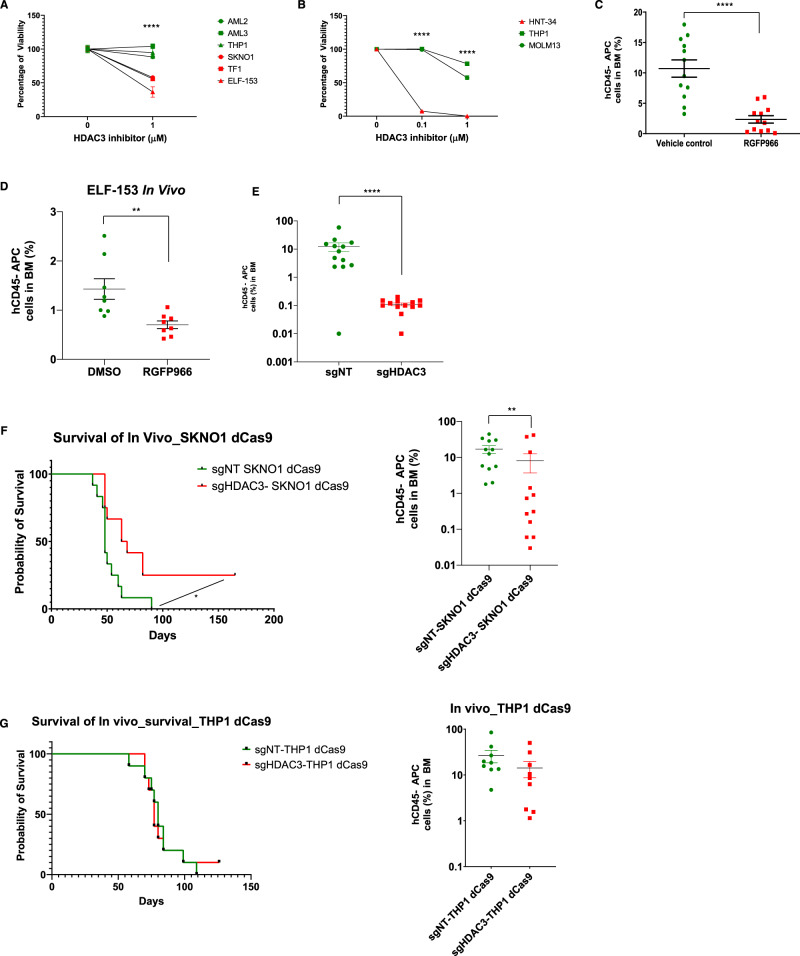
The ERG (ETS-related gene) transcription factor is linked to various types of cancer, including leukemia. However, the specific ERG domains and co-factors contributing to leukemogenesis are poorly understood. Drug targeting a transcription factor such as ERG is challenging. Our study reveals the critical role of a conserved amino acid, proline, at position 199, located at the 3' end of the PNT (pointed) domain, in ERG's ability to induce leukemia. P199 is necessary for ERG to promote self-renewal, prevent myeloid differentiation in hematopoietic progenitor cells, and initiate leukemia in mouse models. Here we show that P199 facilitates ERG's interaction with the NCoR-HDAC3 co-repressor complex. Inhibiting HDAC3 reduces the growth of ERG-dependent leukemic and prostate cancer cells, indicating that the interaction between ERG and the NCoR-HDAC3 co-repressor complex is crucial for its oncogenic activity. Thus, targeting this interaction may offer a potential therapeutic intervention.


Conflict of interest statement

The authors declare no competing interests.

Figures

Fig. 1
Fig. 1. P199L does not significantly affect the secondary structure or thermal stability of ERG.
A Sequence-based prediction of ERG, including secondary structure (red: helix, blue: beta-strand), solvent exposure (blue: exposed, yellow: buried), and disorder (green) (http://www.predictprotein.org). Experimentally determined structures of the ordered domains are also shown. Proline 199 is at the end of the PNT domain. B Immunoblot for FLAG in the nuclear and cytoplasmic fractions of CMK cells transduced with ERG variants. C Analytical size-exclusion chromatogram of the ERG constructs. Protein size standards are indicated. D Circular dichroism spectrum scan at 20 °C post-melt. E Circular dichroism spectrum collected at 226 nm in a temperature gradient. WT—Wild-type ERG, BB—Backbone. Source data are provided as a Source Data file.
Fig. 2
Fig. 2. P199L alleviates the effect of ERG forced expression on self-renewal and myeloid differentiation of HSPC.
A Re-plating assay in semi-solid conditions of murine fetal liver-derived HSPC transduced with ERG variants. The number of CFU (left panel) and total number of cells collected (right panel) per 104 cells plated is presented for each round of plating. Data is represented as mean ± SEM, two-way ANOVA, and Tukey’s multiple comparison test. The P-value for CFUgraph comparing BB vs. WT-ERG on round plating is 0.0398. n = 4 independent experiments in each experiment for each biological condition n = 1 biological independent sample. B Microscopic view of colonies morphology between groups. MagnificationX40. C Representative flow cytometry analysis of murine HSPC (c-Kit, Sca1) cell surface markers. D Summary bar graphs of flow cytometry analysis for the end of round one. n = 4 independent experiments in each experiment for each biological condition n = 1 biological independent sample. Data is represented as mean with SD, t-test, Mann–Whitney, unpaired. The P-value BB vs. WT-ERG/P199L for cKit/Sca1, CD41, and CD61 is <0.0001. E Representative flow cytometry analysis of myeloid differentiation using measurements for cell surface expression of CD11b and Gr-1 in fetal-liver-derived HSPC transduced with ERG variants. F Summary bar graphs of flow cytometry analysis right panel, n = 3 independent experiments in each experiment for each biological condition n = 1 biological independent sample. Data is represented as mean ± SEM, two-way ANOVA, and Tukey’s multiple comparison test. The P-value BB vs. WT-ERG/P199L for CD11b and Gr1 is <0.0001. CFU—Colony-forming units, * denotes P ≤ 0.05, ** denotes P ≤ 0.01, *** denotes P ≤ 0.001, **** denotes P ≤ 0.0001. Source data are provided as a Source Data file.
Fig. 3
Fig. 3. P199L severely disrupts ERG transforming capacity in vivo.
A Survival analysis of C57B/6 mice transplanted with murine fetal liver-derived HSPC following transduction with ERG variants (105 transduced cells/mouse). A log-rank test was used to compare survival distribution between groups. The P-value comparing WT-ERG vs. P199LERG is P < 0.0001. * denotes P ≤ 0.05, ** denotes P ≤ 0.01, *** denotes P ≤ 0.001, **** denotes P ≤ 0.0001. B Immunoblot of HA-tagged ERG to compare the levels of protein expression of WT and mutated ERG in the spleen of leukemic mice. C Immunophenotype of AML blasts (GFP+) from the bone marrow of leukemic mice. Source data are provided as a Source Data file.
Fig. 4
Fig. 4. P199L impedes ERG-mediated transcriptional gene repression in HSPC.
A Pathway and functional analysis of the gene expression profile of ERG variants against BB was performed using GSEA. Molecular pathways related to down and upregulated genes are presented separately. The absence of a circle implies no statistical significance enrichment for a particular gene set. A positive enrichment score refers to upregulated genes, and a negative score refers to downregulated genes (ERG variants against the backbone). The percentage of hits (“tags” in leading-edge analysis) is displayed to indicate the percentage of genes contributing to the enrichment score for each set of genes. B GSEA of upregulated genes (P199L-ERG against WT-ERG). C Most significant DEG (Padj < 0.05) contributing to the enrichment scores in A are shown for representative sets (ERG variants against BB). HSPC—hematopoietic stem and progenitor cells, LSC—leukemic stem cells. NES—Normalized enrichment score. DEG—differentially expressed genes. BB—backbone. Source data are provided as a Source Data file.
Fig. 5
Fig. 5. P199L disrupts the interaction of ERG with chromatin modifiers.
A Volcano plot comparing the spectral counts of identified interactors between FLAG-BirA-ERG WT and P199L. The background color indicates the prey FCA P199L/WT ratio. Significant proteins were selected with a P < 0.08 cutoff based on spectral count ratios. Notable proteins are colored according to molecular function. B Mean spectral counts for NCOR-HDAC3 hits (averaged between two biological replicates). Saint scores and bFDR are >0.8 and <0.05, respectively. FCA—fold-change. SC—spectral counts. Source data are provided as a Source Data file.
Fig. 6
Fig. 6. ERG affects chromatin modifications at myeloid-related gene loci.
A Global annotation statistics on the enrichment of ChIP signal of H3K27ac across groups. B Heatmap hierarchical clustering (left panel) and metagene plots (right panel) showing H3K27ac peaks of downregulated and hypoacetylated DEG following expression of WT-ERG force in Hoxb8 cells. C The intensity signal of normalized read counts of histone peaks is presented for genes identified in B (unpaired Wilcoxson test, P-value = 2.2 × 10−16). D GO analysis based on the nearest transcription start site to peaks identified in B. Adjusted P-values are displayed. E Heatmap hierarchical clustering centered on H3K27ac peaks associated with genes identified in B. The co-occupancy for H3K4me1, H3K4me3 and H3K9ac marks is shown. F Track example for two genes identified in B and D—Ly6c2 (Gr1) and Clec12a. Dashed black boxes indicate regions of H3K4me1 and H3K27ac overlap, and dashed red boxes indicate regions that relate to the transcription start site (H3K4me3, H3K9ac, and H3K27ac overlap). Source data are provided as a Source Data file.
Fig. 7
Fig. 7. HDAC3 inhibition alleviates the myeloid differentiation block induced by ERG forced expression in hematopoietic progenitor cells.
A Analysis of myeloid differentiation in human ERG-expressing ER-Hoxb8 cells. GR-1 percentage was measured using flow cytometry after withdrawal of beta-estradiol (E2). n = 10,000 cells were analyzed using flow cytometry for each biological independent sample for n = 4 independent experiments, data is represented as mean ± SEM, Two-way ANOVA, and Sidak’s multiple comparison test. The P-value comparing BB vs. WT-ERG at 48 and 72 h after E2 withdraws are P < 0.0001. B Analysis of myeloid differentiation of ER-Hoxb8 cells expressing human ERG following inhibition of HDAC3 with BRD3308 (left panel) and RGFP966 (right panel). n = 10,000 cells were analyzed for using flow cytometry for each biological independent sample for 7 independent experiments for BRD3008, n = 3 independent experiments for RGFP966. Data is represented as mean ± SEM for both BRD3008 and RGFP966, Two-way ANOVA, and Tukey’s multiple comparison test. The P-value comparing Backbone DMSO vs. Backbone BRD3308 (2.5 µM) is 0.0165. The P-value comparing ERG DMSO vs. ERG BRD3308 (1 µM) is 0.008. The P-value comparing ERG DMSO vs. ERG BRD3308 (2.5 µM) is <0.0001. The P-value comparing Backbone DMSO vs. Backbone RGFP966 (800 nM) is 0.0169. The P-value comparing ERG DMSO vs. ERG RGFP966 (800 nM) is 0.0023. C RNA sequencing in human ERG-expressing ER-Hoxb8 cells treated with either DMSO or 2.5 µM BRD3308. An MA plot illustrates the effect of BRD3308 treatment on gene expression. Differentially expressed genes (Padj < 0.05) are indicated. D GSEA of genetic and chemical perturbation (C2.CGP) and gene ontology biological process gene sets (C5.BP) following HDAC3 inhibition in human ERG-expressing ER-Hoxb8 cells. Most significant upregulated gene sets are indicated. E Most significant differentially expressed genes following HDAC3 inhibition in human ERG-expressing ER-Hoxb8 cells. Genes in red indicate log2 fold-change >1 and < − 1 and FDR < 0.01. F Gene Ontology on differentially expressed genes presented in E. G Gene expression matrix of myeloid differentiation-related genes in ER-Hoxb8 cells expressing ERG variants. DEG are presented (Padj < 0.05). CPM—counts per million. NES—Normalized enrichment score. FDR—false-discovery rate. DEG—differentially expressed genes. ns—non-significant, * denotes P ≤ 0.05, ** denotes P ≤ 0.01, *** denotes P ≤ 0.001, **** denotes P ≤ 0.0001.
Fig. 8
Fig. 8. Analysis of ERG dependency in leukemia cells with differential ERG expression.
A Co-IP assays in ERG-dependent AML cell lines. IP for endogenous ERG and blot for NCoR2/HDAC3. A representative figure of three independent experiments is shown. B Cell growth curves following ERG knockout using CRISPR-Cas9 system. Cells were counted by flow cytometry with a fixed volume of 60 µL in each condition out of 1 mL sample. n = 3 independent experiments in each experiment for each biological condition n = 1 biological independent sample. The P-values comparing sgNT-TF1 vs. sgERG-TF1 at days 12 and 16 are P = 0.008 and P < 0.0001, respectively. The P-values comparing sgNT-SKNO1 vs. sgERG-SKNO1 at days 8, 10, and 12 are P = 0.0225, P < 0.0001, and P < 0.0001 respectively. C Assessment of the degree of apoptosis as a function of cell type and days in culture. n = 10,000 cells were counted using flow cytometry over 3 independent experiments in each experiment n = 1 independent biological sample. Data are represented as mean ± SEM, two-way ANOVA, Tukey’s multiple comparison test. The P-values comparing sgNT-SKNO1 vs. sgERG-SKNO1 at days 8, 10, and 12 are P < 0.0001. The P-value comparing sgNT-TF1 vs. sgERG-TF1 at 16 is P < 0.0001.
Fig. 9
Fig. 9. Pharmacologic and genetic HDAC3 inhibition results in reduced cell growth in high ERG-expressing human AML cells in vitro and in vivo.
A HDAC3 inhibition using RGFP966 in low and high ERG-expressing AML cell lines. Mean number of cells relative to RGFP966 concentration 0 after 48 h in culture. n = 3 independent experiments in each experiment for each biological condition n = 1 biological independent sample, Data are represented as mean ± SEM, two-way ANOVA, Tukey’s multiple comparison test. The P-value comparing ERG-dependent vs. ERG-independent with HDAC3 inhibitor is P < 0.0001. B HDAC3 inhibition using RGFP966 in HNT-34 cells. Cells were counted by flow cytometry with a fixed volume of 60 µL in each condition out of 1 mL sample. n = 3 independent experiments in each experiment for each biological condition n = 1 biological independent sample, two-way ANOVA, Tukey’s multiple comparison test. The P-value comparing HNT34 against THP1 and MOLM-13 at 0.1 µM and 1 µM of RGP966 is P < 0.0001. C The effect of HDAC3 inhibition on SKNO1 cells in vivo. In one biological experiment, n = 12 animals in the treatment group (vehicle control or RGFP966), mean ± SEM, t-test, unpaired, Mann–Whitney. The bone marrow percentage of human CD45 cells was used to assess disease burden. The P-value comparing Vehicle control vs. RGFP966 group is P < 0.0001. D The effect of HDAC3 inhibition on ELF-153 cells in vivo. In one biological experiment, n = 7 animals in the vehicle group while n = 8 animals in the RGFP966 group, mean ± SEM, t-test, unpaired, Mann–Whitney. The bone marrow percentage of human CD45 cells was used to assess disease burden. The P-value comparing Vehicle control vs. RGFP966 group is P < 0.0011. E Inhibition of HDAC3 using CRISPR-dCas9 system in SKNO1 cells. The bone marrow percentage of human CD45 cells was used to assess disease burden. In one biological experiment, n = 12 animals in the treatment group (sgNT or sgHDAC3), mean ± SEM, t-test, unpaired, Mann–Whitney. The P-value comparing sgNT vs. the sgHDAC3 group is P < 0.0001. F Survival curve of NSG mice transplanted with SKNO1 cells after CRISPR-dCas9 targeting of HDAC3 (left panel, log-rank test, P-value = 0.0105). The percentage of bone marrow hCD45 cells as a measure of disease burden (right panel, mean ± SEM, t-test, unpaired, Mann–Whitney). In one biological experiment, n = 12 animals in the treatment group (sgNT or sgHDAC3). The P-value comparing sgNT-SKNO1 dCas9 vs. sgHDAC3-SKNO1 dCas9 group is P = 0.0098. G Survival curve of NSG mice transplanted with THP1 cells after CRISPR-dCas9 targeting of HDAC3 (left panel, n = 10 animals in each group). The percentage of bone marrow hCD45 cells as a measure of disease burden (right panel, flow cytometry analysis for n = 9 animals in each group, Wilcoxon test). In one biological experiment, n = 10 animals in the treatment group (sgNT or sgHDAC3). sgNT indicates non-targeting guide, * denotes P ≤ 0.05, ** denotes P ≤ 0.01, *** denotes P ≤ 0.001, **** denotes P ≤ 0.0001.

References

    1. Leprince D, et al. A putative second cell-derived oncogene of the avian leukaemia retrovirus E26. Nature. 1983;306:395–397. doi: 10.1038/306395a0. - DOI - PubMed
    1. Nunn MF, Seeburg PH, Moscovici C, Duesberg PH. Tripartite structure of the avian erythroblastosis virus E26 transforming gene. Nature. 1983;306:391–395. doi: 10.1038/306391a0. - DOI - PubMed
    1. Malinge S, Izraeli S, Crispino JD. Insights into the manifestations, outcomes, and mechanisms of leukemogenesis in Down syndrome. Blood. 2009;113:2619–2628. doi: 10.1182/blood-2008-11-163501. - DOI - PMC - PubMed
    1. Rao VN, Papas TS, Reddy ES. erg, a human ets-related gene on chromosome 21: alternative splicing, polyadenylation, and translation. Science. 1987;237:635–639. doi: 10.1126/science.3299708. - DOI - PubMed
    1. Loughran SJ, et al. The transcription factor Erg is essential for definitive hematopoiesis and the function of adult hematopoietic stem cells. Nat. Immunol. 2008;9:810–819. doi: 10.1038/ni.1617. - DOI - PubMed

Publication types