. 2023 Sep 21;21(1):647.
doi: 10.1186/s12967-023-04505-9.

Characterization of tumor microenvironment and tumor immunology based on the double-stranded RNA-binding protein related genes in cervical cancer

Affiliations

Characterization of tumor microenvironment and tumor immunology based on the double-stranded RNA-binding protein related genes in cervical cancer

Jin Li et al. J Transl Med. .

Abstract

Background: Cervical cancer is one of the most common gynecological cancers threatening women's health worldwide. Double-stranded RNA-binding proteins (dsRBPs) regulate innate immunity and are therefore believed to be involved in virus-related malignancies, however, their role in cervical cancer is not well known.

Methods: We performed RNA-seq of tumor samples from cervical cancer patients in local cohort and also assessed the RNA-seq and clinical data derived from public datasets. By using single sample Gene Set Enrichment Analysis (ssGSEA) and univariate Cox analysis, patients were stratified into distinct dsRBP clusters. Stepwise Cox and CoxBoost were performed to construct a risk model based on optimal dsRBPs clusters-related differentially expressed genes (DEGs), and GSE44001 and CGCI-HTMCP-CC were employed as two external validation cohorts. Single cell RNA sequencing data from GSE168652 and Scissor algorithm were applied to evaluated the signature-related cell population.

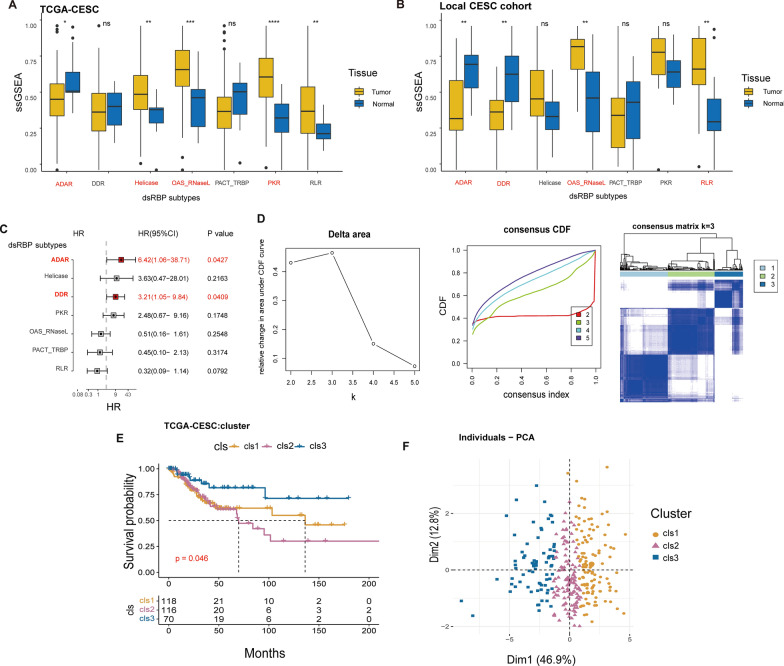
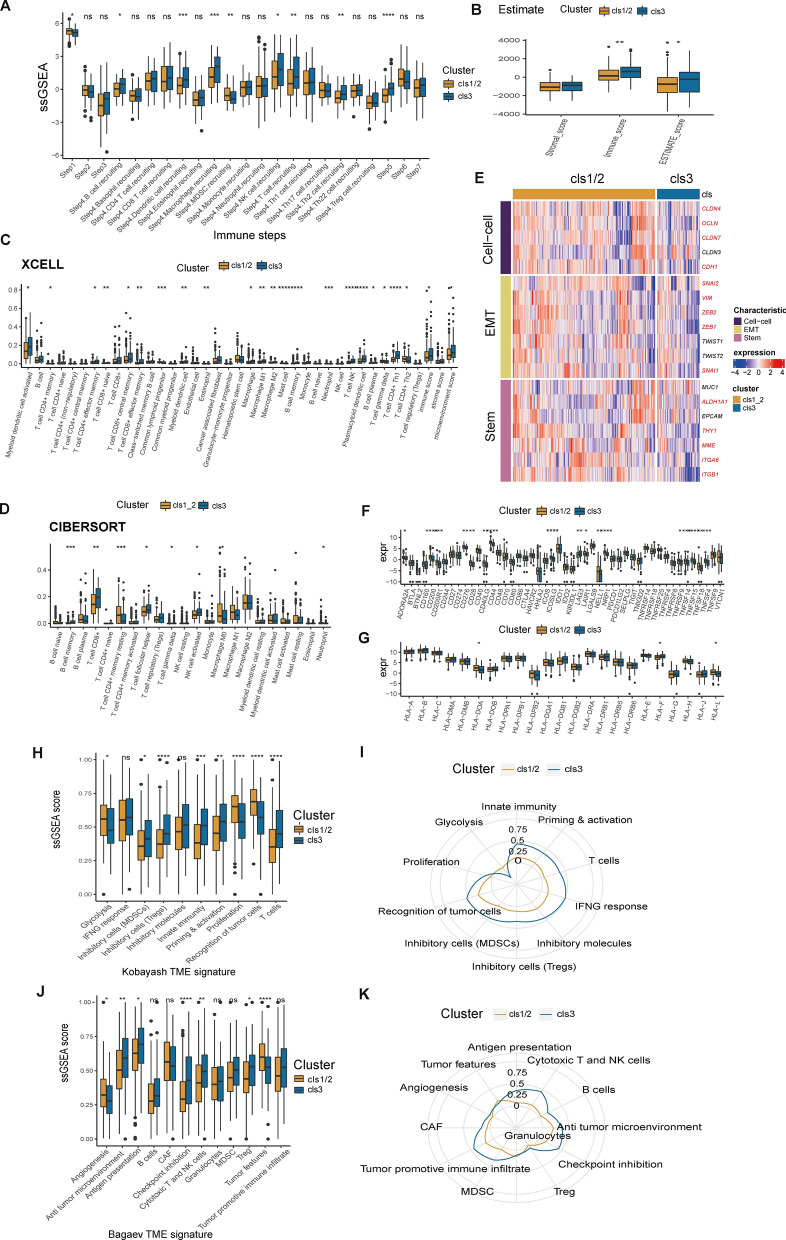
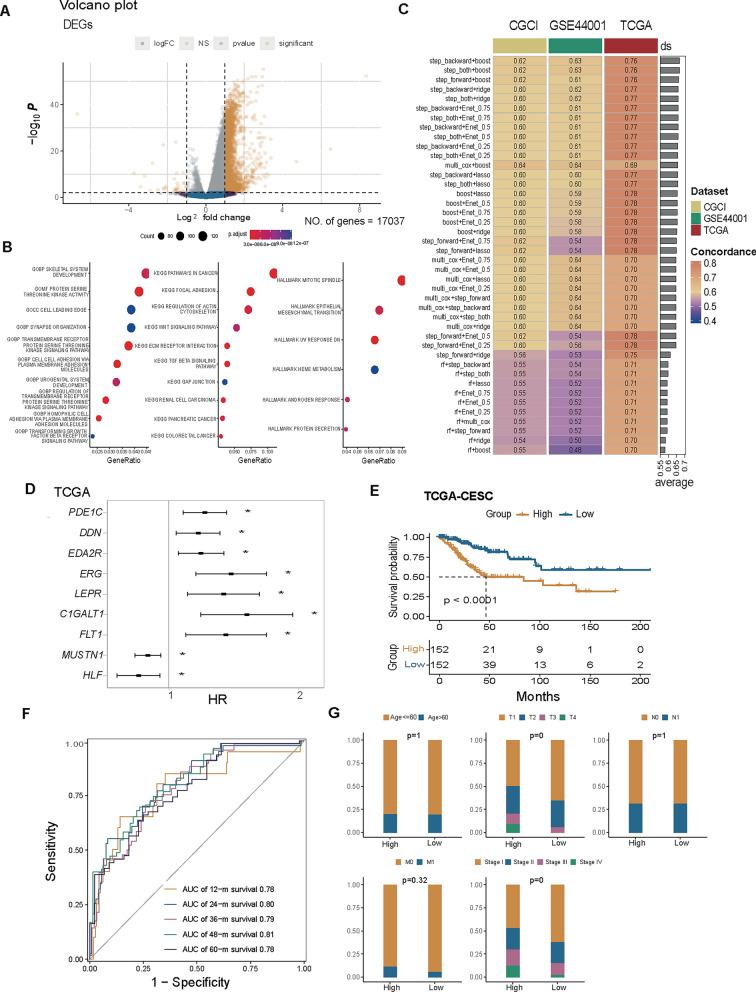
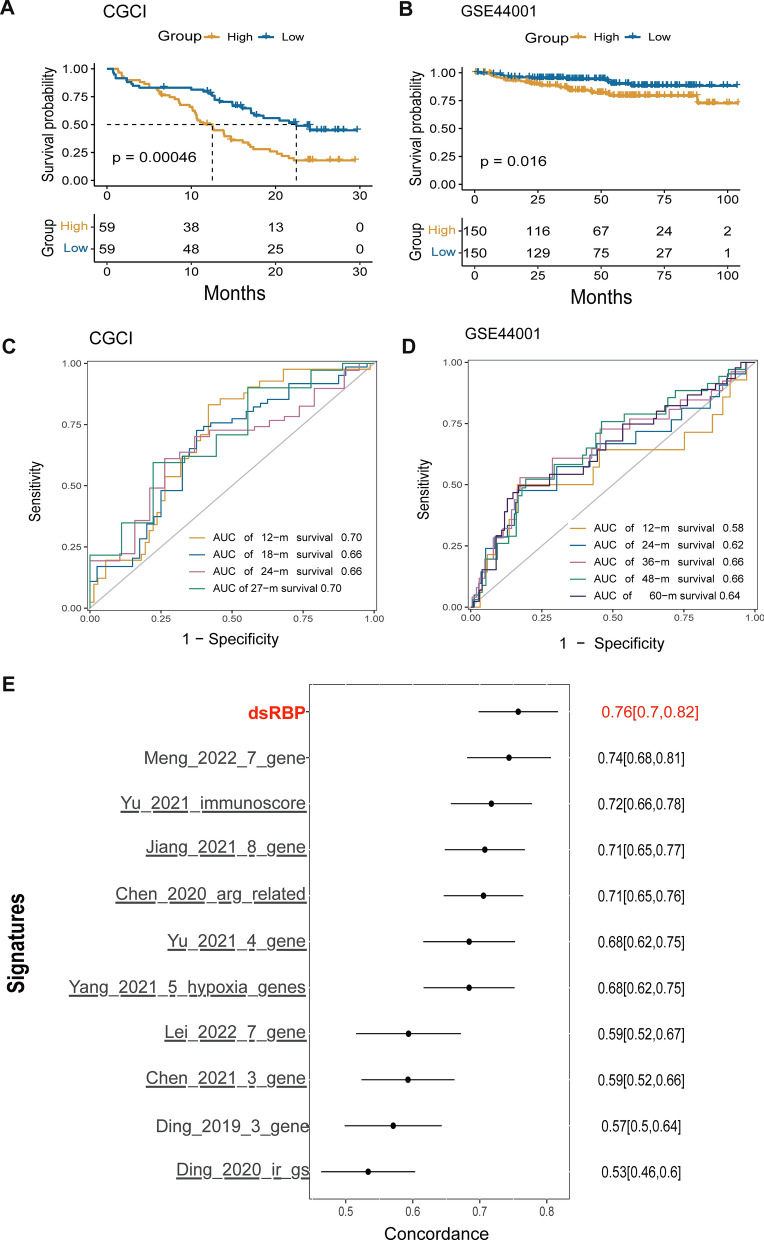
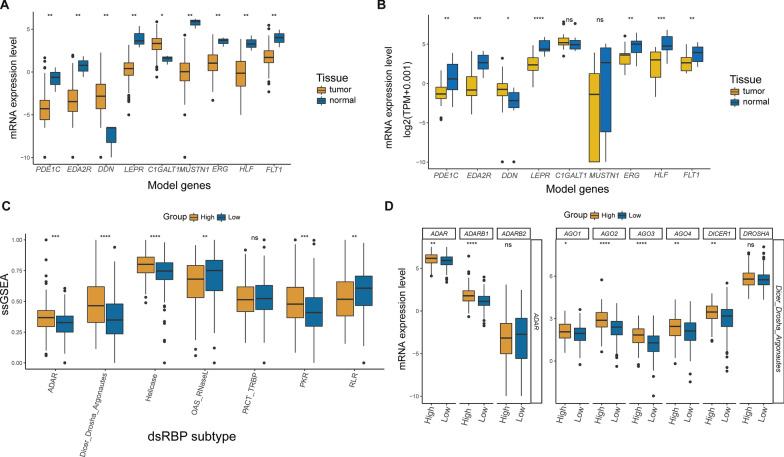
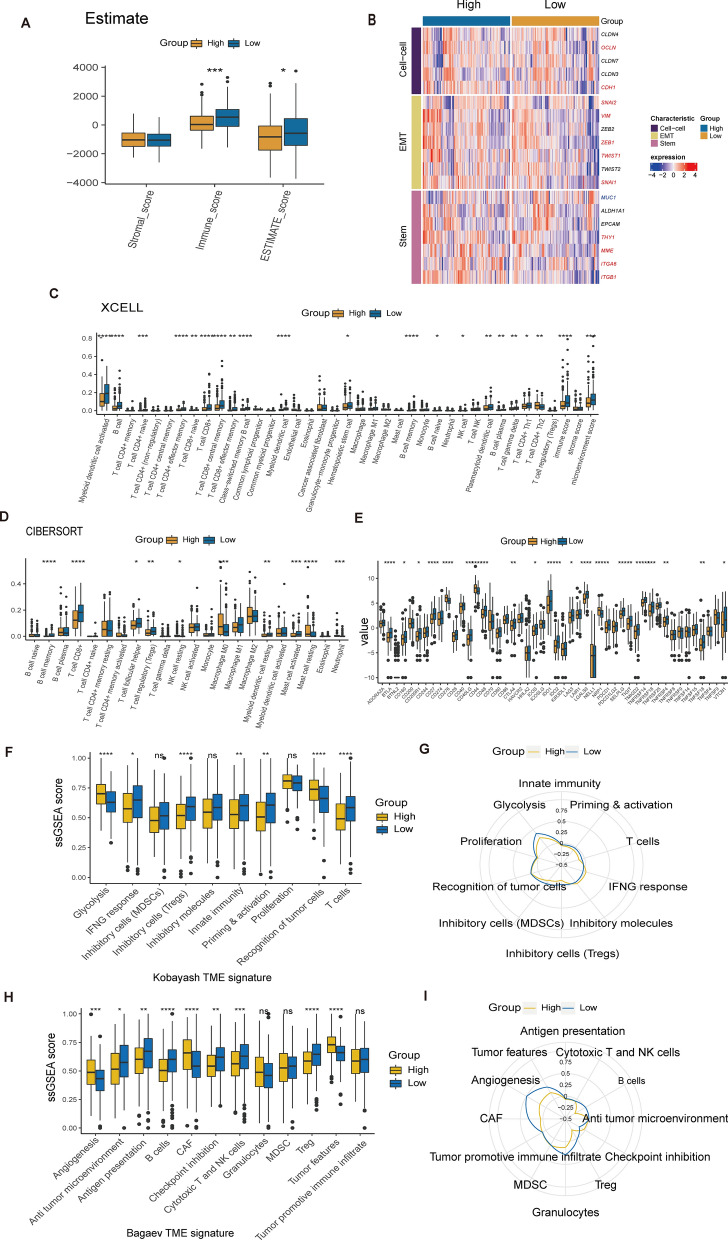
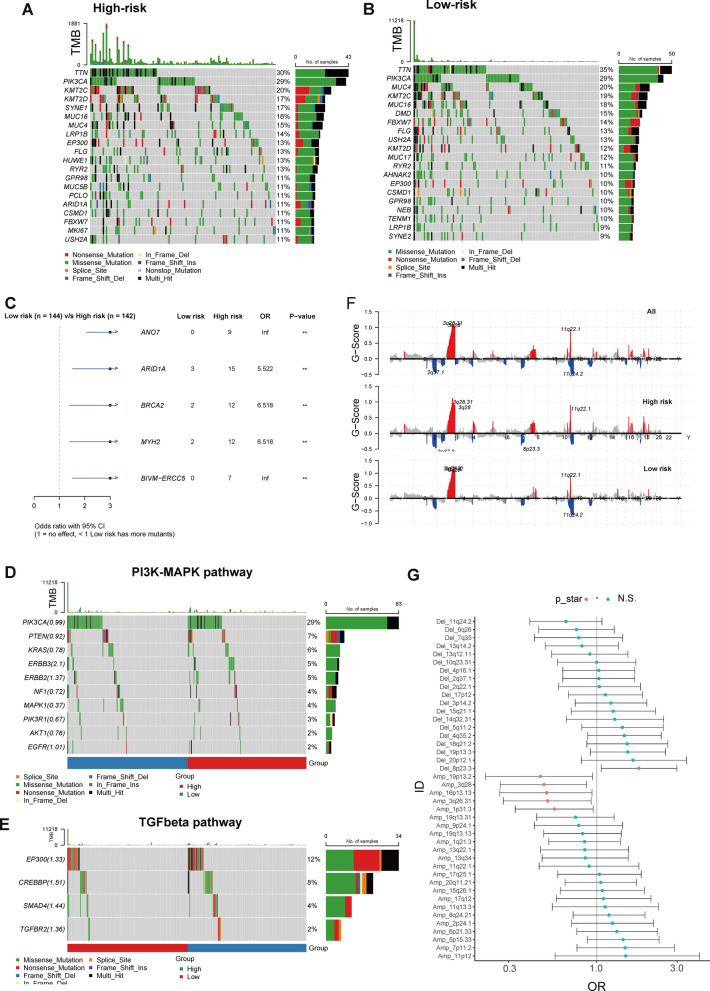
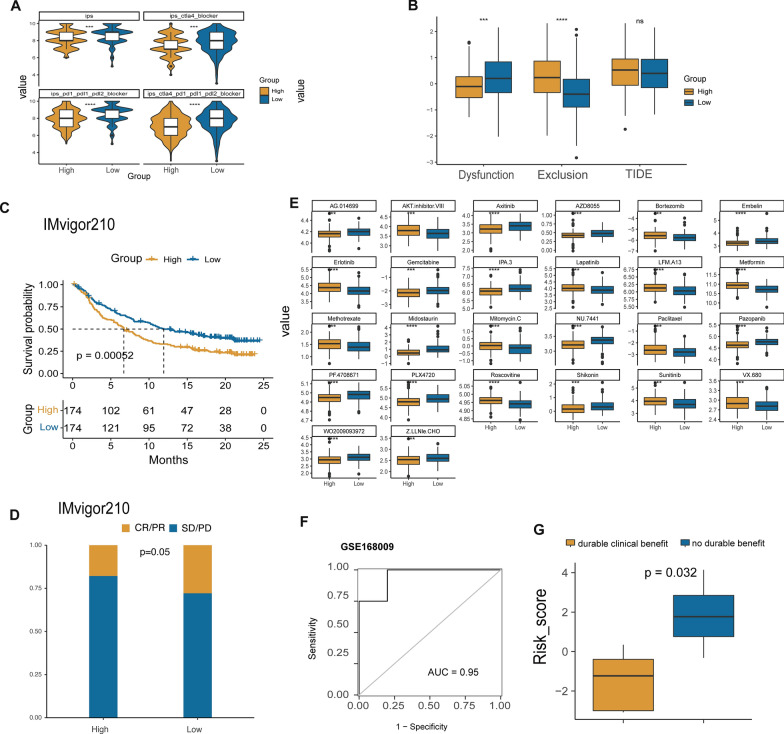
Results: The expression of dsRBP features was found to be associated with HPV infection and carcinogenesis in CESC. However, only Adenosine deaminases acting on RNA (ADAR) and Dicer, Drosha, and Argonautes (DDR) exhibited significant correlations with the overall survival (OS) of CESC patients. Based on these findings, CESC patients were divided into three dsRBP clusters. Cluster 3 showed superior OS but lower levels of ADAR and DDR. Additionally, Cluster 3 demonstrated enhanced innate immunity, with significantly higher activity in cancer immunity cycles, immune scores, and levels of tumor-infiltrating immune cells, particularly CD8+ T cells. Furthermore, a risk model based on nine dsRBP cluster-related DEGs was established. The accuracy of survival prediction for 1 to 5 years was consistently above 0.78, and this model's robust predictive capacity was confirmed by two external validation sets. The low-risk group exhibited significantly higher levels of immune checkpoints, such as PDCD1 and CTLA4, as well as a higher abundance of CD8+ T cells. Analysis of single-cell sequencing data revealed a significant association between the dsRBP signature and glycolysis. Importantly, low-risk patients showed improved OS and a higher response rate to immunotherapy, along with enduring clinical benefits from concurrent chemoradiotherapy.

Conclusions: dsRBP played a crucial role in the regulation of prognosis and tumor immunology in cervical cancer, and its prognostic signature provides a strategy for risk stratification and immunotherapy evaluation.

Keywords: Cervical cancer; Chemotherapy; Immunotherapy; Risk model; Tumor microenvironment; dsRBP.


Conflict of interest statement

The authors declare that they have no competing interests.

Figures

Fig. 1
Fig. 1
Identification of dsRBPs expression patterns in cervical cancer. Expression levels of dsRBPs in tumor (n = 307) and normal tissues (n = 3) in TCGA-CESC cohort (A) and FUSCC cohort (normal, n = 15; cancer, n = 15) (B). C The forest plot depicted the dsRBPs that were correlated with the OS of cervical cancer. D Consensus clustering of ADAR and DDR in the TCGA-CESC cohort. E Kaplan–Meier survival curve of the differences in the three clusters regarding OS (cluster 1, n = 118; cluster 2, n = 116; cluster 3, n = 70). F PCA of three clusters. dsRBPs: double-stranded RNA-binding proteins, OS overall survival, ADAR adenosine deaminases acting on RNA, DDR Dicer, Drosha, and Argonautes, PCA principal components analysis. *p < 0.05; ** p < 0.01; ***p < 0.001; ****p < 0.0001; ns: nonsignificant
Fig. 2
Fig. 2
Evaluation of dsRBPs expression in different clusters. A Estimation of the ssGSEA scores of seven dsRBPs between cluster 1/2 and 3 (cluster 1/2, n = 234; cluster 3, n = 70). B Boxplot showed the different expression levels of ADAR and DDR subfamily members between different clusters. ssGSEA single sample Gene Set Enrichment Analysis. *p < 0.05; **p < 0.01; ***p < 0.001; ****p < 0.0001; ns: nonsignificant
Fig. 3
Fig. 3
Relationship between dsRBP clusters and TME. A Comparison of cancer immune cycle steps between cluster 1/2 and 3 (cluster 1/2, n = 234; cluster 3, n = 70). B The stromal score, immune score, and ESTIMATE score of cluster 1/2 and 3. Differences in TIICs enrichment applied by XCELL (C) and CIBERSORT (D) between distinct clusters. E Hub genes involved in the three characteristics were compared across clusters by heat map. The expression levels of 48 immune checkpoints (F) and HLA family genes (G) between cluster 1/2 and 3. The ssGSEA value (H) and immunogram radar plot (I) revealed the relationship between distinct clusters and TME signatures generated by Kobayash. The ssGSEA value (J) and immunogram radar plot (K) revealed the relationship between distinct clusters and TME signatures generated by Bagaev. TME tumor microenvironment, TIICs tumor infiltrating immune cells, HLA human leukocyte antigen. *p < 0.05; **p < 0.01; ***p < 0.001; ****p < 0.0001; ns: nonsignificant
Fig. 4
Fig. 4
Genomic alterations in cervical cancer associated with dsRBP clusters. A Oncoprint plot revealing genomic feature in different dsRBP clusters (cluster 1/2, n = 222; cluster 3, n = 64). Eighteen samples in the TCGA-CESC cohort were excluded due to missing genomic sequencing data. B The difference in the prevalent genes between different dsRBP clusters. Genomic alterations within PI3K-MAPK (C) and TGFβ (D) pathways. *p < 0.05; **p < 0.01
Fig. 5
Fig. 5
DEGs collection and risk model generation. A The volcano plot showed the down-regulated and up-regulated dsRBP cluster-associated DEGs. B Functional enrichment analysis of DEGs. C There were 42 combinations of machine learning algorithms for the risk model in CGCI-HTMCP-CC, GSE44001, and TCGA-CESC datasets. D The association between signature genes and the OS of cervical cancer in the TCGA-CESC cohort (high-risk group: n = 152; low-risk group, n = 152). E Kaplan–Meier curve of cervical cancer patients in TCGA-CESC dataset. F ROC curve and AUC of 12-, 24-, 36-, 48- and 60-month survival in TCGA-CESC cohort. G The relationship between clinic variables and two groups, including age, T stage, N stage, M stage, and neoplasm disease stage. DEGs differentially expressed genes, ROC receiver operating characteristic, AUC area under the curve. *p < 0.05
Fig. 6
Fig. 6
The validation of the risk model for predicting the prognosis of cervical cancer. Survival analysis showing the OS of cervical cancer patients in the CGCI-HTMCP-CC dataset (high-risk group: n = 59; low-risk group, n = 59, A) and the DFS of cervical cancer patients in the GSE44001 dataset (high-risk group: n = 150; low-risk group, n = 150, B). C The AUCs for 12-, 18-, 24-, and 27-month ROC in the CGCI-HTMCP-CC cohort. D The AUCs for 12-, 24-, 36-, 48- and 60-month ROC in the GSE44001 cohort. E Comparison of the predictive ability of the dsRBP signatures with 10 previously reported risk models for cervical cancer. DFS disease-free survival
Fig. 7
Fig. 7
Analysis of the expression profiles of risk model-related genes and dsRBP subtypes. Nine signature-related genes were differentially expressed between cancer and normal tissues in TCGA-CESC (normal, n = 3; cancer, n = 307; A) and local FUSCC cohort (normal, n = 15; cancer, n = 15; B). C The ssGSEA scores of dsRBPs subtypes between high- and low-risk groups. D The expression level of ADAR-related and DDR-related genes between two groups (high-risk group: n = 152; low-risk group, n = 152). *p < 0.05; **p < 0.01; ***p < 0.001; ****p < 0.0001; ns: nonsignificant
Fig. 8
Fig. 8
Profiling the cell subpopulation associated with dsRBP signature. A Difference in the expression level of hub genes in different cell types from GSE168652 dataset. B UMAP visualization of the Scissor-selected cells. The red and blue dots are Scissor+ and Scissor− cells, which were associated with the dsRBP signature or not, respectively. Distribution of Scissor+ (C) and Scissor− cells (D) among various cell types. E pathway enrichment of differentially expressed genes between Scissor+ and Scissor− cells by HALLMARK and KEGG analysis
Fig. 9
Fig. 9
The evaluation of high- and low-risk groups in TME. A The stromal score, immune score, and ESTIMATE score of the two groups (high-risk group: n = 152; low-risk group, n = 152). B The heat map exhibited the difference between high- and low-risk groups in the hub genes involved in the three features. Differences in TIICs enrichment performed by two algorithms, including XCELL (C) and CIBERSORT (D). E The expression levels of immune checkpoints between high- and low-risk groups. The ssGSEA score (F) and immunogram radar plot (G) displayed the association between two groups and TME signatures constructed by Kobayash. The ssGSEA score (H) and immunogram radar plot (I) displayed the association between two groups and TME signatures constructed by Bagaev. *p < 0.05; **p < 0.01; ***p < 0.001; ****p < 0.0001; ns: nonsignificant
Fig. 10
Fig. 10
Identification of genetic mutations underlying the risk model. The waterfall plots of the high-risk group (n = 144, A) and low-risk group (n = 142, B) in the TCGA cohort. C Top 5 frequently mutated genes in high- and low-risk groups. Gene mutations in the PI3K-MAPK (D) and TGFβ (E) pathways. F Focal peaks showed CNV types: red (amplification) and blue (deletion). G The incidence of amplification or deletion of genomic regions in the high- and low-risk groups. CNV copy number variation. *p < 0.05; **p < 0.01
Fig. 11
Fig. 11
Predictive capacity of the signature in immunotherapy response and chemosensitivity. A IPS difference between high- and low-group with different statuses of CTLA-4, PD-1, PD-L1, and PD-L2 (high-risk group: n = 152; low-risk group, n = 152). B The difference in T cells dysfunction score, T cells exclusion score, and TIDE score between the two groups. C Difference in the overall survival between high- and low-risk groups in the IMvigor210 dataset. D Difference in the objective response rate between high- and low-risk group in the IMvigor210 dataset (high-risk group: n = 174; low-risk group, n = 174). E Chemotherapy drugs in cervical cancer with distinct IC50 values between the two groups. F AUC value in GSE168009 cohort. G Response to CCRT based on risk score in GSE168009 cohort (durable clinical benefit, n = 5; no durable benefit, n = 4). IPS immunophenoscore, TIDE tumor immune dysfunction and exclusion, IC50 half-maximum inhibitory concentration, CCRT concurrent chemoradiotherapy, CR complete response, PR partial response, SD stable disease, PD progression dsiease. ***p < 0.001; ****p < 0.0001; ns: nonsignificant

Similar articles

Cited by

References

    1. Sung H, Ferlay J, Siegel RL, Laversanne M, Soerjomataram I, Jemal A, et al. Global cancer statistics 2020: GLOBOCAN estimates of incidence and mortality worldwide for 36 cancers in 185 countries. CA Cancer J Clin. 2021;71(3):209–249. doi: 10.3322/caac.21660. - DOI - PubMed
    1. Melnikow J, Henderson JT, Burda BU, Senger CA, Durbin S, Weyrich MS. Screening for cervical cancer with high-risk human papillomavirus testing: updated evidence report and systematic review for the US Preventive Services Task Force. JAMA. 2018;320(7):687–705. doi: 10.1001/jama.2018.10400. - DOI - PubMed
    1. Molina MA, Coenen BA, Leenders WPJ, Andralojc KM, Huynen MA, Melchers WJG. Assessing the cervicovaginal microbiota in the context of hrHPV infections: temporal dynamics and therapeutic strategies. MBio. 2022;13:e0161922. doi: 10.1128/mbio.01619-22. - DOI - PMC - PubMed
    1. Curry SJ, Krist AH, Owens DK, Barry MJ, Caughey AB, Davidson KW, et al. Screening for cervical cancer: US Preventive Services Task Force recommendation statement. JAMA. 2018;320(7):674–686. doi: 10.1001/jama.2018.10897. - DOI - PubMed
    1. Cohen PA, Jhingran A, Oaknin A, Denny L. Cervical cancer. Lancet. 2019;393(10167):169–182. doi: 10.1016/s0140-6736(18)32470-x. - DOI - PubMed

Publication types