. 2023 Oct;26(10):1805-1819.
doi: 10.1038/s41593-023-01430-4. Epub 2023 Sep 21.

Somatostatin neurons in prefrontal cortex initiate sleep-preparatory behavior and sleep via the preoptic and lateral hypothalamus

Affiliations

Somatostatin neurons in prefrontal cortex initiate sleep-preparatory behavior and sleep via the preoptic and lateral hypothalamus

Kyoko Tossell et al. Nat Neurosci. 2023 Oct.

Erratum in

Abstract

The prefrontal cortex (PFC) enables mammals to respond to situations, including internal states, with appropriate actions. One such internal state could be 'tiredness'. Here, using activity tagging in the mouse PFC, we identified particularly excitable, fast-spiking, somatostatin-expressing, γ-aminobutyric acid (GABA) (PFCSst-GABA) cells that responded to sleep deprivation. These cells projected to the lateral preoptic (LPO) hypothalamus and the lateral hypothalamus (LH). Stimulating PFCSst-GABA terminals in the LPO hypothalamus caused sleep-preparatory behavior (nesting, elevated theta power and elevated temperature), and stimulating PFCSst-GABA terminals in the LH mimicked recovery sleep (non-rapid eye-movement sleep with higher delta power and lower body temperature). PFCSst-GABA terminals had enhanced activity during nesting and sleep, inducing inhibitory postsynaptic currents on diverse cells in the LPO hypothalamus and the LH. The PFC also might feature in deciding sleep location in the absence of excessive fatigue. These findings suggest that the PFC instructs the hypothalamus to ensure that optimal sleep takes place in a suitable place.


Conflict of interest statement

The authors declare no competing interests.

Figures

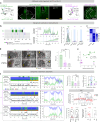
Fig. 1
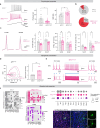
Fig. 1. SD, nesting behavior, RS and corresponding changes in core body temperature.
a, Example EEG–EMG traces and sleep stage state and mean core body temperature during SD and RS and post-SD nesting activity and nest materials in the home cage. N = 7 VgatCre mice, baseline versus SD, P = 4.78 × 10−4 (ZT 0–5), P = 1.12 × 10−3 (ZT 5–6) with two-way repeated-measures (RM) ANOVA with Bonferroni correction. Freq, frequency. b, Raster plot of RS nesting, example nest image in the home cage and relative EEG spectrum. Red raster and solid black bars indicate nesting and onset of first consolidated NREM RS. Yellow dot, position of mouse; dashed red line, outline of nesting materials; solid red line, outline of nest. N, number of biologically independent mice. ***P < 0.001. Mean (line) ± s.e.m. (shading). See also Extended Data Figs. 1 and 2. DP, dark period.
Fig. 2
Fig. 2. Opto-activation of activity-tagged PFC GABAergic neurons promotes nesting behavior and NREM sleep.
a, Tagged ChR2–EYFP expression in Vgat-PFC-ChR2-Tag:SD, Vgat-PFC-ChR2-Tag:Ctrl (Tag:Ctrl) and Vgat-VC-ChR2-Tag:SD mice. Cohorts of PFC mice, n = 10 sessions, N = 7 mice; VC mice, n = 6 sessions, N = 5 mice; control mice, n = 10 sessions; a mix of Tag:Ctrl (N = 4) and Vgat-PFC-GFP (N = 4) mice was used in all panels in this figure, unless otherwise specified. b, Nesting activity of optostimulated Vgat-PFC-ChR2-Tag:SD (PFC), Vgat-VC-ChR2-Tag:SD (VC) and control mice. Left: opto-evoked nesting activity of each cohort. Middle: accumulative time nesting from initiation of optostimulation (ZT 18, t = 0 min). Control versus PFC, P = 2.10 × 10−55; control versus VC, P = 4.95 × 10−1 with the mixed-effects model. Mean (line) ± s.e.m. (shading). Right: percentage of time in nesting activity before, during and after optostimulation. PFC, before versus during (stim), P = 0.002; PFC, before versus after, P = 0.0313 with two-tailed Wilcoxon matched-paired signed-rank test. Mean (bars) and before–after individual plot (lines). Blue shading, optostimulation. c, Occurrence of consolidated nesting activity during optostimulation. d, Nest images before and after optostimulation in all cohorts and nest scores. Yellow dot, mouse position; dashed red line, nesting materials; solid red line, nest. PFC (n = 7 sessions) versus control (n = 8 sessions), P = 0.0002; PFC versus VC (n = 5 sessions), P = 0.0025 with two-sided Mann–Whitney U-test. e, Correlation of nest scores and time in nesting activity (two-sided Spearman correlation coefficient). f, Left: EEG–EMG traces, nesting activity and sleep stage state, time course of vigilance states. Mouse cohorts are color coded as in b. Top right: sleep latency and percentage of NREM sleep before and during optostimulation. PFC versus control, P = 0.3204; PFC versus VC, P = 0.1616 with two-sided Mann–Whitney U-test for sleep latency and PFC before versus stim, P = 0.0039; PFC, before versus after, P = 0.027 with two-tailed Wilcoxon matched-paired signed-rank test for percent NREM sleep. Middle right: time course of changes in percent delta and theta EEG power against the respective mean baseline (t = minus 60 min to 0 min) of Vgat-PFC-ChR2-Tag:SD mice before and during optostimulation. Delta versus theta, P = 1.50 × 10−3 (t = 0–16 min), P = 6.77 × 10−5 (t = 32–48 min), P = 2.10 × 10−5 (t = 30–75 min) with two-way RM ANOVA with Bonferroni correction. Bottom right: percent duration and change in percent EEG power of nesting and NREM sleep and theta and delta power of Vgat-PFC-ChR2-Tag:SD mice before and during optostimulation. Percent duration (before versus first block, P = 0.002 (nest), P = 0.0488 (NREM); before versus second block, P = 0.0156 (nest), P = 0.002), percent power (P = 0.0137 (theta), P = 0.0039 (delta)) with two-tailed Wilcoxon matched-paired signed-rank test. ‘t = 0’, start of optostimulation (blue shading); n, number of independent four-bout optostimulation sessions; NS, not significant, P ≥ 0.05; *P < 0.05; **P < 0.01; ***P < 0.001; ****P < 0.0001. Mean (line) ± s.e.m. (shading) in time courses, individual plots (circle), mean (bar or circle) ± s.e.m. (error bar) in bar graphs. See also Extended Data Figs. 1–4. PL, prelimbic cortex; IL, infralimbic cortex; AC, auditory cortex. Scale bars, 1,000 µm (a, white), 100 µm (a, yellow).
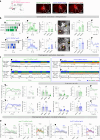
Fig. 3
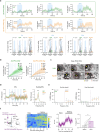
Fig. 3. Pharmacogenetic reactivation of tagged GABAergic and Sst-expressing neurons in the PFC induces nesting and NREM sleep.
a, Activity-tagged Vgat-, Sst- and Nos1-expressing PFC neurons during SD, nesting activity and RS. Cohorts of Vgat-PFC-hM3Dq-Tag:SD mice, n = 8 paired sessions, N = 8 mice; Sst-PFC-hM3Dq-Tag:SD mice, n = 12 paired sessions, N = 12 mice; Nos1-PFC-hM3Dq-Tag:SD mice, n = 8 paired sessions, N = 8 mice in all panels in this figure, unless specified. b, Opto-evoked nesting activity of Vgat-PFC-hM3Dq-Tag:SD and Sst-PFC-hM3Dq-Tag:SD mice (same mice as in a) during the first hour after i.p. injection until the first consolidated sleep (solid black line). i.p. injection of saline and CNO (5 mg per kg, CNO(5); 1 mg per kg, CNO(1)) was at ZT 18 (t = 0, solid arrowhead). Other panels, from left to right, time course of percent time spent nesting (saline versus CNO(5), P = 0.0394 (Vgat), P = 0.0178 (Sst); saline versus CNO(1), P = 2.52 × 10−5 (Vgat), P = 0.262 (Sst) with two-way RM ANOVA and Bonferroni correction), nesting duration (saline versus CNO(5), P = 0.0156 (Vgat), P = 0.0039 (Sst); saline versus CNO(1), P = 0.0156 (Vgat), P = 0.002 (Sst) with two-tailed Wilcoxon matched-paired signed-rank test), representative nest images at ZT 19 (1 h after i.p. injection) (yellow dot, mouse in the cage; dashed red line, nest material outline; solid red line, nest), quantification of nest scores (saline versus CNO(5), P = 0.0078 (Vgat), P = 0.0039 (Sst); saline versus CNO(1), P = 0.0313 (Vgat), P = 0.001 (Sst) with two-tailed Wilcoxon matched-paired signed-rank test), time course of relative (rel.) theta EEG power (saline versus CNO(5) and CNO(1), P = 0.0039 (Vgat), P = 0.0156 (Sst) with two-tailed Wilcoxon matched-paired signed-rank test). c, EEG–EMG traces and sleep stage state of Vgat-PFC-hM3Dq-Tag:SD and Sst-PFC-hM3Dq-Tag:SD mice after saline or CNO(5) i.p. injection. Other panels, from left to right (P values with two-tailed Wilcoxon matched-paired signed-rank test unless otherwise specified): NREM sleep time course (P = 2.48 × 10−4 (Vgat), P = 3.03 × 10−3 (Sst) with two-way RM ANOVA and Bonferroni correction), NREM sleep latency (P = 0.0068 (Vgat), P = 0.0391 (Sst)), total episode number in ZT 18–21 (t = 0–3 h) (P = 0.6514 (Vgat), P > 0.9999 (Sst)), mean episode duration (P = 0.001 (Vgat), P = 0.0068 (Sst)), sleep attempts (P = 0.6514 (Vgat), P > 0.9999 (Sst)) and time course of relative delta NREM EEG power at t = 0–3 h (P = 0.0156 (Vgat, t = 0 h), 0.0313 (Vgat, t = 0.33 h), P = 0.0078 (Sst, t = 0.33 h)). d, Core body temperature (temp) change from the pre-i.p. time point of Vgat-PFC-hM3Dq-Tag:SD (n = 6 paired sessions, N = 3 mice) and Sst-PFC-hM3Dq-Tag:SD (n = 6 paired sessions, N = 3 mice) mice after i.p. injection (P = 0.007 (Vgat, t = 0.05 h), P = 0.0066 (Vgat, t = 0.1 h), P = 0.0082 (Sst, t = 0.1 h), P = 0.0398 (Sst, t = 0.15 h) with two-tailed Wilcoxon matched-paired signed-rank test) and mean change in body temperature at t = 0.05–0.20 h in Vgat-PFC-hM3Dq-Tag:SD (P = 0.0008) and t = 0.05–0.15 h in Sst-PFC-hM3Dq-Tag:SD (P = 0.019) mice with two-sided Mann–Whitney U-test. n, number of paired i.p. experiment sessions. NS, not significant, P ≥ 0.05; *P < 0.05; **P < 0.01; ***P < 0.001; ****P < 0.0001. Mean (line) ± s.e.m. (shading) in bd. Individual points (open circles), mean (bar) and s.e.m. (error bar) in bar graphs in bd. See also Extended Data Figs. 1 and 5. MO, medial orbital cortex. Scale bar, 1,000 µm (a).
Fig. 4
Fig. 4. Reactivation of tagged PFCSst neurons induces nesting and NREM sleep in both female and male mice.
a, Sst-PFC-ChR2-Tag:SD mice and optostimulation of the PFC soma and nesting activity of optostimulated Sst-PFC-ChR2-Tag:SD (Tag:SD) and Sst-PFC-ChR2-Tag:Ctrl (Tag:Ctrl, paired on-Dox control) male and female mice during optostimulation at 10 Hz. Animal cohorts of n = 8 sessions and N = 4 mice for each sex. Left: opto-evoked nesting activity. Start of first consolidated NREM sleep is shown with a black line. Right: percentage time spent nesting over time and before, during and after optostimulation at 10 Hz from t = 0, the starting point of optostimulation (ZT 18). Before versus stim (P = 0.0313 (Tag:SD, male), P = 0.0098 (Tag:SD, female) with two-tailed Wilcoxon matched-paired signed-rank test). b, How optostimulation frequencies in the PFC elicit time spent nesting for Sst-PFC-ChR2-Tag:SD mice and their paired on-Dox controls. Stim (Tag:Ctrl versus Tag:SD), male: P = 0.0159 (1 Hz), P = 0.0121 (5 Hz), P = 0.0316 (10 Hz), P = 0.246 (20 Hz); female: P = 0.0035 (1 Hz), P = 0.0067 (5 Hz), P = 0.0044 (10 Hz), P = 0.1177 (20 Hz) with two-sided Mann–Whitney U-test. c, Nests after five bouts of 10-Hz stimuli for Sst-PFC-ChR2-Tag:SD mice and paired on-Dox controls. Tag:Ctrl versus Tag:SD, male: P = 0.0079 (1 Hz), P = 0.0003 (5 Hz), P = 0.0002 (10 Hz), P = 0.0079 (20 Hz); female: P = 0.0264 (1 Hz), P = 0.0007 (5 Hz), P = 0.0004 (10 Hz), P = 0.0117 (20 Hz) with two-sided Mann–Whitney U-test. d, EEG–EMG traces, sleep stage state and time course of percentage NREM sleep before and after 10-Hz optostimulation in the PFC for male and female Sst-PFC-ChR2-Tag:SD mice. e, NREM sleep latency of Sst-PFC-ChR2-Tag:SD mice and paired on-Dox controls with various optostimulation frequencies. Tag:Ctrl versus Tag:SD, male: P = 0.1032 (1 Hz), P = 0.0137 (5 Hz), P = 0.036 (10 Hz), P = 0.0317 (20 Hz); female: P = 0.9176 (5 Hz), P = 0.0287 (10 Hz), P = 0.0303 (20 Hz) with two-sided Mann–Whitney U-test. f, Effect of different optostimulation frequencies in the PFC in eliciting percent time spent in NREM sleep for Sst-PFC-ChR2-Tag:SD mice and their paired on-Dox controls. Tag:Ctrl versus Tag:SD, male: P = 0.041 (stim, 5 Hz), P = 0.0216 (stim, 10 Hz), P = 0.0083 (stim, 20 Hz), P = 0.0216 (after, 10 Hz); female: P = 0.1285 (stim, 1 Hz), P = 0.0387 (stim, 10 Hz), P = 0.0022 (stim, 20 Hz), P = 0.0374 (after, 10 Hz), P = 0.0281 (after, 20 Hz) with two-sided Mann–Whitney U-test. g, Change in theta and delta EEG power from baseline during 10-Hz optostimulation of Sst-PFC-ChR2-Tag:SD mice. Tag:Ctrl versus Tag:SD, male: P = 0.0147 (delta, t = 30–70 min), P = 0.0394 (theta, t = 0–30 min); female: P = 0.0098 (delta, t = 30–70 min), P = 0.049 (theta, t = 0–30 min) with the mixed-effects model. n, number of independent five-bout optostimulation sessions. *P < 0.05; **P < 0.01; ***P < 0.001. Mean (line) ± s.e.m. (shading) in a,d,g. Individual plots (before–after, line) and mean (bar) in a. Mean (circle or triangle) ± s.e.m. (line) in b,f. Individual plot (dot), mean (bar) and +s.e.m. (error bar) in c,e. See also Extended Data Figs. 1 and 6.
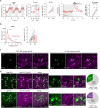
Fig. 5
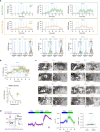
Fig. 5. PFCSst cells activated by the tagging protocol are fast spiking and project to the preoptic hypothalamus and the LH.
a, A patched PFCSst cell from an Sst-PFC-ChR2-Tag:SD mouse and electrode patching an mCherry-positive cell. b, Current-clamp recordings showing membrane voltage changes of randomly sampled PFCSst cells from Sst-PFC-ChR2 mice (PFCSst cells, gray) and tagged PFCSst cells from Sst-PFC-ChR2-Tag:SD mice (PFCSst-Tag:SD cells, magenta). Right: action potential (spike) frequency following different current injections. PFCSst versus PFCSst-Tag:SD, P = 4.00 × 10−8 with the mixed-effects model. Cohorts of Sst-PFC-ChR2 mice, n = 15 neurons, N = 6 mice; Sst-PFC-ChR2-Tag:SD mice, n = 13 neurons, N = 7 mice in all panels in this figure. c, Action potentials triggered by a 10-ms light stimulus to randomly sampled PFCSst cells (gray) and PFCSst-Tag:SD cells (magenta). d, Action potential responses following a 1-s train of 10-ms pulses at 10 Hz to PFCSst-Tag:SD cells (magenta). Right-hand graph: elicited probabilities of light-evoked action potentials (AcPs) according to optostimulation frequency. PFCSst versus PFCSst-Tag:SD, P = 0.0297 (10 Hz), P = 0.0043 (20 Hz), two-sided Mann–Whitney U-test. e, Sagittal (top) and coronal brain sections (bottom) from Sst-PFC-ChR2 mice (N = 5 mice) showing axons (labeled green by ChR2–EYFP) extending into the LPO hypothalamus and the LH. n, number of neurons. *P < 0.05; **P < 0.01; ****P <0.0001. Mean (line) ± s.e.m. (shading) in b; individual plot (open circle), mean (bar) + s.e.m. (line) in d. See also Extended Data Figs. 7 and 8. Acp, anterior commissure, posterior part; f, fornix; NAc, nucleus accumbens; opt, optic tract; VLPO, ventral LPO hypothalamus. Scale bars, 50 µm (a, white), 10 µm (a, yellow), 1,000 µm (e, sagittal, left), 200 µm (e, sagittal, right), 100 µm (e, coronal, left), 25 µm (e, coronal, right).
Fig. 6
Fig. 6. PFCSst projections to the LPO hypothalamus induce nesting.
a, Sst-PFC-ChR2 and Sst-PFC-ChR2-Tag:SD mice and optostimulation of PFCSst terminals in the LPO hypothalamus; examples of elicited nesting behavior following stimulation of PFCSst terminals in the LPO hypothalamus of Sst-PFC-ChR2 and Sst-PFC-ChR2-Tag:SD mice. Gray traces are either no optostimulation (no light, Sst-PFC-ChR2 mice) or the ‘on-Dox’ control mice (Tag:Ctrl, Sst-PFC-ChR2-Tag:SD mice). Right-hand graph: time course of elicited nesting behavior and statistics of time spent in nesting activity before and after 5-Hz optostimulation trials for 2 min. Sst-PFC-ChR2 mice, n = 46 trials, N = 6 mice (male only); Sst-PFC-ChR2-Tag:SD mice, n = 75 trials, N = 11 mice (six males and five females). Nesting and sleep-start trials were excluded. Sst-PFC-ChR2 (light), P = 0.0132 (before versus stim), P = 0.0126 (before versus after); Sst-PFC-ChR2-Tag:SD (Tag:SD), P < 0.0001 (before versus stim), P < 0.0001 (before versus after) with two-tailed Wilcoxon matched-paired signed-rank test. b, Different optostimulation frequencies in the LPO hypothalamus determine nesting activity, during stimulation and after stimulation for Sst-PFC-ChR2 and Sst-PFC-ChR2-Tag:SD mice and their paired controls (same animal cohort as in a). Nesting and sleep-start trials were excluded. Sst-PFC-ChR2 (no light versus light): stim, P = 0.1202 (1 Hz, n = 43 trials), P = 0.0004 (5 Hz, n = 46 trials), P < 0.0001 (10 Hz, n = 48 trials), P = 0.0374 (20 Hz, n = 33 trials); after stim, P = 0.009 (5 Hz), P = 0.0002 (10 Hz), P = 0.033 (20 Hz); Sst-PFC-ChR2-Tag:SD (Tag:Ctrl versus Tag:SD): stim, P = 0.0055 (1 Hz, n = 71 trials), P = 0.0002 (5 Hz, n = 75 trials), P = 0.006 (10 Hz, n = 50 trials), P = 0.5113 (20 Hz, n = 45 trials); after stim, P = 0.0051 (1 Hz), P < 0.0001 (5 Hz), P = 0.0378 (10 Hz), P = 0.2751 (20 Hz) with two-sided Mann–Whitney U-test. c, How optostimulation frequencies in the LPO hypothalamus determine latency to nesting activity during 2-min trials. Sst-PFC-ChR2 (no light versus light), P < 0.0001 (1 Hz), P < 0.0001 (5 Hz), P < 0.0001 (10 Hz), P < 0.0001 (20 Hz); Sst-PFC-ChR2-Tag:SD (Tag:Ctrl versus Tag:SD), P = 0.0018 (1 Hz), P < 0.0001 (5 Hz), P = 0.0006 (10 Hz), P = 0.1794 (20 Hz) with two-sided Mann–Whitney U-test. d, Nest scores. Left: representative nest images after five bouts of 5-Hz stimuli for Sst-PFC-ChR2 and Sst-PFC-ChR2-Tag:SD mice and their paired control mice. Right: nest scores. Sst-PFC-ChR2 (no light versus light), P = 0.4577 (1 Hz, n = 10 paired sessions), P = 0.0003 (5 Hz, n = 11 paired sessions), P < 0.0001 (10 Hz, n = 13 paired sessions), P = 0.001 (20 Hz, n = 11 paired sessions); Sst-PFC-ChR2-Tag:SD (Tag:Ctrl versus Tag:SD), P = 0.0024 (1 Hz, n = 22 paired sessions), P < 0.0001 (5 Hz, n = 25 paired sessions), P < 0.0001 (10 Hz, n = 26 paired sessions), P < 0.0001 (20 Hz, n = 23 paired sessions) with two-sided Mann–Whitney U-test. e, Overall effectiveness of optostimulation-evoked nesting activity. Nests scored between 3 and 5 were considered to have successful quality. f, Left: example EEG–EMG traces, sleep stage state and aligned nesting activity of Sst-PFC-ChR2 and Sst-PFC-ChR2-Tag:SD mice during one optostimulus session. Right: how different optostimulation frequencies in the LPO hypothalamus determine time in NREM sleep during 2-min stimuli. g, Left: core body temperature change with optostimulation in various frequencies from the baseline time point (t = −30 min to 0 min) of Sst-PFC-ChR2-Tag:SD mice and their paired controls. N = 6 mice (three males and three females). Tag:Ctrl (n = 25 sessions) versus Tag:SD (n = 20 sessions), P = 0.0401 (t = −3 min), P = 0.0167 (t = 0), P = 0.0047 (t = 3 min), P = 0.0041 (t = 6 min), P = 0.0124 (t = 9 min), P = 0.0317 (t = 12 min) with two-sided Mann–Whitney U-test. Right: overlay of time course of percent time spent nesting or in NREM sleep (red and gray, respectively) and change in core body temperature (blue) of Sst-PFC-ChR2-Tag:SD mice. Same animals as in g. Nest versus NREM, P = 3.00 × 10−2 (t = 0–30 min), two-way RM ANOVA with Bonferroni correction. NS, not significant, P ≥ 0.05; *P < 0.05; **P < 0.01; ***P < 0.001; ****P < 0.0001. Mean ± s.e.m. See also Extended Data Fig. 9.
Fig. 7
Fig. 7. PFCSst projections to the LPO hypothalamus generate inhibitory currents on postsynaptic cells.
a, mIPSCs from postsynaptic cells in the LPO hypothalamus from Sst-PFC-ChR2-Tag:SD mice. Example traces were recorded with 4AP and TTX present for baseline and with 5 s of 10-Hz optostimulation. Each cell shows a different rate of mIPSCs; therefore, we used changes in percent mIPSC occurrence to normalize the changes in mIPSC frequency between conditions (that is, 5 s for before and stimulation and 10 s for after (mean of five trials per cell)). Bar graphs, mean mIPSC frequency changes (baseline versus stim, P = 0.0156; baseline versus after, P = 0.0312) and mean amplitude changes (baseline versus stim, P = 0.0156) with two-tailed Wilcoxon matched-paired signed-rank test. *P < 0.05. Mean (bar) and individual (before–after line). Rec, recording electrode. b, Gene expression matrix for LPO cells that responded to stimulating PFCSst terminals. n = 12 neurons, N = 7 mice.
Fig. 8
Fig. 8. PFCSst projections to the LH induce NREM sleep.
a, Sst-PFC-ChR2 and Sst-PFC-ChR2-Tag:SD mice and optostimulation of PFCSst terminals in the LH. Left, EEG–EMG traces, sleep stage and aligned nesting activity following 5-Hz stimulation of PFCSst terminals in the LH of Sst-PFC-ChR2 (green, light) and Sst-PFC-ChR2-Tag:SD (orange, Tag:SD) mice. Middle: time course of percentage NREM sleep elicited with five bouts of 5-Hz optostimulation. Right: percent NREM sleep before, during and after a session of 5-Hz stimulation. Light, before versus stim (P = 0.0313), before versus after (P = 0.0078); Tag:SD, before versus stim (P < 0.0001), before versus after (P < 0.0001) with two-tailed Wilcoxon matched-paired signed-rank test. Sst-PFC-ChR2 mice (N = 4 mice), n = 7 sessions (no light), n = 9 sessions (light); Sst-PFC-ChR2-Tag:SD mice (N = 13 mice, eight males and five females), n = 15 sessions (Tag:Ctrl), n = 26 sessions (Tag:SD). b, The effects of different optostimulation frequencies in the LH in eliciting time spent in NREM sleep during a 2-min stimulus trial. Sleep-start trials were excluded. Stim: light versus no light, P = 0.0046 (5 Hz, n = 30 trials), P = 0.0498 (10 Hz, n = 28 trials), P = 0.0202 (20 Hz, n = 27 trials); Tag:SD versus Tag:Ctrl, P = 0.0028 (1 Hz, n = 88 trials), P = 0.0246 (5 Hz, n = 81 trials), P = 0.0478 (10 Hz, n = 78 trials), P < 0.0001 (20 Hz, n = 86 trials) with two-sided Mann–Whitney U-test. After: light versus no light, P = 0.0073 (5 Hz), P = 0.0392 (10 Hz), P = 0.044 (20 Hz); Tag:SD versus Tag:Ctrl, P = 0.0053 (1 Hz), P = 0.001 (5 Hz), P = 0.0125 (10 Hz), P < 0.0001 (20 Hz) with two-sided Mann–Whitney U-test. W start, Wake start. c, How NREM sleep increases over 5-Hz stimulation trials for optostimulated LH terminals. Same animal cohort as in b. Sst-PFC-ChR2 mice, n = 9 paired sessions; Sst-PFC-ChR2-Tag:SD mice, n = 26 paired sessions. d, Time spent nesting following optostimulation of LH PFCSst terminals. e, Left: core body temperature change with optostimulation at various frequencies from the baseline time point (t = −30 min to 0 min) of Sst-PFC-ChR2-Tag:SD mice and their paired controls. N = 6 mice (three males and three females). Tag:Ctrl (n = 14 sessions) versus Tag:SD (n = 27 sessions), P = 0.0186 (t = 18 min), P = 0.0186 (t = 21 min), P = 0.0323 (t = 24 min), P = 0.0131 (t = 27 min), P = 0.0116 (t = 33 min), P = 0.0186 (t = 36 min) with two-sided Mann–Whitney U-test. Right: an overlay of the time course of percent time spent nesting or in NREM sleep (red and gray, respectively) and change in core body temperature (blue) of Sst-PFC-ChR2-Tag:SD mice. P = 1.503 × 10−8 (NREM versus nesting, t = 0–30 min) with two-way RM ANOVA. Mean (line) ± s.e.m. (shading). f, mIPSCs of postsynaptic LH cells from Sst-PFC-ChR2-Tag:SD mice (4AP and TTX were present for baseline, and 5 s of 10-Hz optostimulation was used). Bar graphs: changes in percent mIPSC occurrence to normalize the changes in mIPSC frequency between conditions (that is, 5 s for pre-stimulation and 10 s for post-stimulation (mean of five trials per cell)). Mean mIPSC frequency changes (baseline versus stim, P < 0.0001, baseline versus after, P < 0.0001) and mean amplitude changes (baseline versus stim, P = 0.7609) with two-tailed Wilcoxon matched-paired signed-rank test. n = 19 neurons, N = 6 mice. g, Gene expression matrix for LH cells that responded to optostimulation of PFCSst terminals. n = 19 neurons, N = 6 mice. glut, glutamatergic. See also Extended Data Fig. 10. NS, not significant, P ≥ 0.05; *P < 0.05; **P < 0.01; ****P < 0.0001. Mean (line) ± s.e.m. (shading) in a,e. Mean (open circle or triangle) ± s.e.m. (error bar) in b,d,e. Individual plots (before–after, line) and mean (bar) in a,f.
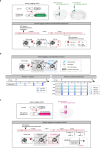
Extended Data Fig. 1
Extended Data Fig. 1. Experimental schematics for activity-tagging (supports Figs. 1–4).
a, Schematic of activity-tagging method and behavioral experiments for Vgat-expressing neurons in the PFC with ChR2-EYFP during sleep deprivation (SD). Dox chow was re-introduced immediately after 5hrs of SD (ZT0-ZT5) and animals were allowed to carry out post-SD nesting and RS without any disturbance while the activity-tagging system is gradually repressed. b, Schematic of activity-tagging opto-stimulation protocols. Prior to habituation period (1 hr), nesting materials in the home cage was reduced and mixed with new nest materials (total approx. 8 g) and food pellets were moved to the far end away from the nesting materials and closer to the water bottle spout. Two separate opto-stimulation protocols were given at ZT18 after 1 hour of habituation. c, Schematic of activity-tagging chemogenic reactivation protocols. Saline and CNO were given 2 days after activity-tagging via i.p. injection with blinding. The mice had 2 days rest time between the 1st and 2nd injections.
Extended Data Fig. 2
Extended Data Fig. 2. Activity-tagging of GABA neurons in the prefrontal cortex (PFC) and visual cortex (VC) (supports Figs. 1, 2).
a, Core body temperature changes during 5 hrs of SD (ZT0-5) and subsequent RS (top panels). Left: Mean body temperature increased in the dark period by 1 °C in baseline (BL) 24 hrs (LP vs. DP, BL: P = 0.0006, SD: P = 0.0006, Two-sided Mann-Whitney U test). Middle: Mean body temperature during SD compared with the BL (P = 0.00101, Two-tailed paired t-test). Top 2nd right: Time course of Δ body temperature against mean BL temperature ((ZT0-5): P = 5.20 × 10−4, (ZT5-6): P = 9.47 × 10−4, (ZT0-6, interaction): P = 5.79 × 10−18, 2-way RM ANOVA with Bonferroni correction). Far right: max. Δ body temperature in ZT5-6 (P = 0.00076, Two-tailed paired t-test). b, EEG power spectrum of NREM sleep in the first 2 hours of RS (P = 2.29 × 10−33, 2-way RM ANOVA with Bonferroni correction) and mean Delta power (P = 0.0068, Two-tailed Wilcoxon matched-pairs signed rank test). Vgat-Cre mice, nmice = 8. c, Representative images of endogenous cFOS protein (green) colocalized with GAD1 protein (magenta) in the PFC and VC following SD/nesting/RS. d, Percentage of GABAergic tagged neurons in the PFC and VC as assessed by hM3Dq-mCherry expression (magenta). Non-tagged GABA neurons are defined by EYFP expression (green) after co-injecting AAV-flex-EYFP into the PFC and VC of Vgat-Cre mice. Vgat-PFC-YFP::Vgat-PFC-hM3Dq-Tag:SD mice; nneuron = 5109, Nmice = 4, Vgat-VC-YFP::Vgat-VC-hM3Dq-Tag:SD mice; nneuron = 2524, Nmice = 4. Mean (line) ± SEM (shading) in a, b. Arrowheads in c, d indicate co-expression. nneuron = number of neurons, Nmice = number of biologically independent mice. **P < 0.01, *** P < 0.001 **** P < 0.0001. LP: light period, DP: dark period. Scale bars: 25 µm (c), 50 µm (d, white), 10 µm (d, yellow).
Extended Data Fig. 3
Extended Data Fig. 3. Activity-tagging controls (supports Fig. 2).
This Figure shows a series of controls using Vgat-PFC-hM3Dq-Tag mice (nmice = 3 each). All groups of mice were on the Dox diet prior to AAV transgene injection into the PFC. a, Experimental group. Mice were on Dox for 4 weeks (4w), then Dox was removed from the diet for 2 days (2d) and during sleep deprivation (SD), and Dox was made available straight after the SD, during the start of nesting and recovery sleep (RS). Four days later, mice were transcardially-perfused and the brain sections were immuno-stained, in this case, for induced mCherry expression in the PFC. Images in the right hand-column are magnifications of PFC cells with induced gene expression. b, First type of ‘on Dox’ control group. Mice were on Dox for 4 weeks, then Dox was removed from the diet for 2 days, and then Dox was re-provided during the sleep deprivation procedure and remained in the diet for 4 weeks until transcardio-perfusion. This shows that in the presence of near continuous Dox, except for 2 days interruption, no transgene expression was induced above background. c, Second type of ‘on Dox’ control group. Mice were on Dox continuously, including for the periods prior to SD. No transgene expression was induced above background. d, Baseline ‘off Dox’ control group. Mice were on Dox for 4 weeks after AAV injection and Dox was removed for 2 days plus an extra 24 hours to correspond with the experimental group, and then mice were placed back on Dox and perfused 4 days later. Although some transgene expression occurred during this time, there was no clear cell labelling at higher magnifications. nmice = number of biologically independent mice. PL, prelimbic; IL, infralimbic. Scale bars: 100 µm (white), 20 µm (yellow).
Extended Data Fig. 4
Extended Data Fig. 4. Opto-stimulation of activity-tagged GABA neurons in the PFC and VC (supports Figs. 1, 2).
a, Map of ChR2-EYFP gene expression induced after tagging in Vgat-PFC-ChR2-Tag:SD (Nmice = 8) and Vgat-VC-ChR2-Tag:SD mice (Nmice = 5). The intensity of the green and purple indicates the extent of overlap (overlay) of gene expression, respectively. Red dot marks the position of the optic fiber tract. b, EEG power spectrum of Vgat-PFC-ChR2-Tag:SD mice during opto-evoked nesting compared with the EEG spectrum of mice carrying out nesting during the post-SD nesting (RS, red), spontaneous nesting (Sp, green) and Wake EEG spectrum of time-matched Vgat-PFC-ChR2-Tag:Ctrl (CtrlWake, grey). Right: Mean EEG power at 7-9 Hz. CtrlWake vs. PFC, P = 0.0031; CtrlWake vs. Sp, P = 0.0002; CtrlWake vs. RS, P = 0.0025 with Two-sided Mann-Whitney U test. Vgat-PFC-ChR2-Tag:SD (PFC) mice, Nmice = 7, nsession = 10; Ctrl mice (a group of Vgat-PFC-ChR2-Tag:Ctrl mice, Nmice = 4, Vgat-PFC-GFP mice, Nmice = 4), nsession = 10;Vgat-Cre mice, Nmice = 3, nsession = 9 (Sp), nsession = 5 (RS). c, Locomotion and grooming occurrences before and during opto-stimulation for 3 mouse groups (PFC (nsession = 10, Nmice = 7), VC (nsession = 6, Nmice = 5) and control (nsession = 10, Nmice = 8)). P = 0.1934 (PFC: Pre vs Stim), P = 0.4316 (PFC: Pre vs Post) and P = 0.0488 (PFC: Stim vs Post) with Two-tailed Wilcoxon matched-pairs signed rank test for % locomotion. d, percentage NREM sleep of Vgat-PFC-ChR2-Tag:SD and Vgat-VC-ChR2-Tag:SD and control mice before and during opto-stimulation. P = 0.0039 (PFC: Pre vs Stim), P = 0.1309 (PFC: Stim vs Post) and P = 0.0273 (PFC: Pre vs post) with two-tailed Wilcoxon matched-pairs signed rank test. e, EEG power spectrum of Vgat-PFC-ChR2-Tag:SD and Vgat-PFC-ChR2-Tag:Ctrl mice before and during opto-evoked NREM sleep, and mean EEG power at 2.5-3 Hz. P = 2.73 × 10−2 (PFC vs. Ctrl) with Two-sided Mann-Whitney U test. f, Correlation of start of NREM sleep and nest score for all 3 groups of mice (Two-sided Spearman correlation coefficient). Mean (line) ± SEM (shading) in b, e. Individual (open circle), Mean (line/closed circle) ± SEM (error bar) in b, c, e. Mean (bar) and before-after (line) in d. nsession = number of independent session, Nmice = number of biologically independent mice. *P < 0.05, **P < 0.01, *** P < 0.001.
Extended Data Fig. 5
Extended Data Fig. 5. Activity-tagging and chemogenetic stimulation of PFCVgat, PFCSst, and PFCNos1 neurons, genetic characterization of the tagged Vgat neurons, and further data on sleep characterization (Supports Fig. 3).
a, Schematic map of hM3Dq-mCherry gene expression induced after tagging in Vgat-PFC-hM3Dq-Tag:SD (nmice = 10), Sst-PFC-hM3Dq-Tag:SD (nmice = 12) and Nos1-PFC-hM3Dq-Tag:SD (nmice = 8) in the PFC (intensity of red, indicates extent of overlap between animals). b, Single-cell RT-PCR from visually-identified tagged neurons in acute PFC slices prepared from Vgat-PFC-ChR2-Tag:SD mice (Nmice = 6). Dark blue, strongest expression; pale blue, weaker. NCT, no template control. Venn diagram showing that many Gad1-expressing PFC neurons in Vgat-PFC-ChR2-Tag:SD mice co-express Sst and/or Nos1. Nneuron = 28 (ChR2+). c, Evoked nesting activity of Nos1-PFC-hM3Dq-Tag:SD mice that had received SD and then saline/CNO injections 2 days later. Red raster bars, nesting during first 1 hour of post-i.p. injection until the 1st consolidated sleep occurrence (solid black line); i.p. injection was at ZT18 (solid arrowhead). The other panels from left to right: time course of %time spent nesting (Group x time, P = 1.40 × 10−1 (saline vs. CNO (5)), P > 0.9999 (saline vs. CNO(1)) with 2-way RM ANOVA with Bonferroni correction), nesting duration (P = 0.75 (saline vs. CNO (5)), P = 0.375 (saline vs. CNO(1)) with two-tailed Wilcoxon matched-paired signed rank test), pictures of scattered nesting material and nests (Yellow dot, mouse in the cage; dashed red line, nest material outline; solid red line, nest outline), quantification of nest scores (P > 0.9999 (saline vs. CNO(5)), P > 0.9999 (saline vs. CNO(1))) with two-tailed Wilcoxon matched-paired signed rank test, npaired-sessions = 4, Nmice = 4. d, Top: Example EEG/EMG trace and sleep stage state of Nos1-PFC-hM3Dq-Tag:SD after saline and CNO i.p. injection. Bottom: from left to right, NREM sleep time course (P = 4.62 × 10−2 with 2-way RM ANOVA with Bonferroni correction), NREM sleep latency (P = 0.4922), total number of episodes in first 3 hours post-i.p. injection (T:0-3, NREM: P = 0.1563), mean episode duration per hour (NREM: P = 0.0547), sleep attempts (P = 0.156) with two-tailed Wilcoxon matched-paired signed rank test and NREM EEG spectrum of T:0-2 (P = 6.11 × 10−1) with 2-way RM ANOVA with Bonferroni correction. npaired-session = 10, Nmice = 8. Mean (line) ± SEM (shading), Individual points (open circle), Mean (bar) ± SEM (error bar). e, core body temperature change from pre-i.p. time point of Nos1-PFC-hM3Dq-Tag:SD after saline and CNO i.p. injection and mean change in body temperature at T:0.05-0.35 period. P = 0.7922 with two-sided Mann-Whitney U test. npaired-session = 6, Nmice = 3. nsP ≥ 0.05, *P < 0.05. Individual points (open circle), Mean (line) ± SEM (error bar). npaired-session = number of independent paired-sessions, Nmice = number of biologically independent mice.
Extended Data Fig. 6
Extended Data Fig. 6. PFCSst optogenetics (Supports Fig. 4).
a, Percentage of tagged PFCSst neurons in the PFC as assessed by hM3Dq-mCherry expression (mCherry in magenta). PFCSst neurons are defined by ChR2-EYFP expression after co-injecting AAV-flex-ChR2-EYFP into the PFC of Sst-Cre mice. Arrowheads indicate co-expression. Sst-PFC-YFP::Sst-PFC-hM3Dq-Tag:SD mice, nneuron = 2708, Nmice = 4. b, Time spent nesting with 1 Hz, 5 Hz, or 20 Hz light stimulation of PFC for male and females Sst-PFC-ChR2-Tag:SD mice and their controls. c, Example pictures of nests after 5 bouts of 1, 5, or 20 Hz stimuli for male and female Sst-PFC-ChR2-Tag:SD mice. Yellow dot, mouse in the cage; dashed red line, nest material outline; solid red line, nest outline. d, time spent in NREM sleep with 1 Hz, 5 Hz, or 20 Hz light stimulation of PFC for male and female Sst-PFC-ChR2-Tag:SD mice and their controls. nneuron = number of neurons, Nmice = number of biologically independent mice. Mean (line) ± SEM (shading). Scale bars; 50 µm (in white), 10 µm (in yellow).
Extended Data Fig. 7
Extended Data Fig. 7. Electrophysiological properties and gene expression phenotypes of tagged and non-tagged PFCSst cells (Supports Fig. 5).
a, Current-clamp recording traces in a ramp test and basic cell properties of randomly-sampled PFCSst cells from Sst-PFC-ChR2 mice (PFCSst cells, grey) and tagged PFCSst cells from Sst-PFC-ChR2-Tag:SD mice (PFCSst-Tag:SD cells, magenta). P = 0.047 (Rheobase), P = 0.0071 (RMP).Cohorts of PFCSst: nneuron = 16, Sst-PFC-ChR2 mice (Nmice = 6), PFCSst-Tag:SD: nneuron = 15, Sst-PFC-ChR2-Tag:SD mice (Nmice = 7). b, Proportions of fast-spiking cells (FS) within all sampled cells from both PFCSst cells and PFCSst-Tag:SD cells. c, Action potential (AP) properties of 1st and 3rd evoked APs after giving 60 pA steps in PFCSst cells and PFCSst-Tag:SD cells. Left panel: example trace overlaps of PFCSst cells and PFCSst-Tag:SD cells. AP half width: P = 0.0015 (1st), P = 0.0014 (3rd), AP Max. DP: P = 0.681 (1st), P = 0.4707 (3rd), AP 90-10% decay time: P = 0.0006 (1st), P = 0.0074 (3rd). d, Phase plot and evoked spike counts of action potentials triggered by a single 10 ms blue light pulse in PFCSst cells and PFCSst-Tag:SD cells. P = 0.0001. e, example of action potential responses following a 1 sec train of 10 msec pulses of blue light delivered at 5 Hz and 20 Hz to PFCSst-Tag:SD cells. F, gene expression matrix of PFCSst cells (in grey), PFCSst-Tag:SD cells (magenta) and ChR2-mCherry- cells from Sst-PFC-ChR2 mice and Sst-PFC-ChR2-Tag:SD mice (purple). Image shows Layer2/3 cells filled post-recording with neurobiotin (NB). Two-sided Mann-Whitney U test. nsP ≥ 0.05, *P < 0.05, ** P < 0.01, *** P < 0.001. nneuron = number of neurons. Nmice = number of biologically independent mice. Individual plot (open circle), Mean (bar) ± SEM (error bar). Scale bars, 10 µm.
Extended Data Fig. 8
Extended Data Fig. 8. Detection of ChR2-EYFP signals in the LPO and LH of Sst-PFC-ChR2-Tag:SD and Sst-VC-ChR2 mice (Supports Fig. 5).
a, Images from Sst-PFC-ChR2-Tag:SD mice (Nmice = 5); three tagged ChR2-EYFP-positive cell bodies are shown in PFC, and fine processes (green) in LPO and LH, reflecting a transient bolus of ChR2-EYFP. Arrowhead, an axon terminal. b, Images from Sst-PFC-ChR2-Tag:SD and Sst-PFC-ChR2 mice showing no ChR2-EYFP labelled fibers in VC (Nmice = 5 each). c, Images from Sst-VC-ChR2 mice (Nmice = 3) showing multiple ChR2-EYFP-positive cell bodies in the VC itself, but no labelled fibers in LPO or the LH. Nmice = number of biologically independent mice. Scale bars; 50 µm (a, white), 10 µm (a, yellow), 50 µm (b, c).
Extended Data Fig. 9
Extended Data Fig. 9. LPO terminal stimulation (Supports Fig. 6).
a, Top: Nesting behavior (% time spent in nesting) before and after 2 min of 1, 10, 20 Hz light stimulation of PFCSst terminals in LPO of Sst-PFC-ChR2 mice and Sst-PFC-ChR2-Tag:SD mice and controls. Bottom: individual statistics for time spent in nesting activity pre-, during, and post- 1, 10, 20 Hz light stimulation in LPO for Sst-PFC-ChR2 and Sst-PFC-ChR2-Tag:SD mice and their controls. Cohorts of Sst-PFC-ChR2 mice (Nmice = 6), Sst-PFC-ChR2-Tag mice (Nmice = 11, (6 males and 5 females)). Nesting/sleep start trials were excluded. Sst-PFC-ChR2 (Light): Pre versus Stim; P = 0.7889 (1 Hz, ntrial = 43), P = 0.0183 (10 Hz, ntrial = 42), P = 0.0195 (10 Hz, ntrial = 31), Pre versus Post; P = 0.8955 (1 Hz), P = 0.0129 (10 Hz), P = 0.0051 (20 Hz). Sst-PFC-ChR2-Tag:SD (Tag:SD): Pre versus Stim; P = 0.0103 (1 Hz, ntrial = 71), P = 0.0351 (10 Hz, ntrial = 49), P = 0.0371 (20 Hz, ntrial = 52), Pre versus Post; P = 0.0032 (1 Hz), P = 0.0099 (10 Hz), P = 0.0161 (20 Hz) with two-tailed Wilcoxon matched-pairs signed rank test. b, Cumulative percentage time spent in nesting activity from onset of light stimulus of PFCSst terminals in the LPO of Sst-PFC-ChR2 mice and Sst-PFC-ChR2-Tag:SD mice and their controls. ‘T:0’ indicates the starting point of the opto-stimulation period (blue shading). Sst-PFC-ChR2 (No light vs. Light); P = 2.27 × 10−3 (1 Hz, nsession = 11), P = 4.86 × 10−34 (5 Hz, nsession = 11), P = 1.68 × 10−59 (10 Hz, nsession = 13), P = 9.15 × 10−32 (20 Hz, nsession = 10), Sst-PFC-ChR2-Tag:SD (Tag:Ctrl vs. Tag:SD); P = 4.17 × 10−89 (1 Hz, nsession = 24), P = 4.79 × 10−95 (5 Hz, nsession = 26), P = 5.81 × 10−95 (10 Hz, nsession = 27), P = 2.91 × 20−22 (20 Hz,, nsession = 24) with 2-way RM ANOVA with Bonferroni correction. c, Nests after a session of 5 bouts of 1, 10, 20 Hz opto-stimulation in Sst-PFC-ChR2 mice (light) and Sst-PFC-ChR2-Tag:SD mice. Yellow dot, position of mouse. Dashed red line, outline of nesting materials; solid red line, nest outline. d, Change of theta power from baseline and EEG power spectrum in the nesting state during 5 Hz opto-stimulation in the LPO of Sst-PFC-ChR2 mice and Sst-PFC-ChR2-Tag:SD mice. Change of theta power (T0-30): versus control (No light and Tag:Ctrl), P = 9.00 × 10−3 (Tag:SD) with Mixed-effects model, EEG power spectrum: P = 3.55 × 10−121 (Light vs. CtrlWake), P = 1.77 × 10−7 (Tag:SD vs. CtrlWake) with 2-way RM ANOVA with Bonferroni correction. e, Effects of opto-stimulation frequencies in eliciting percent time in NREM sleep, pre- and post-stim per trial for PFCSst terminals in the LPO of Sst-PFC-ChR2 mice and Sst-PFC-ChR2-Tag:SD mice and their controls. Sleep start trials were excluded. Sst-PFC-ChR2 (No light versus Light): Pre, P = 0.75 (1 Hz, ntrial = 45), P > 0.9999 (5 Hz, ntrial = 47), P > 0.9999 (10 Hz, ntrial = 56), Post, P = 0.75 (1 Hz), P > 0.9999 (5 Hz), P = 0.75 (10 Hz), P = 0.625 (20 Hz, ntrial = 49), Sst-PFC-ChR2-Tag:SD (Tag:Ctrl vs. Tag:SD): Pre, P = 0.0391 (1 Hz, ntrial = 81), P = 0.1754 (5 Hz, ntrial = 92), P = 0.5742 (10 Hz, ntrial = 66), P = 0.4414 (20 Hz, ntrial = 54), Post, P = 0.4834 (1 Hz), P = 0.4784 (5 Hz), P = 0.3657 (10 Hz), P = 0.575 (20 Hz) with two-tailed Wilcoxon matched-pairs signed rank. f, Calcium photometry signals of PFCSst terminals in LPO of Sst-PFC-GCaMP6-Tag:SD mice (Nmice = 3, nevent = 10) during spontaneous nesting, around ZT0. Far right panel: % mean ΔF/F. Before versus nest, P = 0.0098 (before vs. nest) two-tailed Wilcoxon matched-paired signed rank test. *P < 0.05, ** P < 0.01, *** P < 0.001, **** P < 0.0001. nevent = consolidated nesting events. Mean (line) ± SEM (shading) in (a), (b), (d), (f). Mean (bar) and individual plot (before-after, line) in (a), (f). Mean (open circle/triangle) ± SEM (error bar) in (e).
Extended Data Fig. 10
Extended Data Fig. 10. LH terminal stimulation (Supports Fig. 8).
a, Time course of percent time spent in NREM sleep during sessions of 5 sets of 2 min of 1, 10, or 20 Hz light stimulation of PFCSst terminals in the LH in Sst-PFC-ChR2 mice (Nmice = 4) and Sst-PFC-ChR2-Tag:SD mice (Nmice = 13 (8 males and 5 females)) and their controls. Light vs. No light: 10 Hz (nsession = 8), P = 0.0313 (Pre vs. Stim, Pre vs. Post); 20 Hz (nsession = 8), P = 0.0156 (Pre vs. Stim), P = 0.0234 (Pre vs. Post), Tag:SD vs. Tag:Ctrl:1 Hz (nsession = 25), P < 0.0001 (Pre vs. Stim), P = 0.0017 (Pre vs. Post), 10 Hz (nsession = 27), P < 0.0001 (Pre vs. Stim, Pre vs. Post), 20 Hz (nsession = 27), P < 0.0001 (Pre vs. Stim), P = 0.0004 (Pre vs. Post) with two-tailed Wilcoxon matched-pairs signed rank. b, Change of delta power from baseline and EEG power spectrum in NREM sleep during 5 Hz opto-stimulation in the LPO of Sst-PFC-ChR2 mice (nsession = 9, Nmice = 4) and Sst-PFC-ChR2-Tag:SD mice (nsession = 26, Nmice = 13). P = 1.50 × 10−3 (Light vs. Ctrl, T0-50), P = 7.62 × 10-3 (Tag:SD vs. Ctrl, T0-50) with Mixed-effects model. For NREM EEG power, P = 7.86 × 10−6 (Light vs. Ctrl), P = 1.34 × 10−94 (Tag:SD vs. Ctrl) with 2-way RM ANOVA with Bonferroni correction. c, Nests after a session of 5 bouts of 1, 5, 10, 20 Hz opto-stimulation in Sst-PFC-ChR2 mice (Light) and Sst-PFC-ChR2-Tag:SD mice. Yellow dot, position of mouse. Dashed red line, outline of nesting materials. d, Calcium photometry signals of PFCSst terminals in LH of Sst-PFC-GCaMP6-Tag:SD mice (nevent = 22, Nmice = 3) during transitions between wake and NREM sleep. Mean ΔF/F: P < 0.0001 (Wake vs. NREM) with two-tailed Wilcoxon matched-pairs signed rank. *P < 0.05, ** P < 0.01, *** P < 0.001, **** P < 0.0001. nevent = consolidated NREM sleep. Mean (line) ± SEM (shading) in (a), (b), (d). Mean (bar) and individual plot (before-after, line) in (a), (d).

References

    1. Eban-Rothschild, A., Rothschild, G., Giardino, W. J., Jones, J. R. & de Lecea, L. VTA dopaminergic neurons regulate ethologically relevant sleep–wake behaviors. Nat. Neurosci.19, 1356–1366 (2016). - PMC - PubMed
    1. Eban-Rothschild, A., Giardino, W. J. & de Lecea, L. To sleep or not to sleep: neuronal and ecological insights. Curr. Opin. Neurobiol.44, 132–138 (2017). - PMC - PubMed
    1. Harding, E. C., Franks, N. P. & Wisden, W. The temperature dependence of sleep. Front. Neurosci.13, 336 (2019). - PMC - PubMed
    1. Hediger, H. The biology of natural sleep in animals. Experientia36, 13–16 (1980). - PubMed
    1. Parmeggiani, P. L. Behavioral phenomenology of sleep (somatic and vegetative). Experientia36, 6–11 (1980). - PubMed

Publication types