. 2023 Sep 21;14(1):5891.
doi: 10.1038/s41467-023-41567-1.

Endothelial Sp1/Sp3 are essential to the effect of captopril on blood pressure in male mice

Affiliations

Endothelial Sp1/Sp3 are essential to the effect of captopril on blood pressure in male mice

Hanlin Lu et al. Nat Commun. .

Abstract

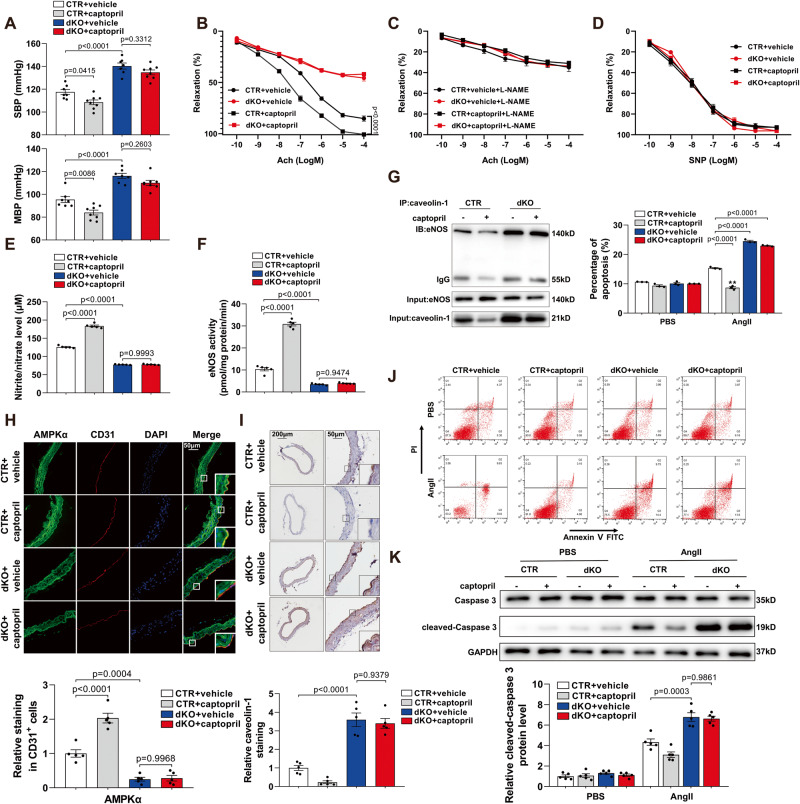
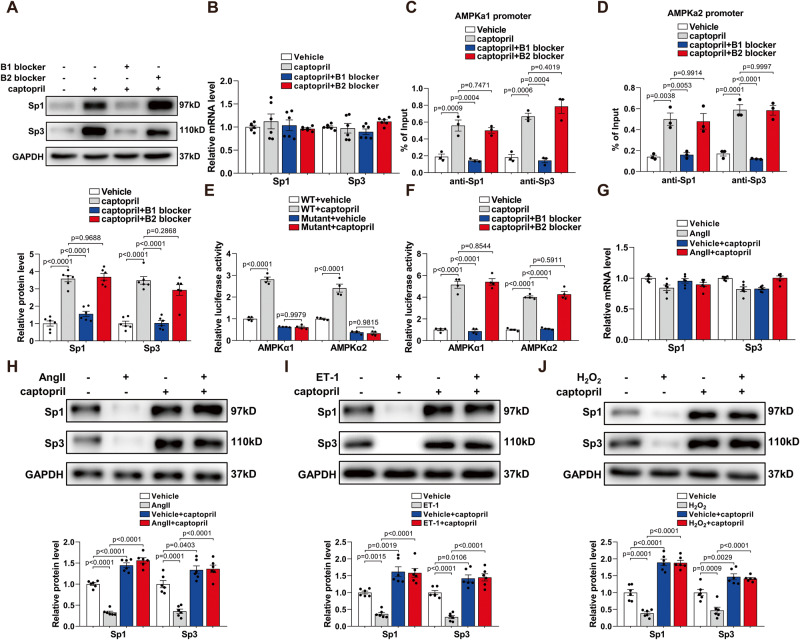
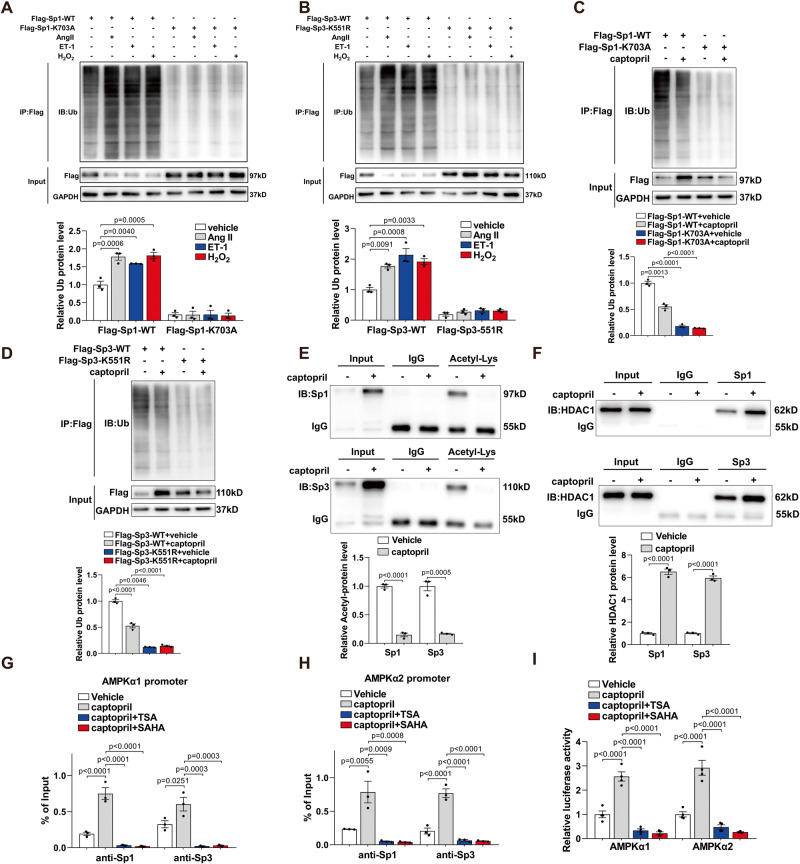
Endothelial dysfunction represents a major cardiovascular risk factor for hypertension. Sp1 and Sp3 belong to the specificity protein and Krüppel-like transcription factor families. They are ubiquitously expressed and closely associated with cardiovascular development. We investigate the role of Sp1 and Sp3 in endothelial cells in vivo and evaluate whether captopril, an angiotensin-converting enzyme inhibitor (ACEI), targets Sp1/Sp3 to exert its effects. Inducible endothelial-specific Sp1/Sp3 knockout mice are generated to elucidate their role in endothelial cells. Tamoxifen-induced deletion of endothelial Sp1 and Sp3 in male mice decreases the serum nitrite/nitrate level, impairs endothelium-dependent vasodilation, and causes hypertension and cardiac remodeling. The beneficial actions of captopril are abolished by endothelial-specific deletion of Sp1/Sp3, indicating that they may be targets for ACEIs. Captopril increases Sp1/Sp3 protein levels by recruiting histone deacetylase 1, which elevates deacetylation and suppressed degradation of Sp1/Sp3. Sp1/Sp3 represents innovative therapeutic target for captopril to prevent cardiovascular diseases.


Conflict of interest statement

The authors declare no competing interests.

Figures

Fig. 1
Fig. 1. Sp1 and Sp3 levels were reduced in arteries of hypertensive patients and angiotensin II (Ang II)-induced hypertensive mice.
A, B Representative immunofluorescent (IF) staining of A Sp1 and B Sp3 in mesenteric arteries from hypertensive and healthy individuals. CD31 is an endothelial cell marker. Scale bar: 50 μm. C Quantitative data analysis of (A) and (B). n = 5. D, E Representative IF staining of D Sp1 and E Sp3 in aortas from mice treated with saline or Ang II. CD31 is an endothelial cell marker. Scale bar: 50 μm. F Quantitative data analysis of (D) and (E). n = 5. Western blot (WB) analysis of Sp1 and Sp3 in HUVECs treated with G Ang II (10−6 mol/L, 0–36 h); H ET-1 (10−7 mol/L, 0–36 h) and I H2O2 (10−4 mol/L, 0–36 h). n = 6. Data are presented as mean ± SEM. Two-tailed Student unpaired t test for C and F. One-way ANOVA followed by Bonferroni’s post hoc test for (G) to (I).
Fig. 2
Fig. 2. Generation and analysis of endothelial-specific Sp1/Sp3 deletion mice.
A, B Representative IF staining of A Sp1 and B Sp3 in aortas from CTR and dKO mice. CD31 is used as an endothelial cell marker. Scale bar: 50 μm. C Quantitative data analysis of (A) and (B). n = 5. D Systolic (SBP) and mean blood pressure (MBP) in CTR and dKO mice. n = 10–11. EG Vascular reactivity of mesenteric arteries from CTR and dKO mice to acetylcholine (Ach) with or without (L-NAME, 10−4 mol/L, 30 min) pretreatment and sodium nitroprusside (SNP). n = 5. H Serum nitrite/nitrate level from CTR and dKO mice. n = 5. I eNOS activity in mouse lung endothelial cells (MLECs) from CTR and dKO mice. n = 5. J Representative hearts from CTR and dKO mice. KO Representative echographic images and quantification obtained from M-mode from CTR and dKO mice. EF, ejection fraction; FS, fraction shortening; LVPWd, left ventricular posterior wall; LVPWs, systolic left ventricular posterior wall. n = 5. Data are presented as mean ± SEM. Two-way ANOVA followed by Bonferroni post hoc test for (E) to (G). Two-tailed Student unpaired t test for (C), (D), (H), (I), (L), (M), (N), and (O).
Fig. 3
Fig. 3. Sp1 and Sp3 positively regulate AMPKα1 and AMPKα2 transcription.
A WB analysis and C qPCR analysis of AMPKα1, AMPKα2, p-AMPKα (Thr172), caveolin-1 in HUVECs transfected with CTR siRNA or Sp1/3 siRNA. n = 6. B WB analysis and D qPCR analysis of AMPKα1, AMPKα2, p-AMPKα (Thr172), caveolin-1 protein levels in HUVECs infected with Ad-GFP or Ad-Sp1/3. n = 6. E IF staining of AMPKα in aortas. CD31 is an endothelial cell marker. Scale bar: 50 μm. Quantitative analysis (right). n = 5. F Immunohistochemical (IHC) staining for caveolin-1 in aortas. Scale bar: 200 μm/50 μm. Quantitative analysis (right). n = 5. G Schematic illustration of putative Sp1/Sp3 binding region on the promoter of human AMPKα1 and AMPKα2. Forward primer (forward) and reverse primer (reverse) for chromatin immunoprecipitation (ChIP) assay were indicated by arrows. ChIP assays showing the binding of Sp1 (H) or Sp3 (I) to the AMPKα1 and AMPKα2 promoters in HUVECs. n = 3. Luciferase activity shown by the indicated serial 5′ promoter deletions of AMPKα1 (J) and AMPKα2 (K) in HUVECs infected with Ad-GFP, Ad-Sp1, or Ad-Sp3. n = 4. L, M Relative luciferase activity for the wild-type (WT) and mutant constructs of AMPKα1 and AMPKα2 promoter in HEK293T cells infected with Ad-GFP, Ad-Sp1 (L) or Ad-Sp3 (M). n = 4. N, O Relative luciferase activity for the WT and mutant constructs of AMPKα1 and AMPKα2 promoter in HUVECs transfected with CTR, Sp1 (N) or Sp3 siRNA (O). n = 4. ChIP assays in HUVECs with or without mithramycin (MITA) using anti-Sp1 (P) or anti-Sp3 (Q) n = 3. R Relative luciferase activity for the WT and mutant constructs of AMPKα1 and AMPKα2 promoters in HUVECs with or without MITA. n = 4. Data are presented as mean ± SEM. Two-tailed Student unpaired t test for (A), (B), (C), (D), (E), (F), (H), (I), (P), and (Q). One-way ANOVA followed by Bonferroni post hoc analysis for (J), (K), (L), and (M). Two-way ANOVA followed by Bonferroni post hoc test for (N), (O), and (R).
Fig. 4
Fig. 4. Sp1 and Sp3 improve endothelial function via AMPKα.
A WB of Sp1 and Sp3 protein levels in HUVECs with different treatments. n = 6. B WB of P16 and P21 protein levels in HUVECs with different treatments. n = 6. C WB of p-ULK1 (Ser555), ULK1, p62, and LC3 II/LC3 I in HUVECs with different treatments. n = 6. D MLECs from CTR and dKO mice with different treatments were stained with fluorescein isothiocyanate (FITC)-conjugated annexin V and propidium iodide (PI) and analyzed by flow cytometry. n = 3. E WB of caspase 3 and cleaved-caspase 3 protein levels in MLECs from CTR and dKO mice with different treatments. n = 5. F SBP and MBP in mice treated with vehicle or MITA. n = 9−10. GI Vascular reactivity of mesenteric arteries from vehicle- or MITA-treated mice to Ach with or without L-NAME pretreatment (10–4 mol/L, 30 min) and SNP. n = 5. J Serum nitrite/nitrate level from vehicle- and MITA-treated mice. n = 5. K eNOS activity measured in MLECs from vehicle- and MITA-treated mice. n = 5. L WB of protein levels of Sp1, Sp3, AMPKα1, AMPKα2, p-AMPKα (Thr172), and caveolin-1 in MLECs from vehicle- and MITA-treated mice. n = 5. M qPCR analysis of AMPKα1 and AMPKα2 mRNA levels in MLECs from vehicle and MITA-treated mice. n = 5. N Representative IF staining of AMPKα in aortas from vehicle and MITA-treated mice. CD31 is an endothelial cell marker. Scale bar: 50 μm. Quantitative data analysis (right). n = 5. O Representative IHC staining for caveolin-1 in aortas from vehicle and MITA-treated mice, Scale bar: 200 μm/50 μm. Quantitative data analysis (right). n = 5. Data are presented as mean ± SEM. Two-tailed Student unpaired t test for (D), (E), (F), (J), (K), (L), (M), (N), and (O). One-way ANOVA followed by Bonferroni post hoc analysis for (A), (B), and (C). Two-way ANOVA followed by Bonferroni post hoc test for (G) to (I).
Fig. 5
Fig. 5. Administration of CA-AMPK decreases blood pressure and alleviates endothelial dysfunction in Sp1/Sp3ECKO mice.
A SBP and MBP in CTR and dKO mice with Ad-LacZ or CA-AMPK. n = 7–8. BD Vascular reactivity of mesenteric arteries from CTR and dKO mice with Ad-LacZ or CA-AMPK to Ach with or without L-NAME pretreatment (10–4 mol/L, 30 min) and SNP. n = 5. E Serum nitrite/nitrate level from CTR and dKO mice with Ad-LacZ or CA-AMPK. n = 5. F eNOS activity measured in MLECs from CTR and dKO mice with Ad-LacZ or CA-AMPK. n = 5. G Co-immunoprecipitation (CoIP) assay of eNOS immunoprecipitated with anti-caveolin-1 antibody in MLECs from CTR and dKO mice with Ad-LacZ or CA-AMPK. n = 5. H Representative IF staining of p-AMPKα (Thr172) in aortas from CTR and dKO mice with Ad-LacZ or CA-AMPK. CD31 is an endothelial cell marker. Scale bar: 50 μm. Quantitative data analysis (below). n = 5. I Representative IHC staining for caveolin-1 in aortas from CTR and dKO mice with Ad-LacZ or CA-AMPK, Scale bar: 200 μm/50 μm. Quantitative data analysis (below). n = 5. J MLECs from CTR and dKO mice with Ad-LacZ or CA-AMPK with different treatments were stained with FITC-conjugated annexin V and PI and analyzed by flow cytometry. n = 3. K WB of caspase 3 and cleaved-caspase 3 protein levels in MLECs from CTR and dKO mice with Ad-LacZ or CA-AMPK with different treatments. n = 5. Data are presented as mean ± SEM. One-way ANOVA followed by Bonferroni post hoc analysis for (A), (E), (F), (H), (I), (J), and (K). Two-way ANOVA followed by Bonferroni post hoc test for (B) to (D).
Fig. 6
Fig. 6. Endothelial Sp1 and Sp3 are responsible for anti-hypertension and anti-endothelial dysfunction effects of captopril.
A SBP and MBP in CTR and dKO mice treated with vehicle or captopril. n = 7–8. BD Vascular reactivity of mesenteric arteries from CTR and dKO mice treated with vehicle or captopril to Ach with or without L-NAME pretreatment (10–4 mol/L, 30 min) and SNP. n = 5. E Serum nitrite/nitrate level from CTR and dKO mice with vehicle or captopril. n = 5. F eNOS activity measured in MLECs from CTR and dKO mice with vehicle or captopril. n = 5. G CoIP assay of eNOS immunoprecipitated with anti-caveolin-1 antibody in MLECs from CTR and dKO mice with vehicle or captopril. n = 5. H Representative IF staining of AMPKα in aortas from CTR and dKO mice with vehicle or captopril. CD31 is an endothelial cell marker. Scale bar: 50 μm. Quantitative data analysis (below). n = 5. I Representative IHC staining for caveolin-1 in aortas from CTR and dKO mice with vehicle or captopril, Scale bar: 200 μm/50 μm. Quantitative data analysis (below). n = 5. J MLECs from CTR and dKO mice with vehicle or captopril with different treatments were stained with FITC-conjugated annexin V and PI and analyzed by flow cytometry. n = 3. K WB analysis of caspase 3 and cleaved-caspase 3 protein levels in MLECs from CTR and dKO mice with vehicle or captopril with different treatments. n = 5. Data are presented as mean ± SEM. One-way ANOVA followed by Bonferroni post hoc analysis for (A), (E), (F), (H), (I), (J), and (K). Two-way ANOVA followed by Bonferroni post hoc test for (B) to (D).
Fig. 7
Fig. 7. Captopril activates Sp1 and Sp3 via bradykinin B1 receptor.
A WB analysis of Sp1 and Sp3 protein levels in HUVECs with different treatments. n = 6. B qPCR analysis of Sp1 and Sp3 mRNA levels in HUVECs with different treatments. n = 6. C, D ChIP assays showing the binding of Sp1 or Sp3 to the AMPKα1 (C) and AMPKα2 (D) promoter in HUVECs with different treatments. n = 3. E Relative luciferase activity for the WT and mutant constructs of AMPKα1 and AMPKα2 promoter in HUVECs with vehicle or captopril. n = 4. F Relative luciferase activity for the WT constructs of AMPKα1 and AMPKα2 promoter in HUVECs with different treatments. n = 4. G qPCR analysis of Sp1 and Sp3 mRNA levels in HUVECs with different treatments. n = 3. HJ WB analysis of Sp1 and Sp3 protein levels in HUVECs with different treatments. n = 6. Data are presented as mean ± SEM. Two-way ANOVA followed by Bonferroni post hoc analysis for (A) to (J).
Fig. 8
Fig. 8. HDAC1-mediated Sp1/Sp3 deacetylation is responsible for captopril-induced AMPKα1/AMPKα2 transcription activation.
A CoIP assay of Sp1 ubiquitination in HUVECs transfected with Flag-Sp1-WT or Flag-Sp1-K703A with different treatments. Quantified analysis of ubiquitin protein level (below). n = 3. B Co-IP analysis of Sp3 ubiquitination in HUVECs transfected with Flag-Sp3-WT or Flag-Sp3-K551R with different treatments. Quantified analysis of ubiquitin protein level (below). n = 3. C, D CoIP assay of C Sp1 and D Sp3 ubiquitination in HUVECs treated with captopril. Quantified analysis of ubiquitin protein level (below). n = 3. E CoIP assay of acetylation levels of Sp1 or Sp3 in HUVECs treated with captopril. Quantified analysis of acetyl-protein level (below). n = 3. F CoIP assay of HDAC1 in HUVECs treated with captopril. Quantified analysis of HDAC1 protein level (below). n = 3. G, H ChIP assay showing the binding of Sp1 or Sp3 to the AMPKα1 (G) and AMPKα2 (H) promoter in HUVECs with different treatments. n = 3. I Relative luciferase activity for the WT constructs of AMPKα1 and AMPKα2 promoter in HUVECs with different treatments. n = 4. Data are presented as mean ± SEM. Two-tailed Student unpaired t test for (E) and (F). One-way ANOVA followed by Bonferroni post hoc analysis for (GI). Two-way ANOVA followed by Bonferroni post hoc test for (AD).

References

    1. Abubakar I, Tillmann T, Banerjee A. Global, regional, and national age-sex specific all-cause and cause-specific mortality for 240 causes of death, 1990–2013: a systematic analysis for the Global Burden of Disease Study 2013. Lancet. 2015;385:117–171. - PMC - PubMed
    1. Naghavi M, et al. Global, regional, and national age-sex specific mortality for 264 causes of death, 1980–2016: a systematic analysis for the Global Burden of Disease Study 2016. Lancet. 2017;390:1151–1210. - PMC - PubMed
    1. Lifton RP, Gharavi AG, Geller DS. Molecular mechanisms of human hypertension. Cell. 2001;104:545–556. - PubMed
    1. Dominiczak AF, Kuo D. Hypertension: update 2017. Hypertension. 2017;69:3–4. - PubMed
    1. Padmanabhan S, Caulfield M, Dominiczak AF. Genetic and molecular aspects of hypertension. Circ Res. 2015;116:937–959. - PubMed

Publication types

LinkOut - more resources