

Characterizing temporal trends in populations exposed to aircraft noise around U.S. airports: 1995-2015
- PMID: 37735518
- PMCID: PMC11876072
- DOI: 10.1038/s41370-023-00575-5
Characterizing temporal trends in populations exposed to aircraft noise around U.S. airports: 1995-2015
Abstract
Background: Aircraft noise is a key concern for communities surrounding airports, with increasing evidence for health effects and inequitable distributions of exposure. However, there have been limited national-scale assessments of aircraft noise exposure over time and across noise metrics, limiting evaluation of population exposure patterns.
Objective: We evaluated national-scale temporal trends in aviation noise exposure by airport characteristics and across racial/ethnic populations in the U.S.
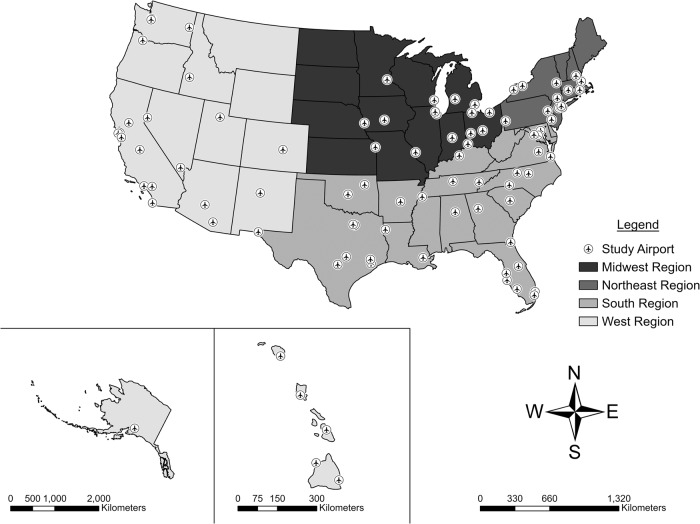
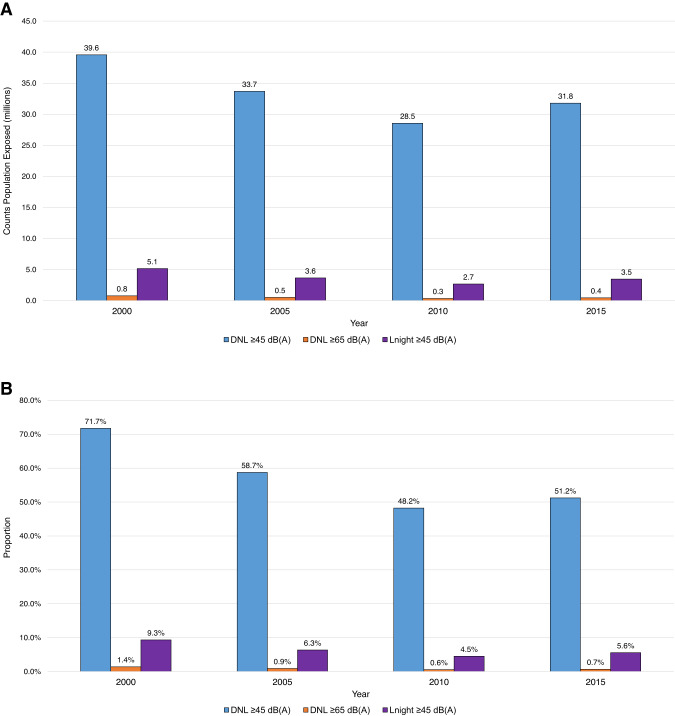
Methods: Noise contours were modeled for 90 U.S. airports in 5-year intervals between 1995 and 2015 using the Federal Aviation Administration's Aviation Environmental Design Tool. We utilized linear fixed effects models to estimate changes in noise exposure areas for day-night average sound levels (DNL) of 45, 65, and a nighttime equivalent sound level (Lnight) of 45 A-weighted decibels (dB[A]). We used group-based trajectory modeling to identify distinct groups of airports sharing underlying characteristics. We overlaid noise contours and Census tract data from the U.S. Census Bureau and American Community Surveys for 2000 to 2015 to estimate exposure changes overall and by race/ethnicity.
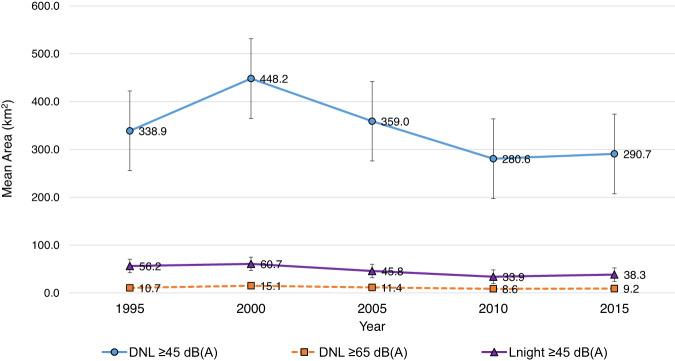
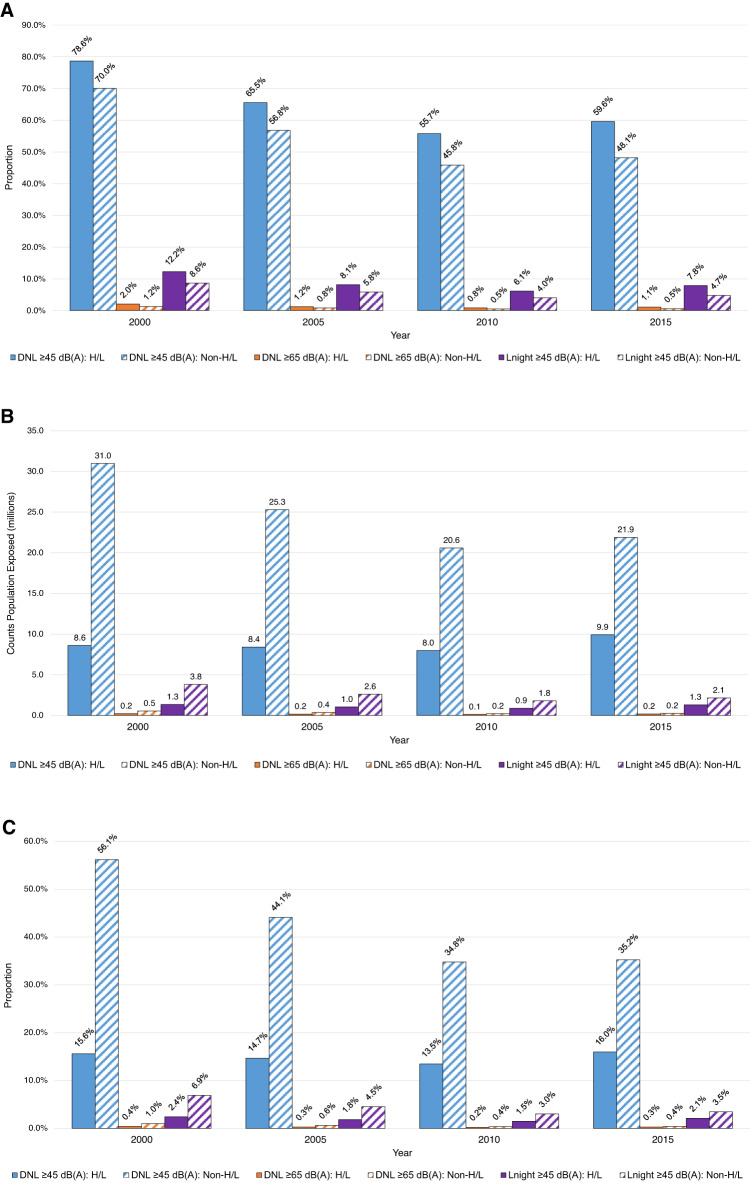
Results: National-scale analyses showed non-monotonic trends in mean exposed areas that peaked in 2000, followed by a 37% decrease from 2005 to 2010 and a subsequent increase in 2015. We identified four distinct trajectory groups of airports sharing latent characteristics related to size and activity patterns. Those populations identifying as minority (e.g., Hispanic/Latino, Black/African American, Asian) experienced higher proportions of exposure relative to their subgroup populations compared to non-Hispanic or White populations across all years, indicating ethnic and racial disparities in airport noise exposure that persist over time.
Significance: Overall, these data identified differential exposure trends across airports and subpopulations, helping to identify vulnerable communities for aviation noise in the U.S.
Impact statement: We conducted a descriptive analysis of temporal trends in aviation noise exposure in the U.S. at a national level. Using data from 90 U.S. airports over a span of two decades, we characterized the noise exposure trends overall and by airport characteristics, while estimating the numbers of exposed by population demographics to help identify the impact on vulnerable communities who may bear the burden of aircraft noise exposure.
Keywords: Environmental justice; Geospatial analyses; Vulnerable populations.
© 2023. This is a U.S. Government work and not under copyright protection in the US; foreign copyright protection may apply.
Conflict of interest statement
Competing interests: The authors declare no competing interests.
Figures

Similar articles
-
Aircraft noise exposure and body mass index among female participants in two Nurses' Health Study prospective cohorts living around 90 airports in the United States.Environ Int. 2024 May;187:108660. doi: 10.1016/j.envint.2024.108660. Epub 2024 Apr 15. Environ Int. 2024. PMID: 38677085 Free PMC article.
-
Sociodemographic Patterns of Exposure to Civil Aircraft Noise in the United States.Environ Health Perspect. 2022 Feb;130(2):27009. doi: 10.1289/EHP9307. Epub 2022 Feb 15. Environ Health Perspect. 2022. PMID: 35167327 Free PMC article.
-
Impact of short-term aircraft noise on cardiovascular disease risk in the area surrounding London Heathrow airport: the RISTANCO epidemiological study.Public Health Res (Southampt). 2024 Dec;12(13):1-58. doi: 10.3310/UTCE9104. Public Health Res (Southampt). 2024. PMID: 39648696
-
Aviation Noise Impacts: State of the Science.Noise Health. 2017 Mar-Apr;19(87):41-50. doi: 10.4103/nah.NAH_104_16. Noise Health. 2017. PMID: 29192612 Free PMC article. Review.
-
Aircraft Noise Distribution as a Fairness Dilemma-A Review of Aircraft Noise through the Lens of Social Justice Research.Int J Environ Res Public Health. 2021 Jul 11;18(14):7399. doi: 10.3390/ijerph18147399. Int J Environ Res Public Health. 2021. PMID: 34299850 Free PMC article. Review.
Cited by
-
Aircraft noise exposure and body mass index among female participants in two Nurses' Health Study prospective cohorts living around 90 airports in the United States.Environ Int. 2024 May;187:108660. doi: 10.1016/j.envint.2024.108660. Epub 2024 Apr 15. Environ Int. 2024. PMID: 38677085 Free PMC article.
-
Towards extending the aircraft flight envelope by mitigating transonic airfoil buffet.Nat Commun. 2024 Jun 12;15(1):5020. doi: 10.1038/s41467-024-49361-3. Nat Commun. 2024. PMID: 38866747 Free PMC article.
References
-
- BTS. Table 1–37: U.S. Air carrier aircraft departures, enplaned revenue passengers, and enplaned revenue tons [Internet]. 2020. Available from: https://www.bts.gov/content/us-air-carrier-aircraft-departures-enplaned-...
-
- Girvin R. Aircraft noise-abatement and mitigation strategies. J Air Transp Manag. 2009;15:14–22.
-
- Guski R. The increase of aircraft noise annoyance in communities. Causes and consequences [Internet]. 12th ICBEN congress on noise as a public health problem, Zurich. 2017. Available from: http://www.icben.org/2017/ICBEN%202017%20Papers/Keynote04_Guski_4164.pdf
-
- World Health Organization. Environmental noise guidelines for the European Region [Internet]. ISBN: 978-92-890-5356-3. 2018 [cited 2021 Oct 12]. Available from: http://www.euro.who.int/__data/assets/pdf_file/0008/383921/noise-guideli...
MeSH terms
LinkOut - more resources
Full Text Sources
Miscellaneous
