. 2023 Sep 21;14(1):5867.
doi: 10.1038/s41467-023-41213-w.

Regulation of cellular cholesterol distribution via non-vesicular lipid transport at ER-Golgi contact sites

Affiliations

Regulation of cellular cholesterol distribution via non-vesicular lipid transport at ER-Golgi contact sites

Tomoki Naito et al. Nat Commun. .

Abstract

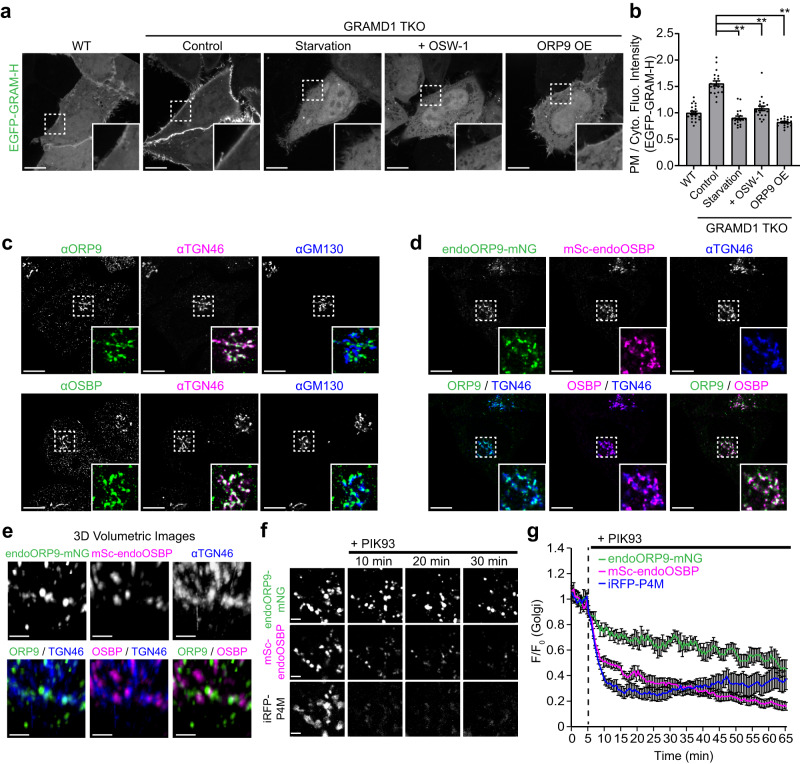
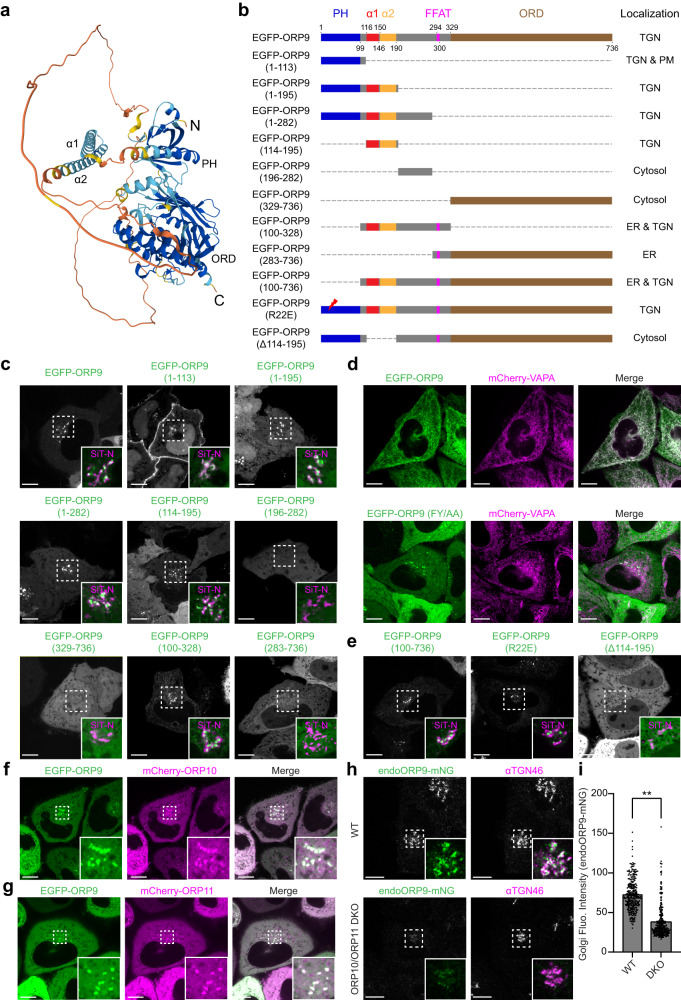
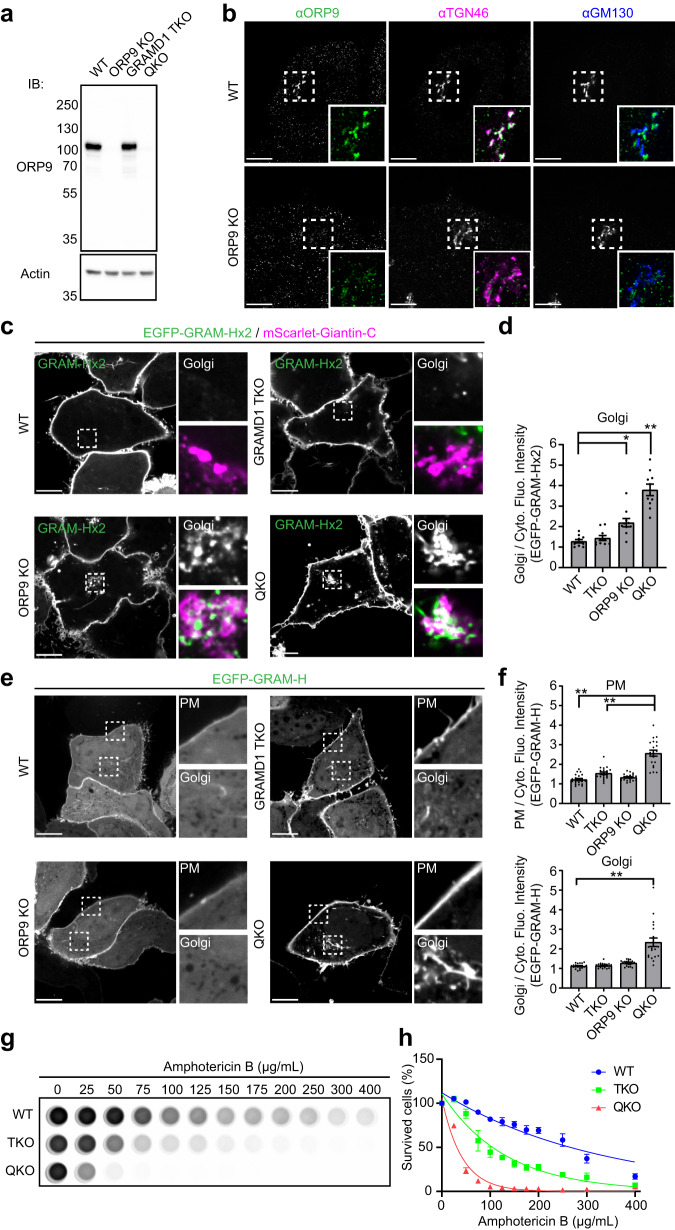
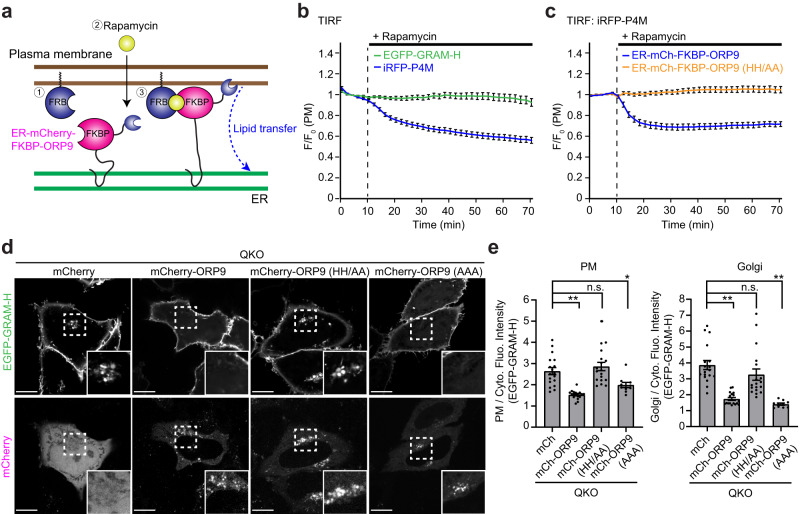
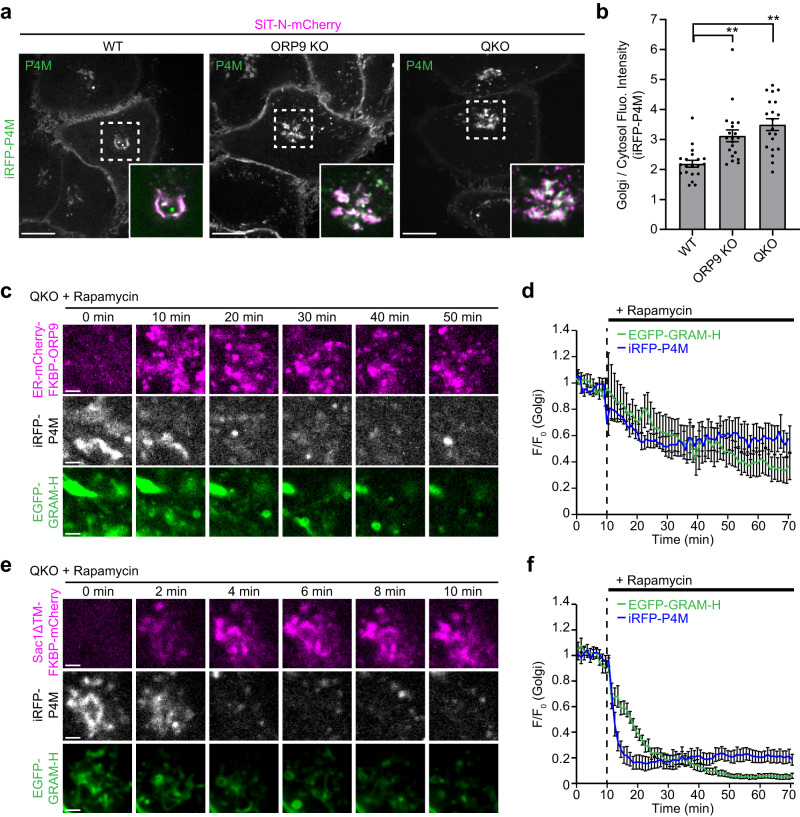
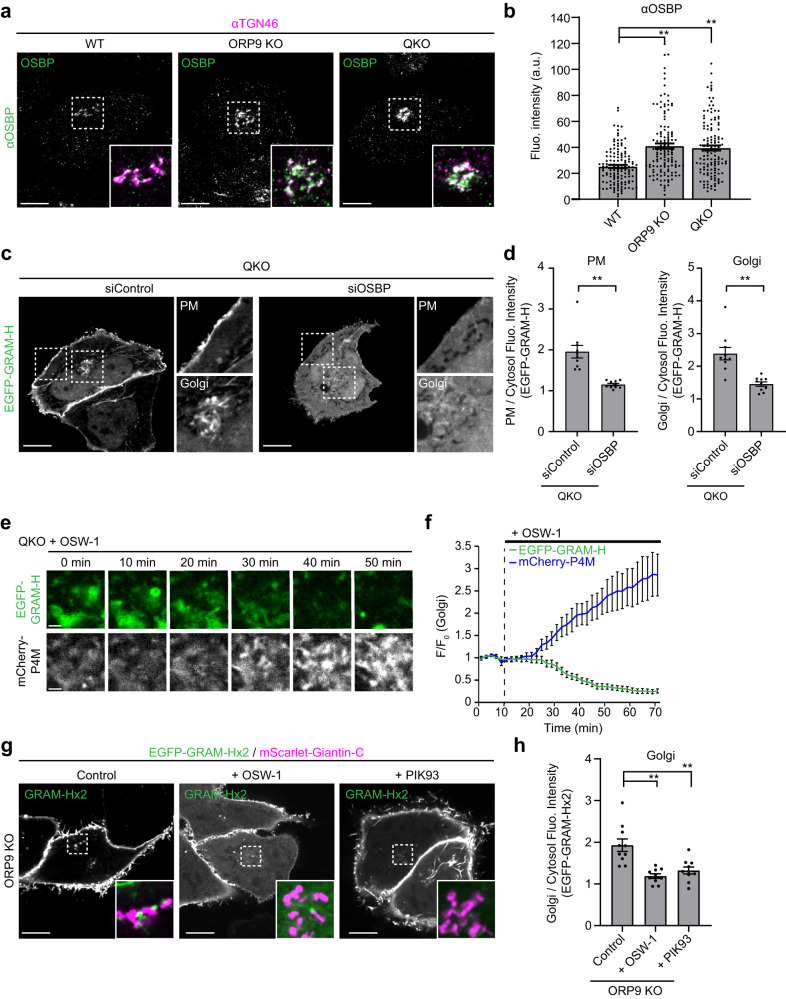
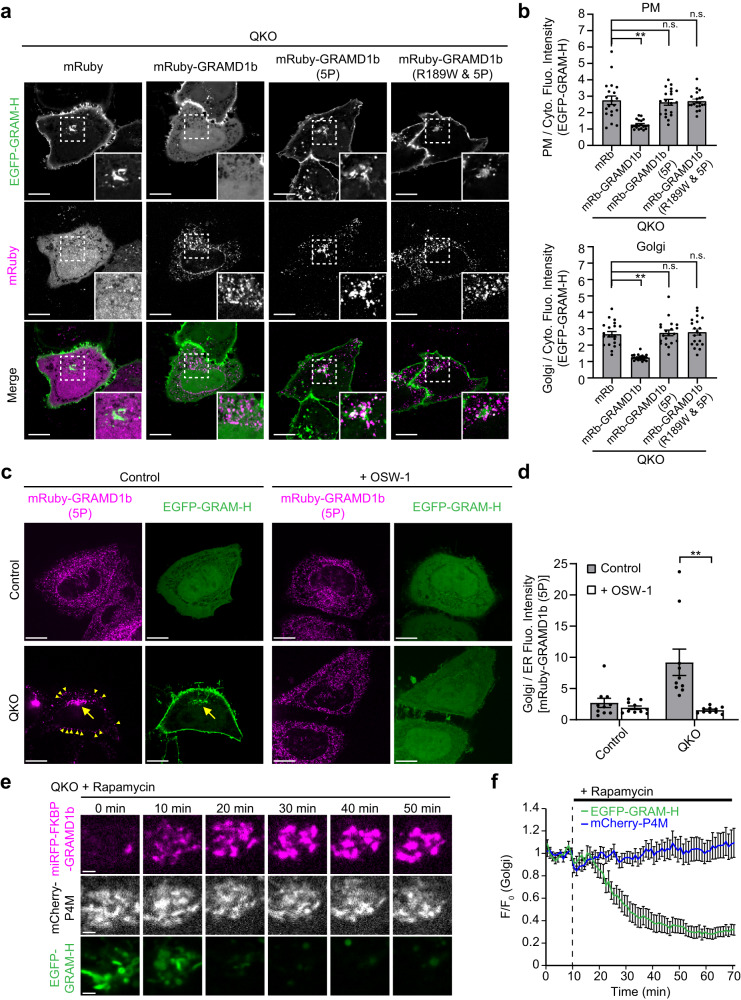
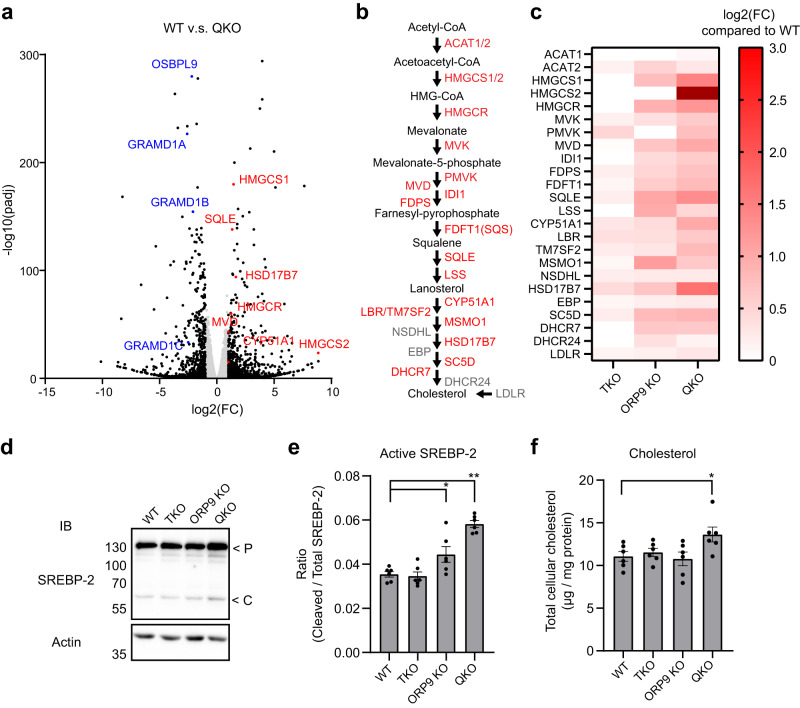
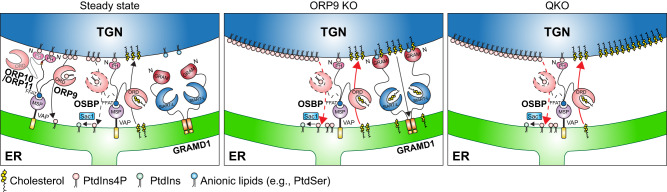
Abnormal distribution of cellular cholesterol is associated with numerous diseases, including cardiovascular and neurodegenerative diseases. Regulated transport of cholesterol is critical for maintaining its proper distribution in the cell, yet the underlying mechanisms remain unclear. Here, we show that lipid transfer proteins, namely ORP9, OSBP, and GRAMD1s/Asters (GRAMD1a/GRAMD1b/GRAMD1c), control non-vesicular cholesterol transport at points of contact between the ER and the trans-Golgi network (TGN), thereby maintaining cellular cholesterol distribution. ORP9 localizes to the TGN via interaction between its tandem α-helices and ORP10/ORP11. ORP9 extracts PI4P from the TGN to prevent its overaccumulation and suppresses OSBP-mediated PI4P-driven cholesterol transport to the Golgi. By contrast, GRAMD1s transport excess cholesterol from the Golgi to the ER, thereby preventing its build-up. Cells lacking ORP9 exhibit accumulation of cholesterol at the Golgi, which is further enhanced by additional depletion of GRAMD1s with major accumulation in the plasma membrane. This is accompanied by chronic activation of the SREBP-2 signalling pathway. Our findings reveal the importance of regulated lipid transport at ER-Golgi contacts for maintaining cellular cholesterol distribution and homeostasis.


Conflict of interest statement

The authors declare no competing interests.

Figures

Fig. 1
Fig. 1. ORP9 regulates the abundance of accessible cholesterol in the PM.
a Confocal images of live wild-type (WT) HeLa cells and HeLa cells lacking GRAMD1s (GRAMD1 TKO), expressing EGFP-tagged GRAM-H (EGFP-GRAM-H) (accessible cholesterol biosensor), under indicated conditions [Starvation: treatment with DMEM supplemented with 10% LPDS and 50 µM mevastatin for 16 h; OSW-1: treatment with 20 nM OSW-1 (OSBP inhibitor) for 1 h; ORP9 OE: co-expression with mCherry-tagged ORP9 for 16 h]. Insets show at higher magnification the regions indicated by white dashed boxes. Scale bars, 10 µm. b Quantification of the ratio of PM signals to the cytosolic signals of EGFP-GRAM-H, as assessed by confocal microscopy and line scan analysis (mean ± SEM, n = 20 cells for each condition; data are pooled from two independent experiments; Dunnett’s multiple comparisons test, **P < 0.0001). c Confocal images of fixed HeLa cells immunolabeled with antibodies against ORP9, OSBP, TGN46, and GM130. Scale bars, 10 µm. d Confocal images of fixed HeLa cells, in which mNeonGreen was tagged to the C-terminus of ORP9 (endoORP9-mNG) and mScarlet-I was tagged to the N-terminus of OSBP (mSc-endoOSBP). To visualize TGN, cells were fixed and immunolabeled with antibodies against TGN46. Scale bars, 10 µm. e 3D reconstruction of SDC-SIM images of fixed HeLa cells expressing endoORP9-mNG and mSc-endoOSBP that were immunolabeled with antibodies against TGN46, mNeonGreen, and mCherry. Scale bars 1 µm. f Confocal images from the regions around the Golgi of a live HeLa cell expressing endoORP9-mNG and mSc-endoOSBP together with iRFP-tagged P4M (iRFP-P4M) (PI4P biosensor) that were treated with PIK93 (250 nM) for the indicated minutes. Scale bars, 2 µm. g Time course of normalized signals of endoORP9-mNG, mSc-endoOSBP, and iRFP-P4M at the regions around the TGN in response to PIK93 (250 nM), as assessed by confocal microscopy as shown in (f) (mean ± SEM, n = 21 cells for each condition; data are pooled from two independent experiments). Source data are provided as a Source Data file.
Fig. 2
Fig. 2. ORP9 localizes to the TGN via its N-terminal PH domain and tandem α-helices.
a The ribbon diagram of the modeled ORP9 (see Materials and Methods). PH, pleckstrin homology; ORD, OSBP-related domain; N, N-terminus; C, C-terminus. b Domain structure of ORP9 and of various versions of ORP9 analyzed in this study. c Confocal images of live HeLa cells expressing either EGFP-tagged ORP9 full-length (EGFP-ORP9) or one of the indicated versions of EGFP-ORP9 as shown in (b), together with a TGN marker, mCherry-tagged N-terminus of sialyltransferase (SiT-N-mCherry). Insets show at higher magnification the regions around the TGN as indicated by white dashed boxes (green: the indicated version of EGFP-ORP9; magenta: SiT-N-mCherry). Scale bars, 10 µm. d Confocal images of live HeLa cells expressing either EGFP-ORP9 or EGFP-ORP9 carrying the FY/AA mutation in its FFAT motif [EGFP-ORP9 (FY/AA)] together with mCherry-tagged VAPA (mCherry-VAPA). Note the recruitment of EGFP-ORP9, but not EGFP-ORP9 (FY/AA), to the ER labelled by mCherry-VAPA. Scale bars, 10 µm. e Confocal images of live HeLa cells expressing one of the indicated versions of EGFP-ORP9 as shown in (b), together with SiT-N-mCherry. Insets show at higher magnification the regions around the TGN as indicated by white dashed boxes (green: the indicated versions of EGFP-ORP9; magenta: SiT-N-mCherry). Scale bars, 10 µm. f, g Confocal images of live HeLa cells expressing EGFP-ORP9 together with either mCherry-tagged ORP10 (mCherry-ORP10) or mCherry-tagged ORP11 (mCherry-ORP11). Note the extensive colocalization of EGFP-ORP9 with mCherry-ORP10 and mCherry-ORP11. Insets show at higher magnification the regions as indicated by white dashed boxes. Scale bars, 10 µm. h Confocal images of fixed WT HeLa cells and HeLa cells lacking ORP10 and ORP11 [ORP10/ORP11 double knockout (DKO)], in which mNeonGreen was tagged to the C-terminus of ORP9 (endoORP9-mNG). Cells were immunolabeled with antibodies against TGN46. Insets show at higher magnification the regions around the Golgi as indicated by white dashed boxes (green: endoORP9-mNG; magenta: TGN46). Scale bars, 10 μm. i Quantification of endoORP9-mNG fluorescence signals at the Golgi as shown in (h) [mean ± SEM, n = 296 cells (WT), n = 325 cells (DKO); data are pooled from two independent experiments; two-tailed unpaired Student’s t-test, **P < 0.0001]. Source data are provided as a Source Data file.
Fig. 3
Fig. 3. Depletion of ORP9 causes accumulation of accessible cholesterol in the Golgi, which is further enhanced by the additional depletion of GRAMD1s with major accumulation in the PM.
a Lysates of WT HeLa cells, HeLa cells lacking ORP9 (ORP9 KO), GRAMD1 TKO HeLa cells, and HeLa cells lacking ORP9 and GRAMD1s (QKO) were processed by SDS–PAGE and immunoblotting (IB) with anti-ORP9 and anti-actin antibodies. b Confocal images of fixed WT and ORP9 KO HeLa cells that were immunolabeled with antibodies against ORP9, TGN46, and GM130. Scale bars, 10 µm. Note that anti-ORP9 signals in ORP9 KO cells are non-specific. c Confocal images of live WT, GRAMD1 TKO, ORP9 KO, and QKO HeLa cells expressing EGFP-GRAM-Hx2 (accessible cholesterol biosensor) and mScarlet-tagged C-terminus of Giantin (mScarlet-Giantin-C). Insets show at higher magnification the regions around the Golgi as indicated by white dashed boxes (in the bottom insets, green: EGFP-GRAM-Hx2; magenta: mScarlet-Giantin-C). Scale bars, 10 µm. d Quantification of the ratio of Golgi signals to the cytosolic signals of EGFP-GRAM-Hx2 as shown in (c) [mean ± SEM, n = 10 cells for each condition; data are pooled from one experiment; Dunnett’s multiple comparisons test, *P = 0.0047 (WT vs ORP9 KO), **P < 0.0001 (WT vs QKO)]. e Confocal images of live WT, GRAMD1 TKO, ORP9 KO, and QKO HeLa cells expressing EGFP-GRAM-H (accessible cholesterol biosensor). Insets show at higher magnification the regions around the plasma membrane (PM) and the Golgi as indicated by white dashed boxes. Scale bars, 10 µm. f Quantification of the ratio of PM signals (top) and Golgi signals (bottom) to the cytosolic signals of EGFP-GRAM-H as shown in (e) (mean ± SEM, n = 20 cells for each condition; data are pooled from two independent experiments; Dunnett’s multiple comparisons test, **P < 0.0001). g Amphotericin B resistance of WT, GRAMD1 TKO, and QKO HeLa cells. Cells were treated with indicated concentration of Amphotericin B for 20 min at 37 °C. After overnight recovery in culture media, cell viability was measured by detecting ATP present in each well via luminescence (see Methods). h Quantification of cell viability with increasing amount of Amphotericin B, as shown in (g) (mean ± SEM, n = 4 independent experiments for each condition). Source data are provided as a Source Data file.
Fig. 4
Fig. 4. The ORD of ORP9 must extract PI4P to maintain proper distribution of cellular cholesterol.
a Schematic representation of the rapamycin-induced recruitment strategy used for the recruitment of ER-anchored ORD of ORP9 (ER-mCherry-FKBP-ORP9) to the PM. ER-mCherry-FKBP-ORP9 was rapidly recruited to the PM by rapamycin-induced dimerization of FRB and FKBP. ER-mCherry-FKBP-ORP9 was expressed in QKO HeLa cells together with a tagBFP-tagged FRB module that is targeted to the PM (PM-FRB-tagBFP). b Time course of normalized signals of EGFP-GRAM-H (accessible cholesterol biosensor) and iRFP-P4M (PI4P biosensor) in response to rapamycin, as assessed by TIRF microscopy of QKO HeLa cells expressing ER-mCherry-FKBP-ORP9 and PM-FRB-tagBFP together with EGFP-GRAM-H and iRFP-P4M. Rapamycin addition (200 nM) is indicated (mean ± SEM, n = 29 cells for each condition; data are pooled from three independent experiments). c Time course of normalized iRFP-P4M signals in response to rapamycin, as assessed by TIRF microscopy of QKO HeLa cells expressing either ER-mCherry-FKBP-ORP9 or ER-mCherry-FKBP-ORP9 carrying PI4P binding-deficient ORD [ER-mCherry-FKBP-ORP9 (HH/AA)] together with PM-FRB-tagBFP and iRFP-P4M. Rapamycin addition (200 nM) is indicated [mean ± SEM, n = 24 cells (WT), n = 30 (HH/AA); data are pooled from two independent experiments]. d Confocal images of live QKO HeLa cells expressing EGFP-GRAM-H together with either mCherry control, mCherry-ORP9, mCherry-ORP9 carrying PI4P binding-deficient ORD [mCherry-ORP9 (HH/AA)], or mCherry-ORP9 carrying phosphatidylserine binding-deficient ORD [mCherry-ORP9 (AAA)]. Insets show at higher magnification the regions around the Golgi as indicated by white dashed boxes. Scale bars, 10 µm. e Quantification of the ratio of PM signals (left) and Golgi signals (right) to the cytosolic signals of EGFP-GRAM-H, as shown in (d) {mean ± SEM, n = 20 cells for mCherry, mCherry-ORP9, and mCherry-ORP9 (HH/AA); n = 10 cells for mCherry-ORP9 (AAA) (PM), n = 18 cells for mCherry, mCherry-ORP9 and mCherry-ORP9 (HH/AA); n = 10 cells for mCherry-ORP9 (AAA) (Golgi); data are pooled from two independent experiments for mCherry, mCherry-ORP9, and mCherry-ORP9 (HH/AA); one experiment for mCherry-ORP9 (AAA); Dunnett’s multiple comparisons test, **P < 0.0001, *P = 0.0251 [PM: mCh vs mCh-ORP9 (AAA)]. n.s. denotes not significant}. Source data are provided as a Source Data file.
Fig. 5
Fig. 5. ORP9 extraction of PI4P from the TGN helps maintain levels of accessible cholesterol in the Golgi.
a Confocal images of live WT, ORP9 KO, QKO HeLa cells expressing iRFP-P4M (PI4P biosensor), together with a TGN marker, SiT-N-mCherry. Insets show at higher magnification the regions around the TGN as indicated by white dashed boxes (green: iRFP-P4M; magenta: SiT-N-mCherry). Scale bars, 10 µm. b Quantification of the ratio of Golgi signals to the cytosolic signals of iRFP-P4M, as shown in (a) [mean ± SEM, n = 20 cells for each condition; data are pooled from two independent experiments; Dunnett’s multiple comparisons test, **P = 0.0007 (WT vs ORP9 KO), **P < 0.0001 (WT vs QKO)]. c Confocal images of the regions around the Golgi of a live QKO HeLa cell expressing ER-mCherry-FKBP-ORP9 and tagBFP-TGN38-FRB together with EGFP-GRAM-H (accessible cholesterol biosensor) and iRFP-P4M that were treated with rapamycin (200 nM) for the indicated minutes. Scale bars, 2 µm. d Time course of normalized signals of EGFP-GRAM-H and iRFP-P4M in response to rapamycin, as assessed by confocal microscopy as shown in (c) (mean ± SEM, n = 14 cells; data are pooled from three independent experiments.). e Confocal images of the regions around the Golgi of a live QKO HeLa cell expressing mCherry-tagged Sac1ΔTM (PI4P phosphatase domain of Sac1) fused with FKBP module [Sac1ΔTM-FKBP-mCherry] and tagBFP-TGN38-FRB together with EGFP-GRAM-H and iRFP-P4M treated with rapamycin (200 nM) for the indicated minutes. Scale bars, 2 µm. f Time course of normalized signals of EGFP-GRAM-H and iRFP-P4M in response to rapamycin, as assessed by confocal as shown in (e) (mean ± SEM, n = 15 cells; data are pooled from two independent experiments). Source data are provided as a Source Data file.
Fig. 6
Fig. 6. Accumulation of TGN PI4P in QKO cells is associated with hyperactivation of OSBP-mediated cholesterol transport to the Golgi.
a Confocal images of fixed HeLa cells that were immunolabeled with indicated antibodies. Insets show the regions around the Golgi as indicated by white dashed boxes (green: OSBP; magenta: TGN46). Scale bars, 10 µm. b Quantification of the signals of anti-OSBP fluorescence at the regions around the Golgi, as shown in (a) [mean ± SEM, n = 131 cells (WT), n = 133 cells (ORP9 KO), n = 127 cells (QKO); data are pooled from two experiments; Dunnett’s multiple comparisons test, **P < 0.0001]. c Confocal images of live QKO HeLa cells expressing EGFP-GRAM-H that were treated with indicated siRNA for 72 hrs. Insets show the regions around the PM and Golgi as indicated by white dashed boxes. Scale bars, 10 µm. d Quantification of the ratio of PM signals (left) and Golgi signals (right) to the cytosolic signals of EGFP-GRAM-H, as shown in (c) [mean ± SEM, n = 10 cells for each condition; data are pooled from one experiment; two-tailed unpaired Student’s t-test **P < 0.0001 (PM), **P = 0.0002 (Golgi)]. e Confocal images of the regions around the TGN of a live QKO HeLa cell expressing EGFP-GRAM-H and mCherry-P4M that were treated with OSW-1 (20 nM) as indicated. Scale bars, 2 µm. f Time course of normalized signals of EGFP-GRAM-H and mCherry-P4M in response to OSW-1 as shown in (e) (mean ± SEM, n = 10 cells for each condition; data are pooled from two independent experiments). g Confocal images of live ORP9 KO HeLa cells expressing EGFP-GRAM-Hx2 and mScarlet-Giantin-C that were treated with or without OSW-1 (20 nM for 1 h) or PIK93 (250 nM for 1 h). Insets show the regions around the Golgi as indicated by white dashed boxes (green: EGFP-GRAM-Hx2; magenta: mScarlet-Giantin-C). Scale bars, 10 µm. h Quantification of the ratio of Golgi signals to the cytosolic signals of EGFP-GRAM-Hx2 as shown in (g) [mean ± SEM, n = 10 cells for each condition; data are pooled from one experiment; Dunnett’s multiple comparisons test, **P < 0.0001 (+ OSW-1), **P = 0.0006 (+ PIK93)]. Source data are provided as a Source Data file.
Fig. 7
Fig. 7. GRAMD1b acts at ER-TGN contact sites to remove excess cholesterol from the Golgi.
a Confocal images of live QKO HeLa cells expressing either mRuby control, mRuby-tagged GRAMD1b (mRuby-GRAMD1b), mRuby-GRAMD1b carrying cholesterol binding-deficient StART-like domain [mRuby-GRAMD1b (5P)], or mRuby-GRAMD1b (5P) carrying cholesterol sensing-deficient GRAM domain [mRuby-GRAMD1b (R189W & 5P)] together with EGFP-GRAM-H (accessible cholesterol biosensor). Insets show at higher magnification the regions around the Golgi as indicated by white dashed boxes. Scale bars, 10 µm. b Quantifications of the ratio of PM signals (top) and Golgi signals (bottom) to the cytosolic signals of EGFP-GRAM-H, as shown in (a) (mean ± SEM, n = 10 cells for each condition; data are pooled from one experiment; Dunnett’s multiple comparisons test, **P < 0.0001). c Confocal images of live WT and QKO HeLa cells expressing EGFP-GRAM-H and mRuby-GRAMD1b (5P) that were treated with or without OSW-1 (20 nM for 1 h; OSBP inhibitor) as indicated. Yellow allows indicate the site of mRuby-GRAMD1b (5P) accumulation around the Golgi. Yellow arrowheads indicate the sites of mRuby-GRAMD1b (5P) accumulation at the PM. Note the dissociation of mRuby-GRAMD1b (5P) from the Golgi upon OSW-1 treatment. Scale bars, 10 µm. d Quantification of the ratio of Golgi signals to the endoplasmic reticulum (ER) signals of mRuby-GRAMD1b (5P),as shown in (c) (mean ± SEM, n = 10 cells for each condition; data are pooled from one experiment; two-tailed unpaired Student’s t-test **P = 0.0020). e Confocal images of the regions around the TGN of a QKO HeLa cell expressing miRFP-FKBP-GRAMD1b and tagBFP-TGN38-FRB together with EGFP-GRAM-H and mCherry-P4M (PI4P biosensor) that were treated with rapamycin (200 nM) for the indicated minutes. Scale bars, 2 µm. f Time course of normalized signals of EGFP-GRAM-H and iRFP-P4M in response to rapamycin, as assessed by confocal microscopy as shown in (e) (mean ± SEM, n = 18 cells; data are pooled from four independent experiments). Source data are provided as a Source Data file.
Fig. 8
Fig. 8. QKO cells exhibit dysregulated SREBP-2 signalling and increased cholesterol production.
a Volcano plot showing transcriptome-wide changes in gene expression in QKO HeLa cells compared to WT HeLa cells. RNA was extracted from cells cultured in medium supplemented with 10% FBS. Data are presented with fold change in log2 [log2(FC)] and adjusted P values in -log10 [-log10(padj)]. Black dots are differentially expressed genes [fold change > 2.0 adjusted P values < 0.02]. Red dots are representative genes involved in the mevalonate pathway. Blue dots are genes deleted in QKO cells by CRISPR/Cas9. Data are pooled from three independent experiments. b The mevalonate pathway biosynthesizes cholesterol. Genes shown in red are upregulated in QKO HeLa cells compared to WT HeLa cells [fold change > 2.0 adjusted P values < 0.02]. c Heatmap displaying relative expression of genes involved in the mevalonate pathway as shown in (b) in GRAMD1 TKO (TKO), ORP9 KO, and QKO HeLa cells compared to WT HeLa cells. d Lysates of WT, TKO, ORP9 KO, and QKO HeLa cells that were cultured in medium supplemented with 10% FBS were processed for SDS-PAGE and IB with anti-SREBP-2 and anti-actin antibodies. Precursor(P) and cleaved (C) forms of SREBP-2 are indicated. e Quantification of the ratio of cleaved SREBP-2 to total SREBP-2 [mean ± SEM, n = 6 lysates (independent experiments) for each condition; Dunnett’s multiple comparisons test, *P = 0.0285, **P < 0.0001]. f Quantification of total cellular cholesterol in WT, TKO, ORP9 KO, and QKO HeLa cells that were cultured in medium supplemented with 10% FBS. Lipids were extracted from the cells, and the amount of total cellular cholesterol was assessed by cholesterol oxidase reaction. Lysate of the cells were collected and processed for BCA protein assay for normalization (mean ± SEM, n = 6 independent experiment for each condition; Dunnett’s multiple comparisons test, *P = 0.0443). Source data are provided as a Source Data file.
Fig. 9
Fig. 9. Models of the regulation of non-vesicular cholesterol transport at ER-TGN contacts.
Models of the regulation of non-vesicular cholesterol transport at ER-TGN contacts. ORP9 and OSBP are recruited to the ER via interaction of their FFAT motif with the MSP domain of VAPs. GRAMD1s are anchored to the ER via their transmembrane domain. ORP9 is recruited to the TGN via interaction with ORP10 and ORP11, which is mediated by its tandem α-helices. Left: at steady state, ORP9 extracts PI4P from the TGN membrane via its ORD and inhibits OSBP-mediated PI4P-driven cholesterol transport from the ER to the TGN to maintain cholesterol levels at the Golgi. The GRAM domains of GRAMD1s only weakly interact with the TGN membrane at this state because of the limited abundance/accessibility of cholesterol in the Golgi. Middle: when levels of accessible cholesterol in TGN membranes rise above a certain threshold (e.g., OSBP hyperactivation due to ORP9 KO), GRAMD1s move to ER-TGN contacts by their ability to sense accessible cholesterol via their GRAM domain. They then transport excess cholesterol from the TGN to the ER via their StART-like domain, thereby preventing the buildup of cholesterol in the Golgi. Right: in the simultaneous absence of ORP9 and GRAMD1s (QKO), major accumulation of cholesterol occurs in both the Golgi and post-Golgi membranes, including the PM. This is caused by: (1) hyperactivation of OSBP (due to the lack of ORP9), and (2) impairment of cholesterol extraction and transport from the TGN (and also from the PM) to the ER (due to the lack of GRAMD1s). This is accompanied by chronic depletion of cholesterol from the ER membrane, resulting in aberrant activation of the SREBP-2 signalling pathway and overproduction of cholesterol.

Similar articles

Cited by

References

    1. van Meer G, Voelker DR, Feigenson GW. Membrane lipids: where they are and how they behave. Nat. Rev. Mol. Cell Biol. 2008;9:112–124. - PMC - PubMed
    1. Vance JE. Phospholipid synthesis and transport in mammalian cells. Traffic. 2015;16:1–18. - PubMed
    1. Norman AW, Mizwicki MT, Norman DP. Steroid-hormone rapid actions, membrane receptors and a conformational ensemble model. Nat. Rev. Drug Discov. 2004;3:27–41. - PubMed
    1. Griffiths WJ, Wang Y. Sterols, oxysterols, and accessible cholesterol: signalling for homeostasis, in immunity and during development. Front. Physiol. 2021;12:723224. - PMC - PubMed
    1. Dai L, et al. Cholesterol metabolism in neurodegenerative diseases: molecular mechanisms and therapeutic targets. Mol. Neurobiol. 2021;58:2183–2201. - PubMed

Publication types