. 2024 Jan;21(1):50-59.
doi: 10.1038/s41592-023-01994-w. Epub 2023 Sep 21.

Deep generative modeling of transcriptional dynamics for RNA velocity analysis in single cells

Affiliations

Deep generative modeling of transcriptional dynamics for RNA velocity analysis in single cells

Adam Gayoso et al. Nat Methods. 2024 Jan.

Abstract

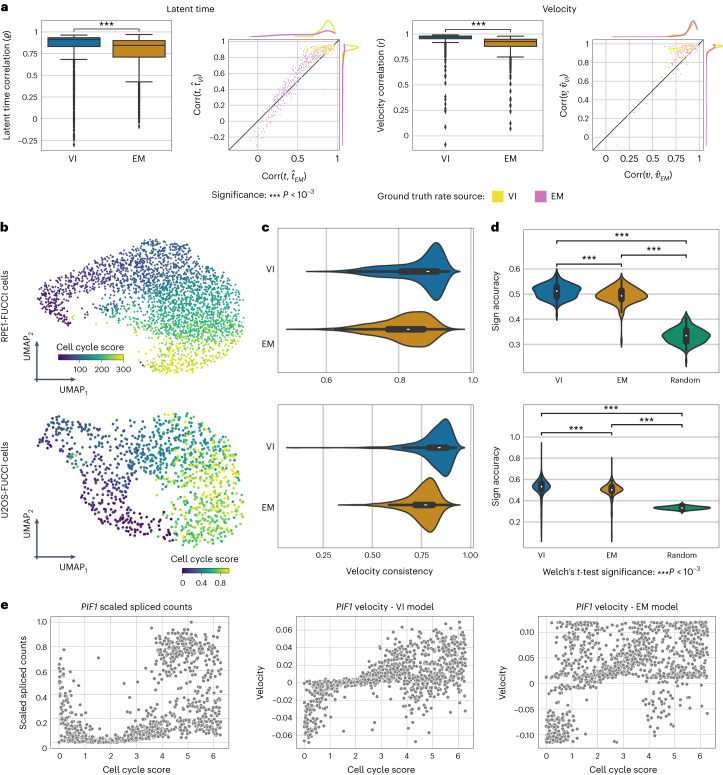
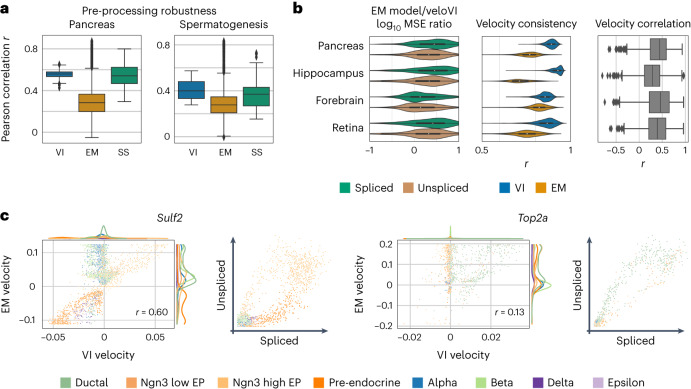
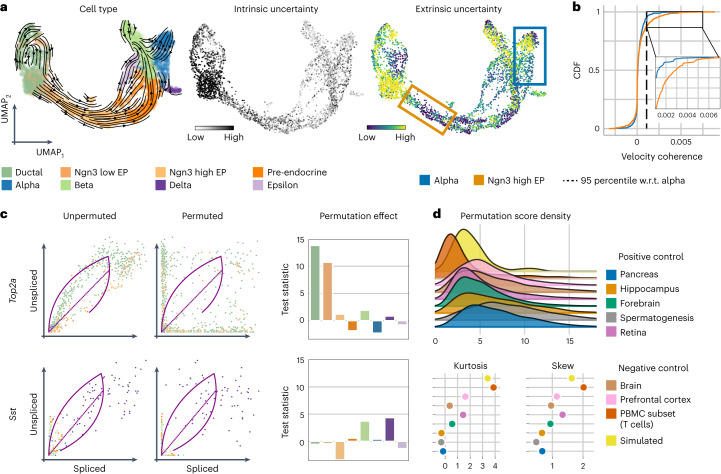
RNA velocity has been rapidly adopted to guide interpretation of transcriptional dynamics in snapshot single-cell data; however, current approaches for estimating RNA velocity lack effective strategies for quantifying uncertainty and determining the overall applicability to the system of interest. Here, we present veloVI (velocity variational inference), a deep generative modeling framework for estimating RNA velocity. veloVI learns a gene-specific dynamical model of RNA metabolism and provides a transcriptome-wide quantification of velocity uncertainty. We show that veloVI compares favorably to previous approaches with respect to goodness of fit, consistency across transcriptionally similar cells and stability across preprocessing pipelines for quantifying RNA abundance. Further, we demonstrate that veloVI's posterior velocity uncertainty can be used to assess whether velocity analysis is appropriate for a given dataset. Finally, we highlight veloVI as a flexible framework for modeling transcriptional dynamics by adapting the underlying dynamical model to use time-dependent transcription rates.


Conflict of interest statement

M.L. consults for Santa Ana Bio, is a part-time employee at Relation Therapeutics and owns interests in Relation Therapeutics. F.J.T. consults for Immunai, Singularity Bio, CytoReason and Omniscope and has ownership interest in Dermagnostix and Cellarity. N.Y. is an advisor and/or has equity in Cellarity, Celsius Therapeutics and Rheos Medicine. The remaining authors declare no competing interests.

Figures

Fig. 1
Fig. 1. Overview of the veloVI model.
a, veloVI encodes the unspliced and spliced abundances into the cell representation through a neural network. This cell representation is used to further encode the transcriptional state assignment of each cell/gene. Using the cell representation as input, the decoder neural network outputs a cell-gene-state specific latent time. The likelihood is a function of the latent time, kinetic rates (rates of transcription (α), splicing (β) and degradation (γ)) and uncertainty over the state assignment. The model is optimized end-to-end using stochastic variational inference techniques. b, The variational inference formulation quantifies the intrinsic uncertainty of a velocity estimate by sampling from the posterior distribution and measuring variability around the mean velocity vector. This notion is contrasted by its extrinsic counterpart, which quantifies variation of velocity extrapolated cell states within a cell’s neighborhood defined by transcriptomic similarity. KNN, k-nearest neighbor.
Fig. 2
Fig. 2. Benchmarking of velocity and latent time recovery.
a, Accuracy of VI and EM models on recovering ground truth latent time and velocity. For each quantity, we provide results in the form of box plots (n = 1,074 genes) and scatter plots (VI model y axis, EM model x axis). Rate parameters were estimated by each model on the pancreas dataset. Following this, a subset of these parameters was used to simulate new data, which each model was fitted to. In these plots, each point corresponds to a gene, where the value is the correlation between the estimated time/velocity versus the ground truth. The color coding in the scatter plots indicates whether the simulated rate parameters were derived from the original EM or VI model fit. Box plots indicate the median (center line), interquartile range (hinges) and whiskers at 1.5× interquartile range. b, UMAP colored with FUCCI-derived cell-cycle score for the RPE1- (top) and U2OS-FUCCI cells (bottom). c, Comparison of the velocity consistency from veloVI (blue) and the EM model (orange). The cell-wise velocity consistency in case of RPE1-FUCCI cells is shown on top, their U2OS counterparts on the bottom (n = 2,793 cells, top; n = 1,146 cells, bottom). Box plots indicate the median (center line) and interquartile range (hinges). d, Comparison of veloVI’s and the EM model’s estimated velocities. The violin plots show the log-transformed ratio of each method’s velocity sign accuracy, which were computed per gene. Box plots indicate the median (center line) and interquartile range (hinges) (n = 140 genes, top; n = 395 genes, bottom). Significance was assessed with a one-sided Welch’s t-test (P < 0.001). e, Spliced abundance of PIF1 versus cell cycle score for each cell in the U2OS-FUCCI dataset (left). Estimated velocity in PIF1 using the VI (middle) and EM model (right) plotted against the cell-cycle score.
Fig. 3
Fig. 3. Velocity model comparison in complex biological systems.
a, Comparison of velocity estimation when using different algorithms to quantify unspliced and spliced counts. Correlation of velocities derived from pairs of quantification algorithms and from velocities estimating using one of veloVI (VI), the EM and steady-state (SS) model are compared on the pancreas and spermatogenesis data. Box plots indicate the median (center line), interquartile range (hinges) and whiskers at 1.5× interquartile range (n = 78 pairs of quantification methods each). b, Comparison of veloVI and the EM model based on gene-wise MSE (left), cell-wise velocity consistency (middle) and gene-wise velocity Pearson correlation (right) on datasets of pancreas endocrinogenesis (n = 1,074 genes for MSE and velocity correlation; n = 3,696 cells for velocity consistency), hippocampus (n = 1,292 genes for MSE and velocity correlation; n = 18,213 for velocity consistency), forebrain (n = 822 genes for MSE and velocity correlation; n = 1,720 for velocity consistency) and retina (n = 700 genes for MSE and velocity correlation; n = 2,726 for velocity consistency). Box plots indicate the median (center line), interquartile range (hinges) and whiskers at 1.5× interquartile range. c, Velocity comparison on the level of individual genes in the pancreas dataset (Sulf2 and Top2a). For each gene, the velocity of the EM model is plotted against veloVI (left) and the gene phase portrait is given (right). Each observation is colored by its cell type as defined in previous work.
Fig. 4
Fig. 4. Velocity uncertainty and permutation score analysis.
a, From left to right: velocity stream, intrinsic and extrinsic uncertainty of the pancreas dataset estimated by veloVI. The left UMAP embedding is colored by cell type according to original cluster annotations,. Uncertainty is defined as the variance of the cosine similarity between samples of the velocity vector (intrinsic) and future cell states (extrinsic) and their respective mean (Methods). b, The corresponding cumulative distribution functions (CDFs) of the gene velocity coherence score is shown for alpha and Ngn3-high EP cells. The velocity coherence, defined for one cell and gene as the product of the velocity and the expected displacement of that cell/gene, is averaged within cell types. w.r.t., with regard to. c, The effect on the error between inferred dynamics and data when permuting unspliced and spliced abundance in the case of Top2a (top) and Sst (bottom). Coloring of cell types is according to a. d, Permutation score densities of datasets of the pancreas, hippocampus, forebrain, spermatogenesis, retina, brain, prefrontal cortex, PBMCs and simulated data (top). Kurtosis (left) and skew (right) for each dataset (bottom).
Fig. 5
Fig. 5. Extension to modeling time-dependent transcription rates.
a, Time-dependent transcription rate for different sets of parameter values. b, Log10 MSE ratio of models with constant and time-dependent transcription rate in the case of the pancreas (n = 1,074 genes), dentate gyrus (n = 1,292 genes), forebrain (n = 822 genes) and retina (n = 700 genes). Box plots indicate the median (center line) and interquartile range (hinges). c, Gene phase portrait with inferred dynamics with a constant (solid line) or time-dependent transcription rate (dashed line) (top). Corresponding time-dependent transcription rates are shown in terms of the inferred latent time (bottom).
Extended Data Fig. 1
Extended Data Fig. 1. Low-rank structure of latent time.
PCA variance ratio of gene-cell specific latent time as inferred by the EM model.
Extended Data Fig. 2
Extended Data Fig. 2. Preprocessing stability of inference methods.
Correlation of velocities derived from pairs of quantification algorithms and from velocities estimating using one of veloVI (VI), the EM (EM), and steady-state model (SS) on datasets of prefrontal cortex (PFC) (left, N=78 pairs of quantification methods), 21-22 months old mouse brains (middle, N=78 pairs of quantification methods), and hippocampus (right, N=55 pairs of quantification methods). Unspliced and spliced counts are quantified with different algorithms,. Velocities are estimated by veloVI (VI, blue), the EM model (EM, orange), and the steady-state model (SS, green). Box plots indicate the median (center line), interquartile range (hinges), and whiskers at 1.5x interquartile range.
Extended Data Fig. 3
Extended Data Fig. 3. Phase portraits in pancreas endocrinogenesis.
Phase portraits of Rbfox3, Sulf2, Igfbpl1, and Cbfa2t3. Each cell is colored by its cell type.
Extended Data Fig. 4
Extended Data Fig. 4. Effect of data perturbation on uncertainty.
a. The effect of downsampling (0%, 25%, 50%, 75%) counts on phase portraits of Sulf2 (left) colored by cell type, intrinsic uncertainty per cell (middle, N=3696 cells), and extrinsic uncertainty per cell (right, N=3696 cells). b. The effect of unobserved unspliced reads (dropout probability 0.0, 0.5, 0.9, 0.98) in 400 and 800 genes on phase portraits of Fam135a (left), intrinsic uncertainty per cell (middle, N=3696 cells), and extrinsic uncertainty per cell (right, N=3696 cells). c. The effect of multiplicative noise (scale 0.1, 0.5, 1.0, 1.5) on phase portraits of Sulf2 (left), intrinsic uncertainty per cell (middle, N=3696 cells), and extrinsic uncertainty per cell (right, N=3696 cells). Box plots indicate the median (center line), and interquartile range (hinges).
Extended Data Fig. 5
Extended Data Fig. 5. Gene analysis based on extrinsic uncertainty.
a. UMAP embedding of the Pancreas dataset colored by extrinsic uncertainty (left); The velocity coherence score across all genes for Alpha and Ngn3-high cells (right). b, c. Genes with the lowest/highest velocity coherence in Alpha cells, respectively. c, d. Genes with the lowest/highest velocity coherence in Ngn3-high cells, respectively. e, Genes fit with incorrect dynamics in Ngn3-high cells.
Extended Data Fig. 6
Extended Data Fig. 6. Overview of permutation score construction.
a. First, the cells of one cell type are selected. These are shuffled independently for each genes (and independently in each of unspliced and spliced matrices). This is repeated for each cell type and the data are concatenated. This new permuted dataset is fed into a pre-trained veloVI model (trained on the same original dataset). The fit of unspliced and spliced abundance is obtained for each new perturbed cell. Following this, for each gene, the mean absolute error (spliced and unspliced) is computed per cell type. The original and perturbed mean absolute errors are compared with the T-test statistic. This provides a permutation effect statistic for each gene and each cell type. To obtain the permutation score, a scalar score for each gene, we take the maximum permutation effect statistic across cell types.
Extended Data Fig. 7
Extended Data Fig. 7. Permutation score analysis of old mouse brain.
a. Density of permutation score per cell type: arachnoid barrier cells (ABC), astrocyte-restricted precursors (ARP), astrocytes (ASC), choroid plexus epithelial cells (CPC), dendritic cells (DC), endothelial cells (EC), ependymocytes (EPC), hemoglobin-expressing vascular cells (Hb-VC), macrophages (MAC), microglia (MG), monocytes (MNC), neural stem cells (NSC), neuroendocrine cells (NendC), olfactory ensheathing glia (OEG), oligodendrocytes (OLG), oligodendrocyte precursor cells (OPC), pericytes (PC), vascular and leptomeningeal cells (VLMC), vascular smooth muscle cells (VSMC), mature neurons (mNEUR) (N=2000 genes each). b. Percentage of cell types scoring assigned the highest permutation socre for a given gene. c. Genes assigned the highest permutation score. d, UMAP embedding of dataset colored by whether cells are mature neurons (mNEUR). e, Permutation score densities (left), and their kurtosis and skew when using the full dataset (brown) compared to excluding mature neurons.

Similar articles

Cited by

References

    1. Wagner, A., Regev, A. & Yosef, N. Revealing the vectors of cellular identity with single-cell genomics. Nat. Biotechnol.10.1038/nbt.3711 (2016). - PMC - PubMed
    1. Buenrostro JD, et al. Integrated single-cell analysis maps the continuous regulatory landscape of human hematopoietic differentiation. Cell. 2018;173:1535–1548. doi: 10.1016/j.cell.2018.03.074. - DOI - PMC - PubMed
    1. Tanay, A. & Regev, A. Scaling single-cell genomics from phenomenology to mechanism. Nature10.1038/nature21350 (2017). - PMC - PubMed
    1. Haghverdi L, Büttner M, Wolf FA, Buettner F, Theis FJ. Diffusion pseudotime robustly reconstructs lineage branching. Nat. Methods. 2016;13:845–848. doi: 10.1038/nmeth.3971. - DOI - PubMed
    1. Setty M, et al. Characterization of cell fate probabilities in single-cell data with palantir. Nat. Biotechnol. 2019;37:451–460. doi: 10.1038/s41587-019-0068-4. - DOI - PMC - PubMed