. 2023 Oct;20(10):1544-1552.
doi: 10.1038/s41592-023-01986-w. Epub 2023 Sep 21.

Spatiotemporal, optogenetic control of gene expression in organoids

Affiliations

Spatiotemporal, optogenetic control of gene expression in organoids

Ivano Legnini et al. Nat Methods. 2023 Oct.

Abstract

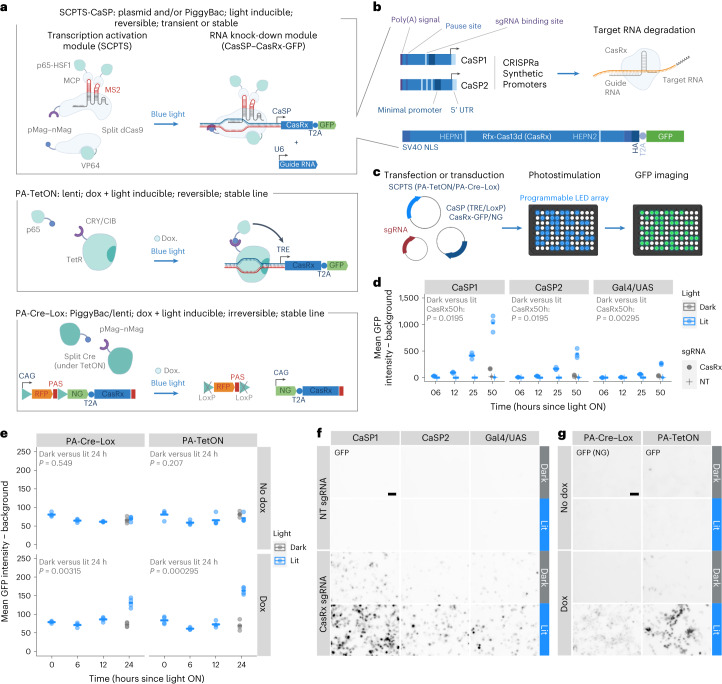
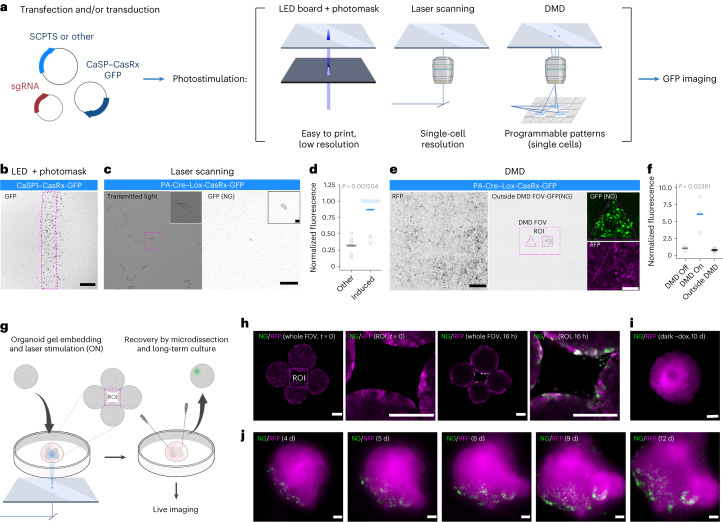
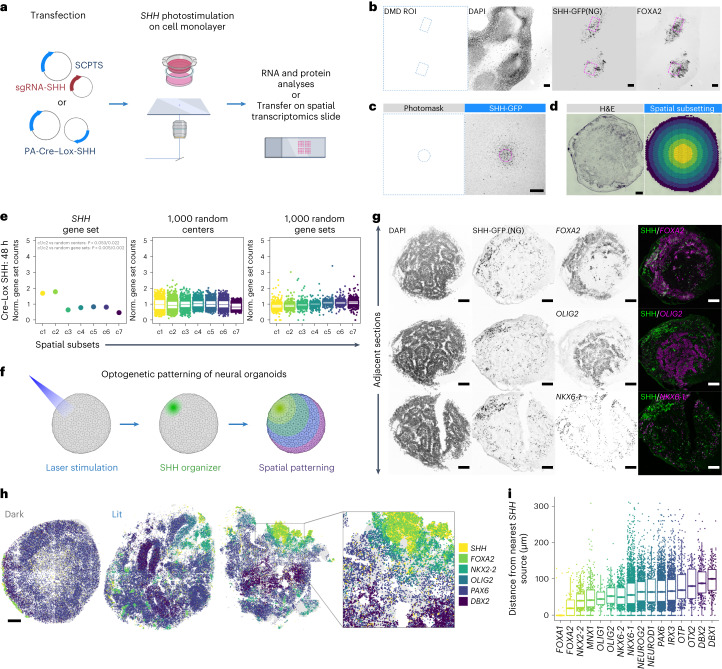
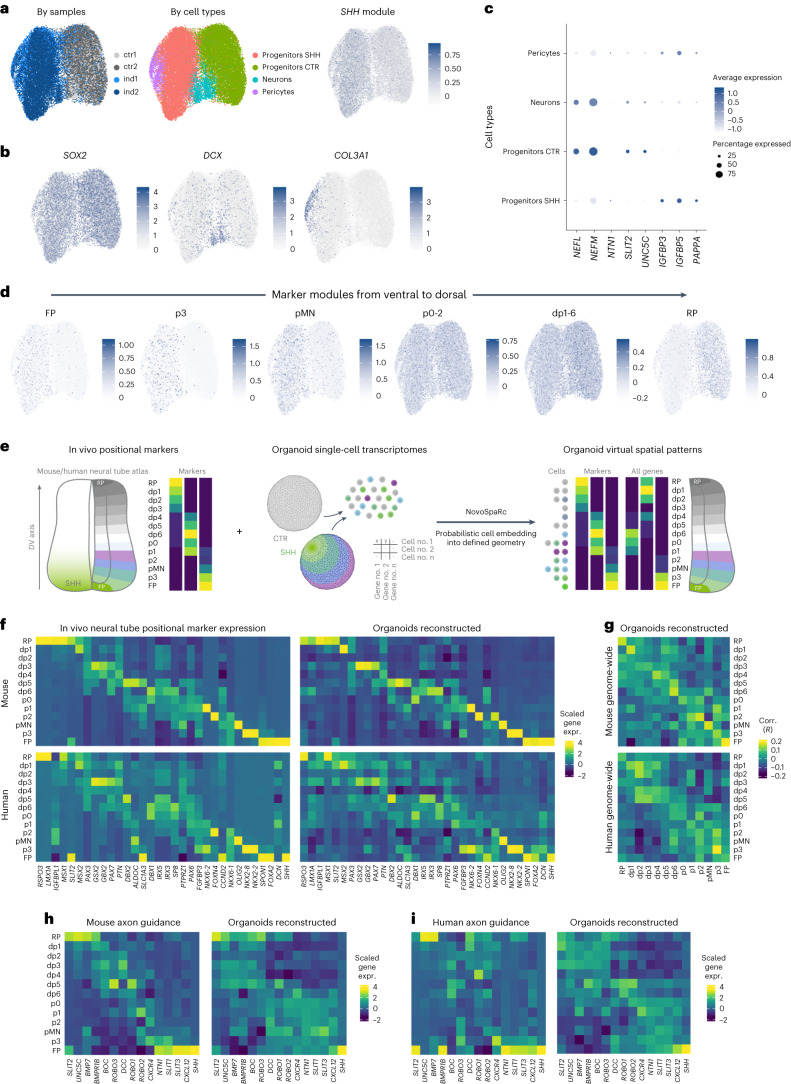
Organoids derived from stem cells have become an increasingly important tool for studying human development and modeling disease. However, methods are still needed to control and study spatiotemporal patterns of gene expression in organoids. Here we combined optogenetics and gene perturbation technologies to activate or knock-down RNA of target genes in programmable spatiotemporal patterns. To illustrate the usefulness of our approach, we locally activated Sonic Hedgehog (SHH) signaling in an organoid model for human neurodevelopment. Spatial and single-cell transcriptomic analyses showed that this local induction was sufficient to generate stereotypically patterned organoids and revealed new insights into SHH's contribution to gene regulation in neurodevelopment. With this study, we propose optogenetic perturbations in combination with spatial transcriptomics as a powerful technology to reprogram and study cell fates and tissue patterning in organoids.


Conflict of interest statement

The authors declare no competing interests.

Figures

Fig. 1
Fig. 1. Light-inducible gene activation and knock-down modules.
a, The top shows the light-inducible transcription activation module (SCPTS), based on a dCas9 fused to transcription activation domains, driving CasRx transcription in this case. A U6 promoter-driven CasRx guide RNA can be co-expressed. The middle shows PA-TetON system. The bottom shows PA-Cre–Lox. b, Synthetic promoters for light-inducible transcription of CasRx or any other cassette of interest (CaSP1/2), containing upstream elements for reducing spurious transcription (poly(A) site, pause site), a minimal CMV promoter containing TFIIB binding site/TATA box, an initiator and synthetic 5′ untranslated region (UTR), one or three sgRNA binding sites. The CasRx cassette (below) contains a T2A-GFP tag, two nuclear localization signals (NLS) and an HA tag, as in ref. . Catalytic domains (HEPN) are indicated. c, Experimental setup: HEK293T cells are transfected in a 96-well plate, which is placed on a LED board for photostimulation and cells are then imaged for GFP/NeonGreen (NG). d, For the SCPTS system, background-subtracted mean GFP intensity at indicated time points (dark or lit), with one of the three promoters (CaSP1/2, Gal4/UAS), either a nontargeting (NT) or the CaSP–CasRx-targeting guide (CasRx). Horizontal bars show the mean of all replicates per condition; dots show individual replicates. P values (Benjamini–Hochberg corrected two-sided t-test) between dark and lit conditions at 50 h are reported. e, Same as d, for the PA-TetOn and PA-Cre–Lox systems, with or without doxycycline (n = 4). P value (Benjamini–Hochberg corrected two-sided t-test) between dark and lit conditions at 24 h are reported. f,g, Representative images for the SCPTS (GFP) (f), PA-Cre–Lox (NG) and PA-TetON (GFP) (g). Scale bars, 50 μm. Images were taken at 36 h posttransfection using a Keyence BZ-X710 with ×10 magnification, in n = 6 independent experiments from those in d,e. Brightfield in Extended Data Fig. 1k. Source data
Fig. 2
Fig. 2. Spatial programming of optogenetic stimulations.
a, Spatial photostimulations: cells are stimulated with a LED array through a photomask, with laser scanning or with a DMD. b, Representative images (n = 3) of LED stimulation of the CaSP1–CasRx system in HEK cells (NG). Magenta, photomask. Scale bar, 500 μm. c, Single-cell Cre–Lox CasRx laser stimulation in HEK cells. The left shows the transmitted light. The right shows the NG. Scale bars, 100 μm. Top right shows a higher magnification. Magenta, photostimulated ROI. d, NG quantification for an ROI covering the photostimulated cell (blue, induced) and for the mean of ROI of the same size tiling the entire FOV 16–18 h after stimulation (gray, other). Each dot is a replicate (n = 9 induced cells in five different experiments), horizontal bars represent the mean and P value for induced versus other comparison is shown (two-sided Wilcoxon–Mann–Whitney). e, Representative image of a complex pattern stimulation of the Cre–Lox CasRx system in HEK cells performed with the DMD setup. The left shows the RFP, the middle shows the NG and the right shows a zoom-in of an individual ROI. Photostimulated ROI and entire DMD FOV (rectangle outside) in magenta. The broader FOV (outside DMD) was imaged 24 h post-photostimulation with a confocal setup. Scale bars, 500 μm. f, Quantification of NG for the DMD ROI (DMD On), the DMD FOV outside the photostimulated ROI (DMD Off) and the imaged region outside the DMD FOV (Outside DMD). Each dot is a replicate (n = 3), horizontal bars represent the mean and P value for the DMD On versus both DMD Off and Outside DMD is shown (two-sided Wilcoxon–Mann–Whitney). g, Organoid photostimulation protocol: four organoids are placed on a glass-bottom dish, immobilized with a Geltrex droplet and photostimulated with laser scanning overnight. h, From left to right: representative (n = 7) live imaging (whole FOV and photostimulated ROI) of four organoids at time 0 and after 16 h of pulsed photostimulation. Magenta, RFP; green, NG. Scale bars, 100 μm. i, Live imaging of a representative control organoid (dark) at 10 days. Scale bar, 250 μm. Magenta, RFP; green, NG. j, Live imaging of a representative time course (4–12 days, n = 3) of an organoid locally photostimulated via laser scanning. Magenta, RFP; green, NG. Scale bars, 100 μm. Source data
Fig. 3
Fig. 3. Optogenetic stimulation of SHH in human stem cells and organoids.
a, Optogenetic stimulation of SHH coupled with spatial readouts. b, Representative (n = 3) imaging of DAPI, SHH-expressing cells (NG) and FOXA2 (immunofluorescence) in hiPSCs 6 days poststimulation. SHH was induced in two ROI (left and in magenta) with a DMD. Scale bars, 100 μm. c, Representative (n = 3) image of hiPSCs Cre–Lox SHH cultured on a PET membrane, stimulated through a 500 μm-wide circular photomask (left). The right shows NG. Scale bar, 500 μm. d, The left shows representative (n = 4) hematoxylin and eosin (H&E) staining of a hiPSC layer cultured on a membrane and transferred onto a Visium slide. The right shows spatial subsetting of Visium spots into seven concentric circles, centered on the SHH-induced area. Scale bar, 500 μm. e, The left shows normalized (Norm.) counts of an SHH gene set in the seven concentric circles (c1–7), color coded as in d, in hiPSCs stimulated for 48 h (n = 1; other samples in Extended Data Fig. 3). The middle shows the same as the left, sampling 1,000 times a random spot as center. The right is the same as the left, sampling 1,000 times a random gene set. Exact P < 0.05 are indicated, computed as the fraction of values exceeding the tested value from random sampling of 1,000 centers and 1,000 gene sets. f. Optogenetic patterning of neural organoids. g, Representative (n = 5) imaging of DAPI, SHH-expressing cells marked by NG and FOXA2/OLIG2/NKX6-1 in adjacent cryo-sections of neural organoids with laser induction of SHH in the north-west pole. The signal is in gray scale for each target separately, and merged in green and magenta (right). Scale bars, 100 μm. The experiment was performed four times and the representative images are shown here. h, Molecular Cartography spatial transcriptomic data of control (left, dark) and SHH-induced (right, lit) organoids, with the indicated transcripts colored according to the legend (right). Experiment was performed four times per condition and three examples are shown here (one dark and two lit). Scale bar, 100 μm. i, Distance distribution (μm) of cells expressing the indicated transcripts from the nearest SHH+ cell, in the most left induced organoid of h. In all boxplots, the center and bounds represent the median, 25 and 75% quantiles. Whiskers, if present, represent 1.5× interquartile ranges.
Fig. 4
Fig. 4. Molecular effects of SHH and spatial gene expression patterns in neural organoids.
a, Sample identity (left), annotated cell types (middle) and SHH module score (right) from two replicates of control and SHH-induced organoids scRNA-seq data (UMAP). b, Featureplot of log-normalized expression of markers for main cell types. c, Heatmap of log-normalized and scaled expression for selected examples of differentially expressed genes. d, Featureplot of module scores for marker genes of ventral (floor plate, FP) to dorsal (roof plate, RP) domains of gene expression of the mouse developing caudal neural tube. e, NovoSpaRc reconstruction of DV identities in organoids single-cell transcriptomic data. The left shows a set of positional marker genes is selected from neural tube sRNA-seq data. The middle shows that control and SHH-induced organoids single-cell transcriptomes are merged, and the right shows cells are probabilistically embedded into a DV geometry and genome-wide gene expression is reconstructed. f, The left shows the scaled gene expression of positional marker genes in mouse (top) and human (bottom) scRNA-seq data. The right shows the same in organoid reconstruction based on mouse (top) or human (bottom) expression data. g, Correlation matrix for mouse (top) and human (bottom) versus organoid reconstructed DV gene expression domains, computed on 1,000 highly variable genes subsequently filtered for expression in each dataset. h, Scaled (z-score) expression of a set of genes involved in axon guidance in progenitor cells of the mouse developing spinal cord and in the organoids spatial reconstruction. i, As h, for the reconstruction based on human scRNA-seq data.
Extended Data Fig. 1
Extended Data Fig. 1. Light-inducible gene activation and knock-down modules.
a. Log2 fold-change of the ASCL1 mRNA, induced with the CPTS (left) and SCPTS (right) systems, between a non-targeting (NT) and promoter-targeting sgRNA (ASCL1), in dark or lit conditions at 24h, measured by RT-qPCR. Each dot represents a biological replicate (n = 2). b. Histograms of pixel intensity with and without background correction (green and red), performed with the subtract background function in Fiji/imageJ with a rolling ball radius of 50, for three representative samples of the SCPTS CaSP2 CasRx system (left: 6h time point with non-targeting guide, middle: 50h time point with the Tet6 targeting guide in the dark, right: 50h time point with the Tet6 targeting guide with illumination). c. Background-subtracted mean GFP intensity, in either dark or lit conditions (n = 4) for constitutive CasRx. P-values (Benjamini-Hochberg corrected two-sided t test) between dark and lit conditions at 50h are shown. d-e. As in Fig. 1d, e, for an additional time point at 96h (n = 3, except for NT guide control n = 1). Each dot represents a replicate (n = 3, except for NT guide n = 1) and horizontal lines represent means over each condition. P-values (Benjamini-Hochberg corrected two-sided t test) between dark and lit condition for CasRx guide and dox/no dox conditions are shown. f. Brighfield images corresponding to the panels in Fig. 1f, g. Scale bar (top left panel, applies to all): 50 μm. Horizontal lines represent the mean of all replicates in each plot. Source data
Extended Data Fig. 2
Extended Data Fig. 2. Spatial programming of gene expression.
a. As in Fig. 2b, representative (n = 3) fluorescent microscope image of a photomask stimulation for the PA-TetON (top) and PA-Cre/Lox (bottom) CasRx systems in HEK cells. Magenta: photomask shape. Signal is NG in gray scale. Scale bar: 500 μm. b. As in Fig. 2c, representative (n = 9 single cells from 5 different experiments) images of a single-cell Cre/Lox CasRx stimulation in HEK cells, performed with 100 Hz laser scanning within a confocal microscope setup. Top: confocal image of GFP in grey scale, bottom: transmitted light image. Scale bar: 100 μm. The three FOVs are larger than in Fig. 2c and represent three typical scenarios observed in single-cell photo-stimulations. Left: a single cell is successfully induced; middle: bystander cells are induced as well (moving through the illuminated FOV or deriving by cell division); right: additional cells elsewhere in the FOV are also induced (‘leakage’). c. NG fluorescence quantification for all replicates of single-cell stimulations. A grid of ROIs of ca. the size of a single cell spanning the entire FOV is used for quantifying the signal of the photo-stimulated cell (left ROI, in blue), and of all other ROIs in the FOV (grey), sorted by their distance in micrometers from the photo-stimulated ROI. Signal is normalized (0 to 1) and each replicate is summed with an arbitrary integer to show them stacked (n = 9 FOVs photo-stimulated in 5 experiments). P-value: two-sided t-test. d. Representative (n = 3) live imaging of an organoid treated with 1 μg/ml doxycycline for 24 h and kept in the dark (top) or photo-stimulated with a LED lamp for 24 h (bottom), at 10 days post-stimulation. Magenta: RFP; Green: NeonGreen. Scale bar: 250 μm. e. Live imaging of a time-course as in Fig. 2j for two more organoids locally photo-stimulated via laser scanning (n = 3). Magenta: RFP; Green: NeonGreen. Scale bar: 100 μm.
Extended Data Fig. 3
Extended Data Fig. 3. Optogenetic stimulation of Sonic Hedgehog in human stem cells.
a. UCSC genome browser window of human SHH locus with transcription and H3K4Me3 tracks from ENCODE and three sgRNAs used for SCPTS. b. SHH mRNA (RT-qPCR) in HEK293T cells transfected with the SCPTS system without or with one of the three SHH promoter-targeting sgRNAs, dark vs 24h lit. Values are fold change over no-guide dark control, normalized on GAPDH. Dots represent each biological replicate (n = 2) and horizontal bars the mean of all replicates. c, d. As a-b, for BMP4. e. RT-qPCR measurement of the mRNAs indicated on top in hiPSCs induced for SHH expression with the SCPTS loaded with the SHH guide 1 or the Cre/Lox system, with or without light stimulation, for 24–72h. Data represent fold change over 24h dark control. Dots represent each biological replicate (n = 2–5) and horizontal bars the mean over each condition. Benjamini-Hochberg corrected two-sided t test p-values are computed between dark and lit. f. As in e, but with stem cell media instead of neural induction media. g. SHH mRNA (RT-qPCR) using the SCPTS system and SHH guide 1 (right) or the Cre/Lox system (left), dark vs lit, for 24–72h. Data are the same as in e-f, but plotted as fold-change over the SCPTS dark 24h control for both series (SCPTS and Cre/Lox), to compare the two. h. Representative H&E staining on n = 3 replicates of hiPSCs cultured on a PET membrane and transferred onto a glass slide. i. Brightfield (left) and RFP (right) channels for hiPSCs Cre/Lox SHH cultured as a monolayer on a PET membrane, induced in the center with a circular photomask (Fig. 3c, n = 1 per time point). Scale bar: 500 μm. j. UMI counts for the Visium capture areas in the 4 hiPSC Cre/Lox SHH samples at 0,36,48 and 120h of induction. k. Left: normalized counts of a SHH gene set, obtained by adding the counts of each gene in the set in each of the 7 concentric circles (c1-7), normalized by the total transcript counts per circle. Middle left: same sampling 1000 times a random central spot. Middle right: same sampling 1000 times a random gene set on the same concentric circles of the left panel. Right: heatmap showing transcript counts per million (cpm) for all genes in the SHH gene set across the 7 concentric circles. Data shown here for hiPSCs Cre/Lox SHH induced for 0, 36 and 120h, while 48h is shown in Fig. 4e (n = 1 per time point for 4 time points). Exact p-values < 0.05 are indicated, computed as the fraction of values exceeding the tested value from random sampling of 1000 centers and 1000 gene sets. l. Heatmap showing transcript counts per million (cpm) for the individual genes in the the SHH pathway across the 7 concentric circles (c1-7) and the 4 samples (induction of 0h, 36h, 48h and 120h). m. Same as k, for additional genes involved in the SHH pathway. n. Same as k, for a gene set comprised of target genes of the heat shock transcription factor HSF1. All boxplots: center and bounds represent median, 25% and 75% quantiles. Source data
Extended Data Fig. 4
Extended Data Fig. 4. Optogenetic stimulation of Sonic Hedgehog in human organoids.
a. Schematic representation of neural organoids protocol. b. Representative (n = 3) DAPI, SHH-NeonGreen and FOXA2 (immunofluorescence) in whole-mount organoids without and with localized laser induction. Signal is shown separately in grey scale for each target and merge for SHH and FOXA2 in green and magenta (right). Scale bar: 100 μm and 500 μm for non-induced and induced organoids respectively. c. RT-qPCR measurement of SHH mRNA levels in PA-Cre/Lox-SHH organoids derived from two hiPSC lines (left and right). Relative expression of SHH over ACTB is shown for dark and lit conditions (grey and blue) at different times. Each dot represents a biological replicate (pool of 3–6 organoids, n = 3), horizontal bars indicate their mean. Benjamini-Hochberg corrected two-sided t test p-values shown on top. d. Representative (n = 3) DAPI, SHH-NeonGreen, FOXA2, OLIG2 and NKX6-1 immunofluorescence in cryosectioned organoids from hiPSC line 2, without induction (top) and laser induction (bottom three rows). Signal is shown separately in grey scale for each target and merged in blue, green and magenta (right). Scale bar: 100 μm. e. RT-qPCR measurement of the SHH mRNA levels in a stable SCPTS-SHH hiPSC line. Relative expression of SHH over ACTB is shown for dark and lit conditions at 48h post- stimulation. Each dot represent a biological replicate (pool of 3–6 organoids, n = 8 dark, 9 lit), horizontal bars indicate their mean. P-value (two-sided t test) shown on top. f. Representative (n = 2) SHH mRNA in situ hybridization for non-induced and SHH locally induced (arrow) organoids at 48h post-stimulation. Scale bar: 500 μm. g. Representative (n = 3) Immunofluorescence of DAPI, FOXA2 and OLIG2 in cryosectioned organoids from the SCPTS hiPSC line, without (top) and with laser induction of SHH in a pole (bottom). Signal is shown separately in grey scale for each target and merged in blue, yellow and magenta (right). Scale bar: 100 μm. h. BMP4 (left) and MSX1 (right) mRNA RT-qPCR measurement, normalized on ACTB, in neural organoids derived from a PA-Cre/Lox-BMP4 hiPSC line, dark vs lit at 4 days post-photostimulation. Each dot represent a biological replicate (pool of 3–6 organoids, n = 4), horizontal bars indicate their mean. Benjamini-Hochberg corrected two-sided t test p-values are shown on top. Source data
Extended Data Fig. 5
Extended Data Fig. 5. Spatial transcriptomic analysis of control and SHH-induced organoids.
a. Heatmap of log-normalized transcript expression for a panel of transcripts of interest involved in the SHH pathway, quantified by Molecular Cartography spatial transcriptomics, for 8 organoids (4 controls and 4 SHH-induced as indicated on top). b. Molecular Cartography signal of selected transcripts of interest overlaid on a grey mask of a representative cryosection for each organoid (4 controls/dark and 4 SHH-induced/lit). c. Molecular Cartography signal of more selected transcripts of interest overlaid on a grey mask of a representative SHH-induced organoid cryosection. d. UMAP plot of log-normalized and scaled expression of the same transcripts as in e. for all detected cells in the 8 organoids. Lower right: organoids condition (control and SHH-induced in grey and green).
Extended Data Fig. 6
Extended Data Fig. 6. Single-cell analysis of control and SHH-induced organoids.
a. UMAP representation of all sequenced cells with > 800 UMIs and < 5% mtRNA, before filtering out two low-quality clusters (5 and 7). Left: samples of origin (controls in grey, induced in blue); right: identified clusters. b. Distribution of transcripts and gene counts and mtRNA % by clusters and samples. c. Cell number by cell type and sample. d. Heatmap of top 20 marker genes expression for all clusters.
Extended Data Fig. 7
Extended Data Fig. 7. Single-cell analysis and validations of control and SHH-induced organoids.
a. Alluvial plot showing the relative composition of the progenitor cells clusters in control (grey) and SHH-induced organoids (blue), before and after data integration (see Methods). b. Sample identity (left), annotated cell types (middle) and SHH module score (right) from 2 replicates of control and SHH-induced organoids scRNA-seq data (UMAP). Same as Fig. 4a, but after data integration (see Methods). c. Dotplot showing % of cells expressing and log-normalized, scaled gene expression for known marker genes of pericytes. d. Representative (n = 3) immunofluorescence images for DAPI, NeonGreen (SHH tag) and PDGFRB (pericyte marker) in control and SHH-induced organoids at 12 days post-photo-stimulation. Experiment was performed in 4 replicates, 3 representative FOVs are shown. Scale bar: 10 μm. e. Representative (n = 3) immunofluorescence of DAPI, NeonGreen (SHH tag) and HB9, ISL1/2 and CHX10 in control (left) and SHH-induced organoids at 30 days post-photo-stimulation. Signal is shown separately in grey scale for each target and merged for SHH and the protein of interest in green and magenta (right). Scale bar: 100 μm.
Extended Data Fig. 8
Extended Data Fig. 8. Molecular effects of SHH and spatial gene expression patterns in neural organoids.
a. GSEA analysis on GO CC, MF and BP terms, and on KEGG pathways, performed on a rank list of differentially expressed genes between control and induced progenitors. P-values: Benjamini-Hochberg-corrected GSEA test. b. Dotplot of exemplary differentially expressed genes in CTR vs SHH organoids, for human neural tube scRNA-seq data. c. Heatmap of HOX genes and additional anterior-posterior markers showing that control and induced organoids have hindbrain/spinal cord identity, marked by expression peak between HOXB2 and HOXC4. d. Featureplot of log-normalized expression of a set of positional marker genes along the ventral (SHH)-dorsal(MSX1) axis. e. Assignment probabilities of progenitor cells from control and induced organoids to each of the 13 progenitor domains specified by positional markers of the mouse neural tube atlas. P-values (Benjamini-Hochberg-corrected Wilcoxon Mann Whitney) for the comparison between control and SHH-induced organoids are indicated on top for each DV domain. f. Correlation matrices for mouse, human and organoids reconstructed DV gene expression, computed on 1000 highly variable genes filtered for expression in each dataset. g. Left: DV scaled (z-score) expression of SIM1 from organoid reconstructed and mouse/human DV domains. Right: featureplot of log-normalized expression of SIM1 in organoids. h. Featureplot of module score for a gene module comprised of the heat shock transcription factor HSF1′s targets.

References

    1. Lancaster MA, et al. Cerebral organoids model human brain development and microcephaly. Nature. 2013;501:373–379. doi: 10.1038/nature12517. - DOI - PMC - PubMed
    1. Kelley KW, Pașca SP. Human brain organogenesis: toward a cellular understanding of development and disease. Cell. 2022;185:42–61. doi: 10.1016/j.cell.2021.10.003. - DOI - PubMed
    1. Nihongaki Y, et al. CRISPR-Cas9-based photoactivatable transcription systems to induce neuronal differentiation. Nat. Methods. 2017;14:963–966. doi: 10.1038/nmeth.4430. - DOI - PubMed
    1. Yamada M, Suzuki Y, Nagasaki SC, Okuno H, Imayoshi I. Light control of the Tet gene expression system in mammalian cells. Cell Rep. 2018;25:487–500.e6. doi: 10.1016/j.celrep.2018.09.026. - DOI - PubMed
    1. De Santis R, Etoc F, Rosado-Olivieri EA, Brivanlou AH. Self-organization of human dorsal-ventral forebrain structures by light induced SHH. Nat. Commun. 2021;12:6768. doi: 10.1038/s41467-021-26881-w. - DOI - PMC - PubMed

Substances