. 2023 Sep 21;14(1):5879.
doi: 10.1038/s41467-023-41636-5.

Structure guided mimicry of an essential P. falciparum receptor-ligand complex enhances cross neutralizing antibodies

Affiliations

Structure guided mimicry of an essential P. falciparum receptor-ligand complex enhances cross neutralizing antibodies

Sean Yanik et al. Nat Commun. .

Abstract

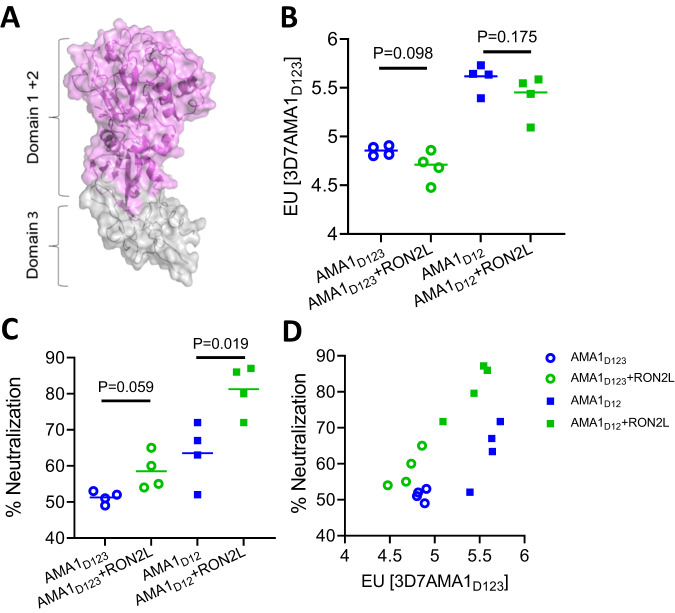
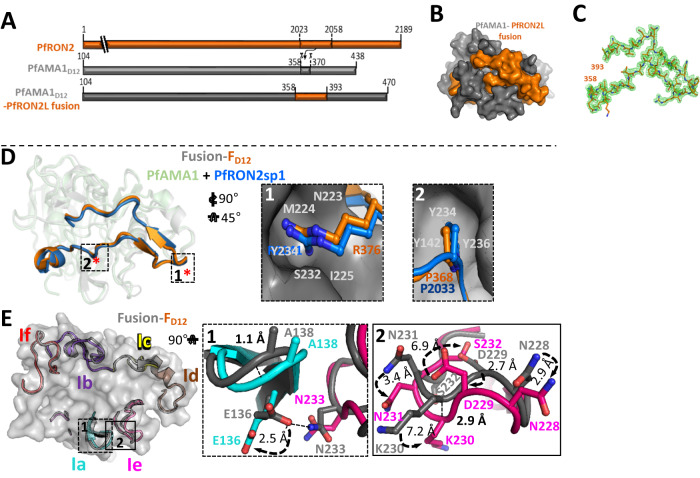
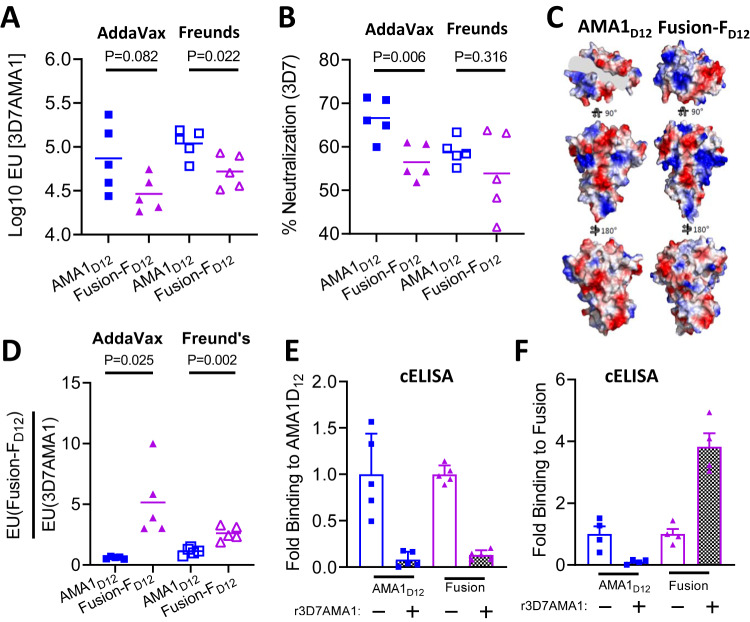
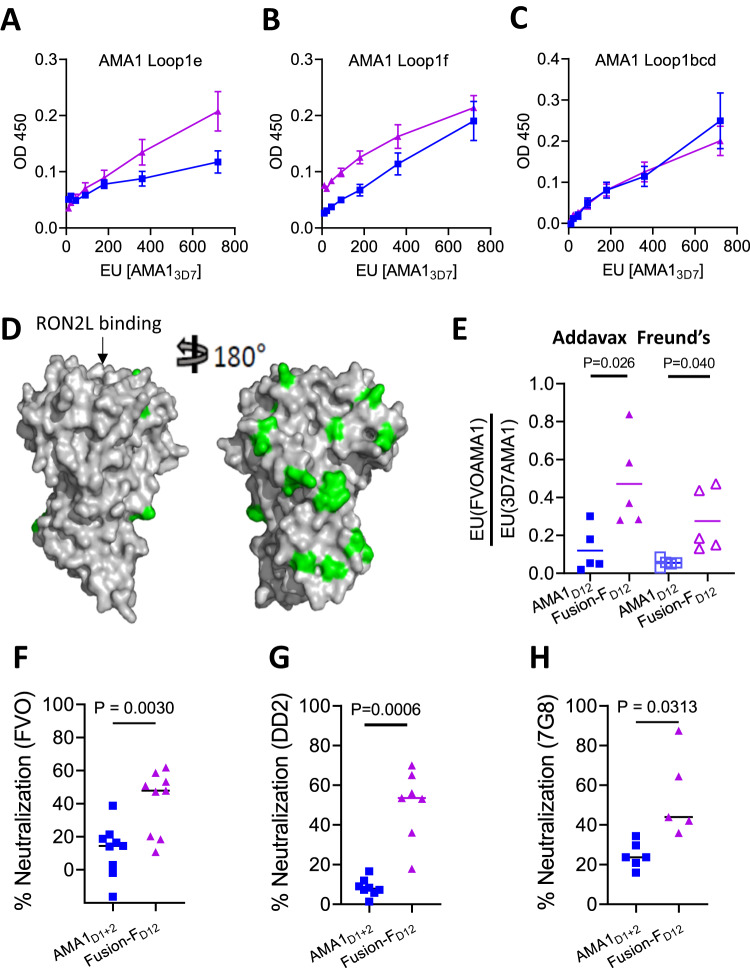
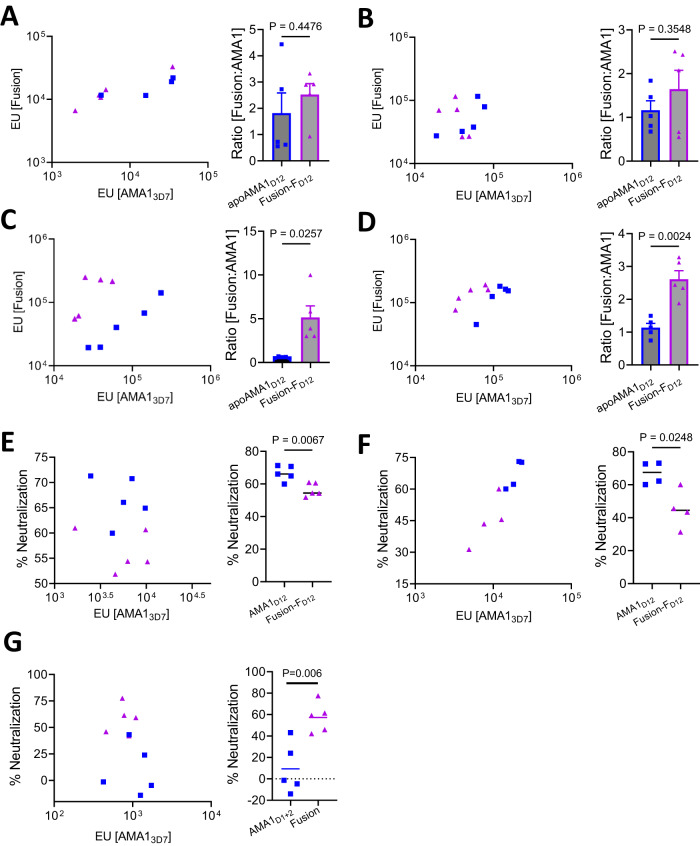
Invasion of human erythrocytes by Plasmodium falciparum (Pf) merozoites relies on the interaction between two parasite proteins: apical membrane antigen 1 (AMA1) and rhoptry neck protein 2 (RON2). While antibodies to AMA1 provide limited protection against Pf in non-human primate malaria models, clinical trials using recombinant AMA1 alone (apoAMA1) yielded no protection due to insufficient functional antibodies. Immunization with AMA1 bound to RON2L, a 49-amino acid peptide from its ligand RON2, has shown superior protection by increasing the proportion of neutralizing antibodies. However, this approach relies on the formation of a complex in solution between the two vaccine components. To advance vaccine development, here we engineered chimeric antigens by replacing the AMA1 DII loop, displaced upon ligand binding, with RON2L. Structural analysis confirmed that the fusion chimera (Fusion-FD12) closely mimics the binary AMA1-RON2L complex. Immunization studies in female rats demonstrated that Fusion-FD12 immune sera, but not purified IgG, neutralized vaccine-type parasites more efficiently compared to apoAMA1, despite lower overall anti-AMA1 titers. Interestingly, Fusion-FD12 immunization enhanced antibodies targeting conserved epitopes on AMA1, leading to increased neutralization of non-vaccine type parasites. Identifying these cross-neutralizing antibody epitopes holds promise for developing an effective, strain-transcending malaria vaccine.


Conflict of interest statement

P.S. is a named inventor on patents related to this work. The remaining authors declare no competing interests.

Figures

Fig. 1
Fig. 1. AMA1 domains 1 and 2 are sufficient for complex-mediated enhancement in antibody quality.
A Schematic of AMA1 showing domains 1, 2 (purple) and 3 (gray). Domains 1 and 2 (purple) of AMA1 together form a hydrophobic groove, the binding site for RONL2. Domain 3 (gray) is modeled on PvAMA1 domain 3 (PDB: 1W8K). B AMA1-specific antibody titer in the purified IgG from apoAMA1 (blue) and AMA1 + RON2L binary complex (green) immunized rats. Open circle and squares indicate the groups that used AMA1D123 (all three domains) and AMA1D12 (domains 1 and 2), respectively. Data are presented for individual animals (n = 4 per group) and each data point is the average of three replicates. Horizontal lines show the mean titer in each group. Two-tailed Welch’s t-test was performed to compare differences between groups. C In vitro neutralization (1-cycle) assay against vaccine-type 3D7 parasites using 2 mg/mL of total IgG from each animal. Data are from individual animals (n = 4 per group) and each data point is the average of three replicates. Horizontal lines show the mean neutralizing activity in each group. Two-tailed Welch’s t-test was performed to compare differences between groups. D Relationship between anti-AMA1 titer in the IgG (x-axis) and neutralizing (1-cycle) activity in 2 mg/mL total IgG (y-axis).
Fig. 2
Fig. 2. Engineered chimera mimics P. falciparum receptor-ligand binary complex.
A Schematic showing the region of AMA1 DII loop that was replaced with RON2L. B Surface view of PfAMA1-RON2L fusion with the same color code as shown in A. C 2Fo-Fc electron density map for PfRON2L contoured at 1.0 σ, highlighting well-ordered density from the N-terminus (residue 358) to the C-terminus (residue 393). D Structural overlay of PfAMA1-PfRON2 binary complex (PDB: 3ZWZ) with Fusion-FD12. Color scheme is same as in A. The key interactions driving the binding of PfRON2L to PfAMA1 in the binary complex indicated by asterisks (*) are conserved in Fusion-FD12. Box 1 shows R376 in the chimera (R2041 of PfRON2) fits snugly into the pocket of PfAMA1 stabilized by hydrogen bonds. Box 2 shows critical residues (P368/R2033) that form identical interactions with PfAMA1. E Structure overlay of binary complex and engineered chimera Fusion-FD12 showing AMA1 loops surrounding the RON2L binding site. The loops of the Fusion-FD12 chimera are colored and the corresponding loops in binary complex are shown in gray. Box 1 shows the loop 1a and a part of loop 1e that interacts with loop 1a. A hydrogen bond formed between N233 (loop 1e) and E136 (loop 1a) in the binary complex structure that is lost in the chimera. The curved arrows indicate the displacement of the sidechains. Box 2 shows the differences in loop 1e. There is a displacement of ~2.9 Å between the loops, most likely caused by the inability to form hydrogen bond between N233-E136 in chimera. The different orientations of the sidechains are indicated by curved arrows and the extent of displacement is indicated.
Fig. 3
Fig. 3. Qualitative changes in vaccine response to apoAMA1 vs. Fusion-FD12 immunogens.
A AMA1 titer in purified IgG (10 mg/mL) from animals immunized with apoAMA1D12 (blue) or Fusion-FD12 (purple) antigens in AddaVax (filled squares and triangles) and Freund’s (open squares and triangles) adjuvants. Data are from individual animals (n = 5 per group) and each data point is the average of two replicates. Horizontal line marks the mean titer in each group. Two-tailed Welch’s t-test was performed to compare differences between groups. B In vitro neutralization (2-cycle) assay against vaccine-type Pf3D7 parasites. Purified IgG from AMA1D12 and Fusion-FD12 groups were normalized for 3D7AMA1 titer within each adjuvant group. Data are from individual animals (n = 5 per group) and each data point is the average of two replicates. Horizontal line shows mean neutralizing activity in each group. Two-tailed Welch’s t-test was performed to compare differences between groups. C Differences in surface charge density between apoAMA1D12 and Fusion-FD12. D Proportion of IgG in animals within each group binding to Fusion-FD12 and apoAMA1. Data shows ratio of antibody titer from IgG of individual animals (n = 5 per group) and each data point is the average of two replicates. Two-tailed Welch’s t-test was performed to compare differences between groups. E Competition ELISA (cELISA) to determine IgG specificity against apoAMA1 antigen in the absence (-) or presence (+) of 2 µM free apoAMA1 between apoAMA1 and Fusion-FD12 immunized animals. Assays were performed in duplicate and shown as mean ± SEM (n = 5 per group). F Competition ELISA (cELISA) to determine IgG specificity against Fusion-FD12 antigen in the absence (-) or presence (+) of 2 µM free apoAMA1 between apoAMA1 and Fusion-FD12 immunized animals. Assays were performed in duplicate and shown as mean ± SEM (n = 5 per group).
Fig. 4
Fig. 4. Fusion chimera enhances neutralizing antibodies targeting conserved epitopes on AMA1.
AC Relative levels of IgG from the Fusion-FD12 (purple) and apoAMA1D12 (blue) groups targeting AMA1 loop1e (A), loop 1 f (B) and loops 1bcd (C). The x-axis indicates the amount of total AMA1-specific antibody titer (EU). Data are mean ± SEM (n = 5 per group) and each data point is the average of two replicates. D Comparison of polymorphisms in the FVO AMA1 relative to 3D7 AMA1. The conserved and polymorphic face of AMA1 is shown with the polymorphisms marked in green. RON2L binding site on AMA1 is indicated by an arrow. E Ratio of IgG binding to non-vaccine type FVOAMA1 vs. vaccine-type 3D7AMA1. Data are shown for individual animals (n = 5 per group) and each data point is the average of three replicates. Horizontal line marks the mean for each group. Two-tailed Welch’s t-test was performed to compare differences between groups. F In vitro neutralization assay against PfFVO parasites using purified IgG from AMA1D12 and Fusion-FD12 groups normalized for anti-3D7AMA1 titer (35,000 EU. Data are shown for individual animals (n = 9 per group) and each data point is the average of two replicates. Horizontal line shows mean neutralizing activity of each group. Two-tailed Welch’s t-test was performed to compare differences between groups. G In vitro neutralization assay against PfDD2 parasites using purified IgG from AMA1D12 and Fusion-FD12 groups normalized for anti-3D7AMA1 titer (40,000 EU). Data are shown for individual animals (n = 7, 8 per group for AMA1D1+2 and Fusion-FD12 respectively based on sample availability) and each data point is the average of two replicates. Horizontal line shows mean neutralizing activity of each group. Two-tailed Welch’s t-test was performed to compare differences between groups. H In vitro neutralization assay against Pf7G8 parasites using purified IgG from AMA1D12 and Fusion-FD12 groups normalized for anti-3D7AMA1 titer (60,000 EU). Data are shown for individual animals (n = 5, 6 per group for AMA1D1+2 and Fusion-FD12 respectively based on sample availability) and each data point is the average of two replicates. Horizontal line shows mean neutralizing activity of each group. Two-tailed Welch’s t-test was performed to compare differences between groups.
Fig. 5
Fig. 5. Antibody specificity and neutralizing activity differences in serum and affinity purified IgG.
A, B (left panels) Serum IgG titer in animals immunized with the Fusion-FD12 (purple triangle) or apoAMA1D12 (blue square) antigens in AddaVax (A) and Freund’s (B). The x-axis shows antibody titer against apoAMA13D7 and y-axis shows antibody titer against the Fusion-FD12 antigen. Data are shown for individual animals (n = 5 per group) and each data point is the average of two replicates. (A, B—right panels) Fusion-FD12 to apoAMA1 IgG ratio from data shown to the left in A and B, respectively. Two-tailed Welch’s t-test was performed to compare differences between groups. Data are shown as mean ± SEM for individual animals (n = 5 per group) and each data point is the average of two replicates. C, D (left panels) Antibody titer in 10 mg/mL of purified IgG from animals immunized with the Fusion-FD12 (purple triangle) or apoAMA1D12 (blue square) antigens in AddaVax (C) and Freund’s (D). The x-axis shows antibody titer against apoAMA13D7 and y-axis shows antibody titer against the Fusion-FD12 antigen. Data are shown for individual animals (n = 5 per group) and each data point is the average of two replicates. (C, D—right panels) Fusion-FD12 to apoAMA1 IgG ratio from data shown to the left in C and D, respectively. Two-tailed Welch’s t-test was performed to compare differences between groups. Data are shown as mean ± SEM for individual animals (n = 5 per group) and each data point is the average of two replicates. E Left—Relationship between anti-AMA1 antibody titer (x-axis) in the purified IgG and neutralizing (2-cycle) activity at 2 mg/mL total IgG (y-axis) between Fusion-FD12 (purple triangle) and apoAMA1D12 (blue square) antigens in AddaVax. Right—Comparison of data shown in left using Two-tailed Welch’s t-test. F Left—Relationship between anti-AMA1 antibody titer (x-axis) in the purified IgG and neutralizing (2-cycle) activity at 1.4 mg/mL total IgG (y-axis) between Fusion-FD12 (purple triangle) and apoAMA1D12 (blue square) antigens in Freund’s. Right—Comparison of data shown in left using Two-tailed Welch’s t-test. G Left—Relationship between anti-AMA1 antibody titer in serum (x-axis) and neutralizing (2-cycle) activity in 2% serum (y-axis) between Fusion-FD12 (purple triangle) and apoAMA1D12 (blue square) antigens in Freund’s adjuvant. Right—Comparison of data shown in left using Two-tailed Welch’s t-test.

Update of

Similar articles

Cited by

References

    1. WHO. World Malaria Report. (World Health Organization, 2021).
    1. RTS,S Clinical Trials Partnership Efficacy and safety of RTS,S/AS01 malaria vaccine with or without a booster dose in infants and children in Africa: final results of a phase 3, individually randomised, controlled trial. Lancet. 2015;386:31–45. - PMC - PubMed
    1. Ward KE, Fidock DA, Bridgford JL. Plasmodium falciparum resistance to artemisinin-based combination therapies. Curr. Opin. Microbiol. 2022;69:102193. - PMC - PubMed
    1. Langhorne J, Ndungu FM, Sponaas AM, Marsh K. Immunity to malaria: more questions than answers. Nat. Immunol. 2008;9:725–732. - PubMed
    1. Triglia T, et al. Apical membrane antigen 1 plays a central role in erythrocyte invasion by Plasmodium species. Mol. Microbiol. 2000;38:706–718. - PubMed

Publication types