. 2023 Oct;24(10):1725-1734.
doi: 10.1038/s41590-023-01608-9. Epub 2023 Sep 21.

Multimodal single-cell datasets characterize antigen-specific CD8+ T cells across SARS-CoV-2 vaccination and infection

Affiliations

Multimodal single-cell datasets characterize antigen-specific CD8+ T cells across SARS-CoV-2 vaccination and infection

Bingjie Zhang et al. Nat Immunol. 2023 Oct.

Abstract

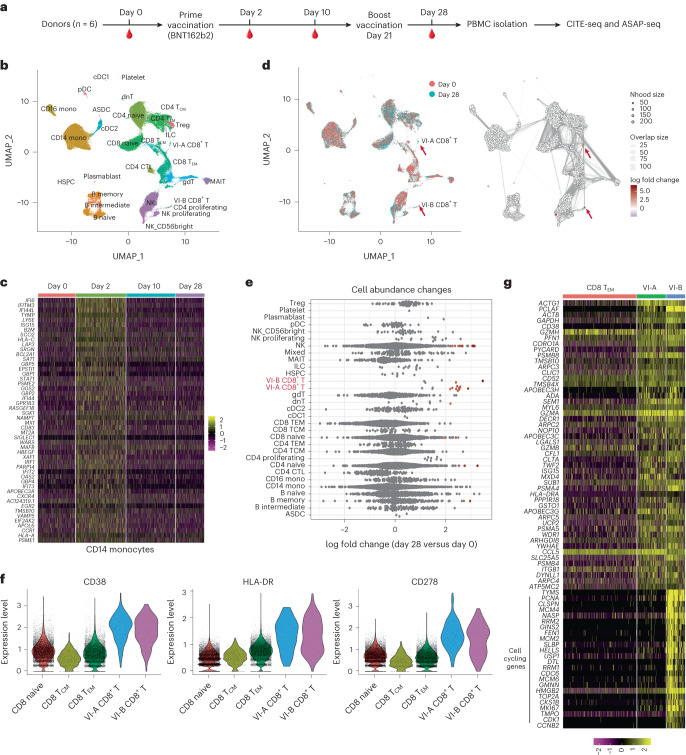
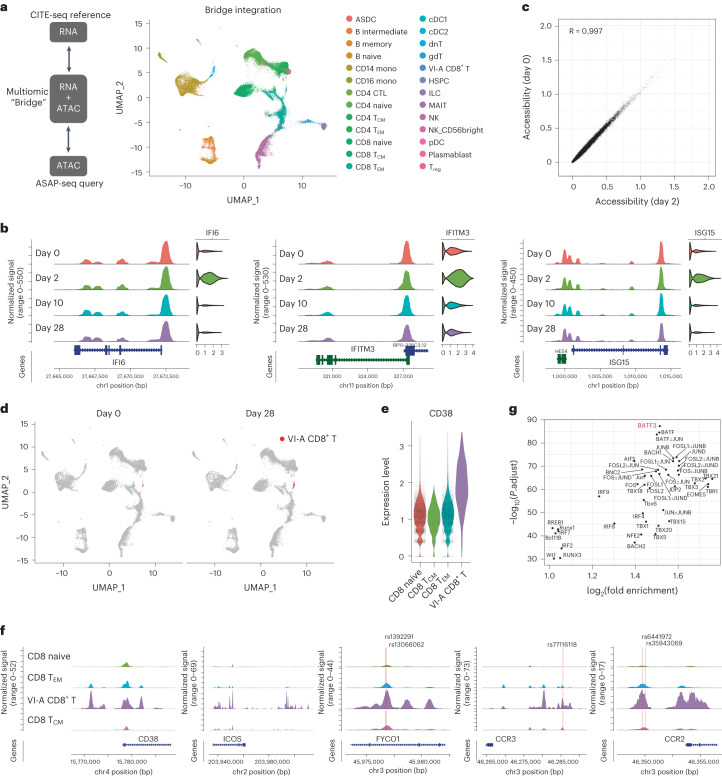
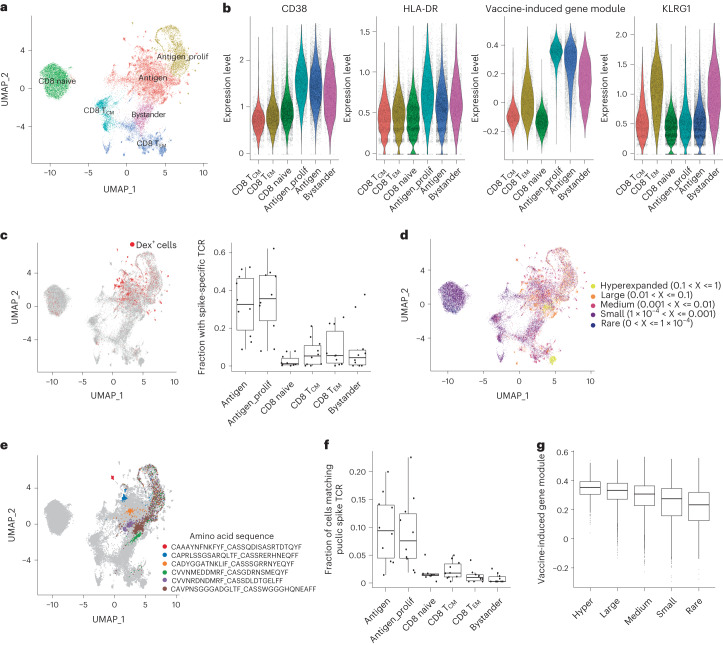
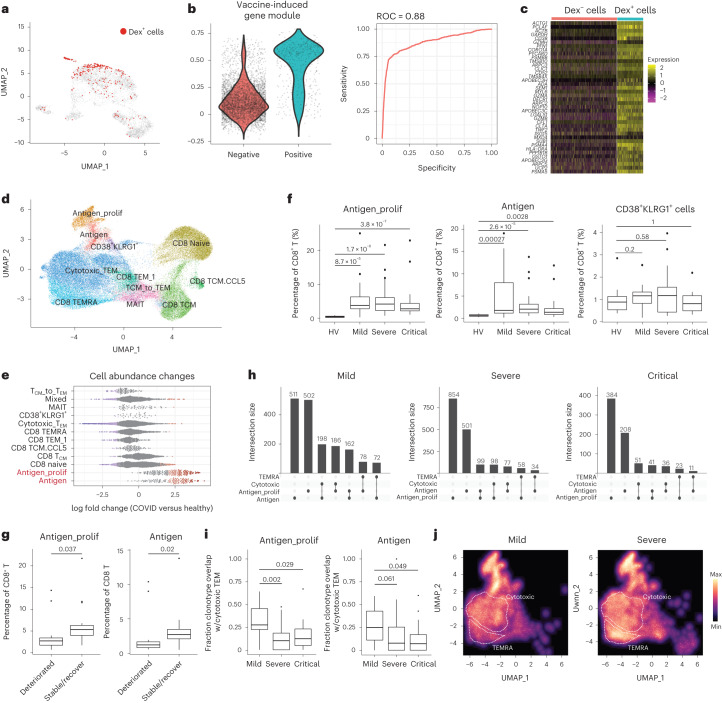
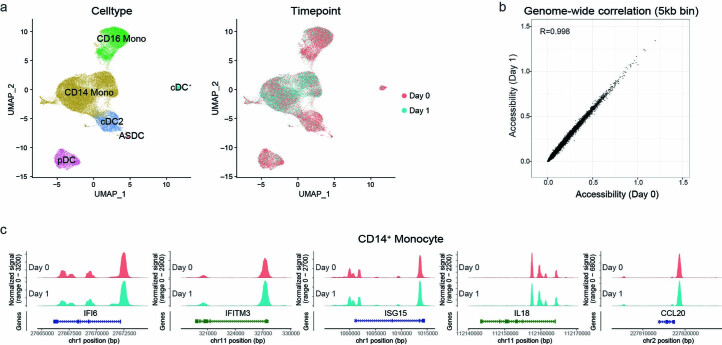
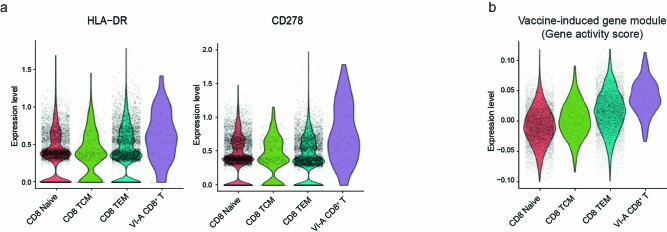
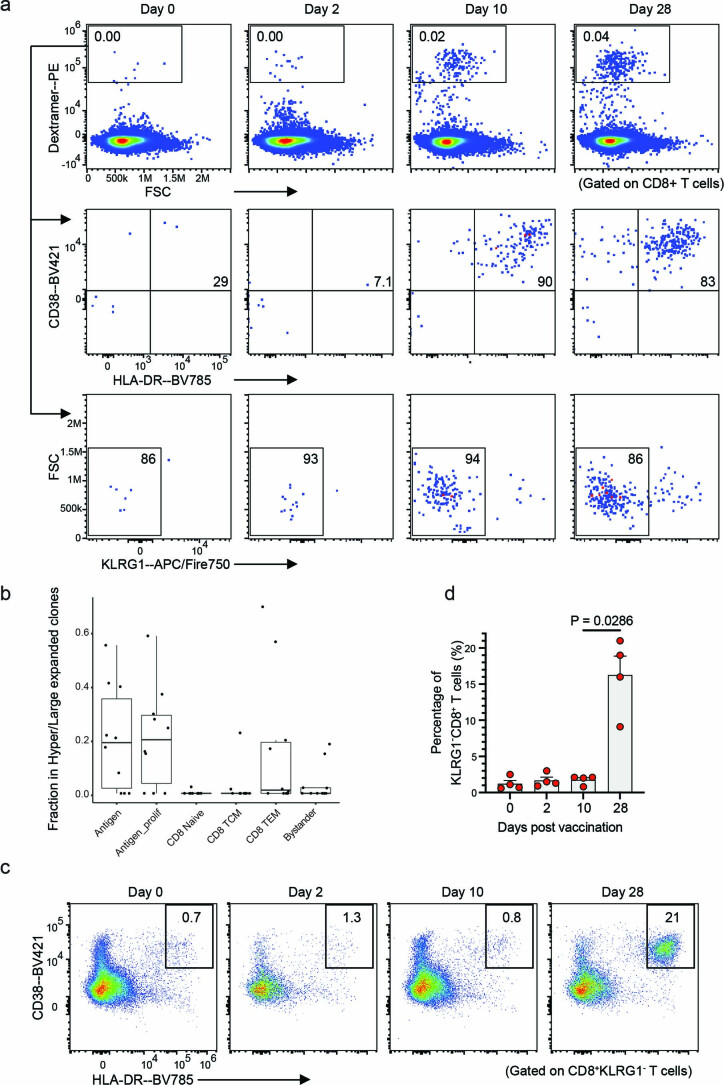
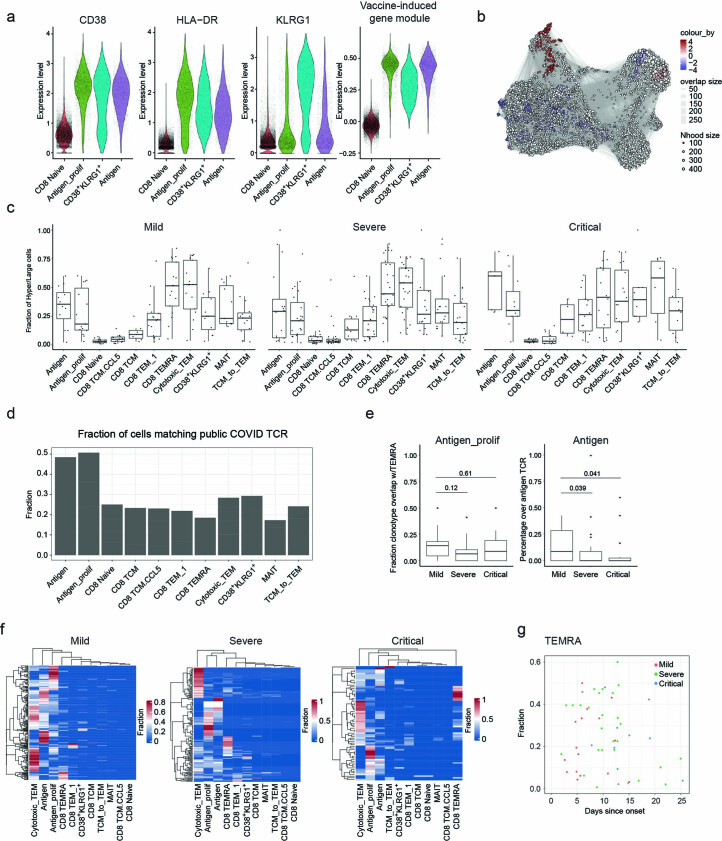
The immune response to SARS-CoV-2 antigen after infection or vaccination is defined by the durable production of antibodies and T cells. Population-based monitoring typically focuses on antibody titer, but there is a need for improved characterization and quantification of T cell responses. Here, we used multimodal sequencing technologies to perform a longitudinal analysis of circulating human leukocytes collected before and after immunization with the mRNA vaccine BNT162b2. Our data indicated distinct subpopulations of CD8+ T cells, which reliably appeared 28 days after prime vaccination. Using a suite of cross-modality integration tools, we defined their transcriptome, accessible chromatin landscape and immunophenotype, and we identified unique biomarkers within each modality. We further showed that this vaccine-induced population was SARS-CoV-2 antigen-specific and capable of rapid clonal expansion. Moreover, we identified these CD8+ T cell populations in scRNA-seq datasets from COVID-19 patients and found that their relative frequency and differentiation outcomes were predictive of subsequent clinical outcomes.


Conflict of interest statement

In the past 3 years, R.S. has worked as a consultant for Bristol-Myers Squibb, Regeneron and Kallyope and served as a scientific advisory board member for ImmunAI, Resolve Biosciences, Nanostring and the NYC Pandemic Response Lab. R.S. and Y.H. are co-founders and equity holders of Neptune Bio. As of August 1, 2023, Y.H. is an employee of Neptune Bio. D.R.L. is cofounder of Vedanta Biosciences and ImmunAI, on the advisory boards of IMIDomics and Evommune and on the board of directors of Pfizer. M.J.M. reports potential competing interests: laboratory research and clinical trials contracts with Lilly, Pfizer (exclusive of the current work) and Sanofi for vaccines or MAB vs SARS-CoV-2; contract funding from USG/HHS/BARDA for research specimen characterization and repository; research grant funding from USG/HHS/NIH for SARS-CoV-2 vaccine and MAB clinical trials; and personal fees from Meissa Vaccines and Pfizer for scientific advisory board service. R.S.H. has received research support from CareDx for SARS-CoV-2 vaccine studies. R.S.H. is a consultant for Bristol-Myers-Squibb. All other authors declare no competing interests.

Figures

Fig. 1
Fig. 1. Multimodal identification of SARS-CoV-2 mRNA vaccine-induced CD8+ T cells.
a, Overview of study design, in which PBMCs were collected from six healthy donors at day 0, day 2, day 10 and day 28 during the BNT162b2 mRNA vaccination process and comprehensive analyses using both CITE-seq and ASAP-seq were performed on these samples. b, Uniform manifold approximation and projection (UMAP) visualizations of 113,897 single cells obtained as in a profiled with CITE-seq and clustered by a weighted combination of RNA and protein modalities. Cells are colored based on level-2 annotation (level-1 and level-3 annotations; Extended Data Fig. 2a). c, Single-cell heatmap showing activation of interferon response module within CD14+ monocytes. d, Milo analysis of differentially abundant cell states between day 0 and day 28 samples as in panel a. UMAP on the left is color coded by timepoint. Right plot indicates embedding of the Milo differential abundance. Each node represents a neighborhood, node size is proportional to the number of cells, and neighborhoods are colored by the level of differential abundance. Nhood, neighborhood. e, Beeswarm plot showing the log-fold distribution of cell abundance changes between day 0 and day 28 samples as in a. Neighborhoods overlapping the same cell population are grouped together, neighborhoods exhibiting differential abundance are colored in red. f, Violin plots with protein upregulation of CD38, HLA-DR and CD278 (ICOS) in VI-A and VI-B CD8+ T cells compared with CD8+ naive, CD8+ TCM and CD8+ TEM cells. g, Heatmap showing mRNA expression of 50 marker genes for VI-A CD8+ T cells, as well as cell-cycling genes highly expressed in VI-B CD8+ T cells. For visualization purposes, a randomly selected subset of CD8+ TEM cells are presented. HSPC, hematopoietic stem and progenitor cell; NK, natural killer; pDC, plasma dendritic cell; TCM, central memory T cell; TEM, effector memory T cell. ASDC, AXL+ dendritic cell; CTL, cytotoxic T cell; dnT, double-negative T cell; gdT, gamma-delta T cell; MAIT, mucosal associated invariant T.
Fig. 2
Fig. 2. Cell-type-specific chromatin accessibility dynamics in response to vaccination.
a, Bridge integration-based mapping of scATAC-seq data from Fig. 1a onto the CITE-seq dataset from Fig. 1b. PBMCs were collected as in Fig. 1a. Cells are colored by reference-derived annotation. b, Coverage plots indicating chromatin accessibility around IFI6, IFITM3 and ISG15 in CD14+ monocytes across day 0, day 2, day 10 and day 28. Corresponding gene expression for each cell population, from the CITE-seq dataset, is shown on the right. c, Scatter plot measuring the correlation between day 0 and day 2 pseudobulk chromatin accessibility of CD14+ monocytes. Each point corresponds to a called scATAC-seq peak. d, UMAP visualization of scATAC-seq data on day 0 and day 28 after bridge integration. VI-A CD8+ T cells are highlighted in red. e, Expression of CD38 protein in VI-A CD8+ T cells, CD8+ naive, CD8+ TCM and CD8+ TEM cells. f, Chromatin accessibility patterns around CD38, ICOS, FYCO1, CCR3 and CCR2 gene loci on day 28 in VI-A CD8+ T cells, CD8+ naive, CD8+ TCM and CD8+ TEM cells. Single-nucleotide polymorphism (SNP) sites are annotated as yellow lines. g, Motif-based overrepresentation analysis of transcription factor binding sites in the top 1,000 peaks with differentially enriched accessibility in the VI-A CD8+ T cells.
Fig. 3
Fig. 3. Antigen-specific clonal expansion of vaccine-induced CD8+ T cells.
a, UMAP visualizations of 31,396 single cells profiled with ECCITE-seq and clustered based on weighted combination of RNA, protein and T cell receptor information. b, Violin plots for CD38, HLA-DR and KLRG1 protein expression, and the expression of VI-GEM in antigen, antigen_prolif, bystander CD8+ T cells, CD8+ naive, CD8+ TCM and CD8+ TEM cells. c, UMAP visualization from a, with Dex+ cells highlighted in red (left) and the fraction of cells harboring spike-specific TCR in each cluster (right). A TCR clone is considered spike-specific when at least one cell of the clone is Dex+. Boxplot shows variation across n = 10 samples. d, UMAP visualization from a. Cells are colored by the expansion index of their associated clonotype based on TCR sequence information. e, UMAP visualization from a. Cells representing the six most abundant spike-specific clones are highlighted. f, Boxplots showing the fraction of cells harboring TCR matching SARS-CoV-2 spike antigens in public databases (n = 10). g, Boxplots showing the single-cell expression of the VI-GEM in antigen and antigen_prolif CD8+ T cells. Cells are grouped by labels in panel d. Hyper: n = 815; large: n = 4058; medium: n = 5531; small: n = 4709; rare, n = 506. For the boxplots in panels c, f and g, the central line represents the median, whereas the upper and lower limits of the boxes correspond to the upper and lower quartiles, respectively. The whiskers extend to 1.5 times the interquartile range (IQR).
Fig. 4
Fig. 4. Inferred spike-specific T cells in SARS-CoV-2-infected samples.
a, UMAP visualization from Adamo et al., representing 6,070 CD8+ T cells collected during acute COVID-19 disease. Dex+ cells are highlighted in red. b, Violin plots showing distribution of expression of VI-GEM in Dex and Dex+ cells (left) and receiver operating characteristic (ROC) curve assessing the ability of the expression of VI-GEM to correctly predict Dex+ cells (right). c, Expression of top 40 genes of VI-GEM in Dex and Dex+ cells. For visualization purposes, a randomly selected subset of Dex cells are presented. d, WNN UMAP visualization of 65,889 single cells from the COMBAT dataset. WNN performed based on RNA and protein modalities. e, Milo analysis of differential abundance changes in healthy versus SARS-CoV-2-infected groups, as in Fig. 1e. f, Boxplots showing donor fraction of antigen, antigen_proflif, and CD38+KLRG1+ cells amongst all CD8+ T cells, grouped by disease state. n = 71 donors (HV: n = 10; mild: n = 17; severe: n = 28; critical: n = 16), and P values from two-tailed Wilcoxon rank-sum test. g, Boxplots showing donor fraction of antigen, antigen_prolif, and CD38+KLRG1+ cells amongst all CD8+ T cells in patients exhibiting severe symptoms grouped by their clinical outcome. Deteriorated, n = 12; stable/recover, n = 16. h, UpSet plot visualizing the overlap of TCR clonotype across antigen, antigen_prolif, cytotoxic and TEMRA CD8+ T cells. i, Fraction of TCR clonotypes identified in either antigen cells (right) or antigen_prolif cells (left) that were also observed in cytotoxic TEM cells. Boxplots show variation across 61 diseased donors (mild: n = 17; severe: n = 28; critical: n = 16). P values were determined by two-tailed Wilcoxon rank-sum test. j, Density plots showing the abundance distribution of all CD8+ T cells harboring the same TCR clonotypes identified in antigen and antigen_prolif CD8+ T cells. For the boxplots in panels f, g and i, the central line represents the median, whereas the upper and lower limits of the boxes correspond to the upper and lower quartiles, respectively. The whiskers extend to 1.5 times the IQR. HV, healthy volunteers; TEMRA, effector memory T cells re-expressing CD45RA.
Extended Data Fig. 1
Extended Data Fig. 1. UMAP visualizations of CITE-seq dataset without integration.
UMAP visualizations of 113,897 single cells profiled with CITE-seq and clustered on the weighted combination of both RNA and protein modalities without performing data integration. Cells are colored with experiment, donor, timepoint, level 2 or level 3 annotations.
Extended Data Fig. 2
Extended Data Fig. 2. Unveiling unique molecular signatures of vaccine-induced CD8+ T cells via CITE-seq analysis.
a, UMAP visualizations of 113,897 single cells profiled with CITE-seq and clustered on the weighted combination of both RNA and protein modalities. Cells are colored with either level 1 or level 3 annotations. b, Enriched GO terms for activated (Day 2 vs Day 0) genes in CD14+ Monocytes. c, Violin plots of interferon response signatures in selected cell types across four timepoints. P values were adjusted for multiple testing correction. d, Violin plots of protein expression of CD64 and CD169 in single cells in selected cell types, across four timepoints. e-f, Percentage of CD8+ T cells in vaccine-induced groups for each donor across four timepoints. g, Violin plots showing the protein expression of CD45RA, CD127, CD27, CD57 and CXC3R1 in selected cell types. h, Violin plots comparing gene module scores in VI-A and VI-B CD8+ T cells, as well as selected other subsets. i, Enriched reactome biological pathways for the 197 signature vaccine-induced gene set. P values were adjusted for multiple testing correction. j, Heatmap showing the expression of select genes in CD8+ T cell subtypes. The visualization presents pseudobulk averages, with cells grouped by cell type, individual human donor, and timepoints, and demonstrates that marker genes are reproducible across donors.
Extended Data Fig. 3
Extended Data Fig. 3. Detection of underrepresented vaccine-induced CD8+ T cells in a published dataset via supervised reference mapping.
a, UMAP visualization of CITE-seq data derived from human PBMC from ref. on day 0 and day 28, after reference mapping to the CITE-seq data in Fig. 1b. Cells matching gene signature for VI-A and VI-B CD8+ T cells are highlighted in red and blue. b, Boxplots showing the percentage of CD8+ T cells that fall in VI-A CD8+ T cells (left) or VI-B CD8+ T cells (right) for each donor across eight timepoints. Each dot represents one donor. The dataset is comprised of samples from n = 5 individual donors. Box center lines, bounds of boxes and whiskers indicate median, first and third quartiles and minima and maxima within a 1.5× interquartile range (IQR), respectively. c, Violin plots showing protein expression of CD38 and ICOS, along with a gene module score for vaccine-induced cells in selected CD8+ T cell subsets.
Extended Data Fig. 4
Extended Data Fig. 4. Investigating chromatin accessibility via ASAP-seq dataset.
a, Violin plots showing the expression of canonical surface proteins in the ASAP-seq dataset. Cells are grouped by bridge integration-derived labels. Proteins visualized include markers of CD4+ and CD8+ T cells, CD14+ and CD16+ monocytes, B cells and cDC2 cells. b, Violin plots showing the gene ‘activity scores’, which are derived from scATAC-seq data, of the interferon-induced gene set shown in Fig. 1c. c, Scatter plot showing the correlation between pseudobulk chromatin accessibility of CD14+ monocytes from day 0 and day 2 samples. Each point corresponds to a 5KB genomic bin. d, Correlation matrix showing Pearson correlation coefficients (all peaks) between two specified samples of chromatin accessibility.
Extended Data Fig. 5
Extended Data Fig. 5. Exploring chromatin accessibility shifts in myeloid cells following TIV vaccination.
a, UMAP visualization of the scATAC-seq profiles of myeloid cells from a trivalent inactivated seasonal influenza vaccine (TIV) study. Cells are colored by annotations (left) or timepoints (right). b, Scatter plot showing the correlation comparing pseudobulk chromatin accessibility of CD14+ monocytes in the TIV dataset between day 0 and day 1. Each point corresponds to a 5KB genomic bin. c, Visualization of open chromatin accessibility at representative loci on day 0 and day 1 in CD14+ monocytes from the TIV study.
Extended Data Fig. 6
Extended Data Fig. 6. Validation of VI-A CD8+ T Cells predicted by bridge integration workflow.
a, Violin plots showing the protein expression of HLA-DR and CD278 (ICOS) in the VI-A CD8+ T cells identified in the ASAP-seq dataset. Cells are grouped by their bridge integration-derived labels. b, Violin plots showing the module score of VI-GEM in the ASAP-seq dataset. The module score is calculated based on gene activity scores, which are derived from scATAC-seq data.
Extended Data Fig. 7
Extended Data Fig. 7. Flow cytometry evaluation of Dex+CD8+ T Cells.
a, Flow cytometry data generated during validation of individual dextramer reagents, with the progressive emergence of cells in the Dex+ gate across timepoints for a single donor. CD8+ cells were used as input. Middle and bottom row show CD38, HLA-DR, and KLRG1 abundance from the parent gate of Dex+CD8+ T cells. b, Boxplots indicate the fraction of cells harboring a hyper- or large-expanded TCR clone in each cluster across n = 10 samples. Each dot represents one biological sample. Box center lines, bounds of boxes and whiskers indicate median, first and third quartiles and minima and maxima within a 1.5× interquartile range (IQR), respectively. c, Exemplary flow cytometry plots indicate the percentage of cells in CD38+HLA-DR+ gate of a single donor, from a parent gate of KLRG1CD8+ cells. d, Bar graph shows the percentage of CD38+HLA-DR+ cells in each donor, as a fraction of the KLRG1CD8+ gate exemplified in c. Data represents n = 4 donors with variable HLA haplotypes, presented as mean ± s.e.m.; p-value is calculated using unpaired Mann-Whitney U test. PE, phycoerythrin.
Extended Data Fig. 8
Extended Data Fig. 8. Assessing the differential abundance of CD38+KLRG1-CD8+ T cells in SARS-CoV-2 infected samples.
a, Violin plots showing the protein expression of CD38 and HLA-DR, along with the signature gene module score for the vaccine-induced cells, in the COMBAT dataset. b, Milo analysis of differential abundance changes between healthy and SARS-CoV-2 infected CD8+ T cells groups from the COMBAT dataset. UMAP visualization of the Milo differential abundance testing results. Each node represents a neighborhood. The size of nodes is proportional to the number of cells in the neighborhood. Neighborhoods are colored by their log fold changes for SARS-CoV-2 infected versus healthy groups. Only neighborhoods showing significant enrichment (SpatialFDR < 0.1 and logFC > 2) are colored. c, Boxplots showing the fraction of cells harboring a hyper or large expanded TCR clone within each cluster. Each dot represents one biological sample. Mild: n = 17; Severe: n = 28; Critical: n = 16. d, Barplot showing the fraction of cells within each cluster harboring TCR matching SARS-CoV-2 antigens in public databases. e, Fraction of TCR clonotypes identified in either antigen cells (right) or antigen_prolif cells (left), that are also identified in TEMRA cells. Boxplots show variation across 61 diseased donors. Mild: n = 17; Severe: n = 28; Critical: n = 16. P values were determined by two-tailed Wilcoxon rank-sum test. f, Heatmaps show the distribution of cells harboring expanded antigen-specific TCR sequences among all cell states. Each row corresponds to one expanded clone, clones that are shared between molecular states will exhibit a positive fraction in multiple columns. g, Scatter plot showing the lack of a potentially confounding correlation between the fraction of CD8 T cells in the TEMRA state, and the sample collection time since onset. Each dot represents one donor and is colored by disease state. For the boxplots in c and e, the center line indicates the median, box limits represent the upper and lower quartiles and whiskers indicate 1.5 times the IQR.

Update of

Comment in

Similar articles

Cited by

References

    1. Polack FP, et al. Safety and efficacy of the BNT162b2 mRNA COVID-19 vaccine. N. Engl. J. Med. 2020;383:2603–2615. - PMC - PubMed
    1. Magen O, et al. Fourth dose of BNT162b2 mRNA COVID-19 vaccine in a nationwide setting. N. Engl. J. Med. 2022;386:1603–1614. - PMC - PubMed
    1. Walsh EE, et al. Safety and immunogenicity of two RNA-based COVID-19 vaccine candidates. N. Engl. J. Med. 2020;383:2439–2450. - PMC - PubMed
    1. Goel RR, et al. mRNA vaccines induce durable immune memory to SARS-CoV-2 and variants of concern. Science. 2021;374:abm0829. - PMC - PubMed
    1. Oberhardt V, et al. Rapid and stable mobilization of CD8+ T cells by SARS-CoV-2 mRNA vaccine. Nature. 2021;597:268–273. - PMC - PubMed