. 2023 Nov;24(11):1825-1838.
doi: 10.1038/s41590-023-01631-w. Epub 2023 Sep 21.

Discrimination of cell-intrinsic and environment-dependent effects of natural genetic variation on Kupffer cell epigenomes and transcriptomes

Affiliations

Discrimination of cell-intrinsic and environment-dependent effects of natural genetic variation on Kupffer cell epigenomes and transcriptomes

Hunter Bennett et al. Nat Immunol. 2023 Nov.

Abstract

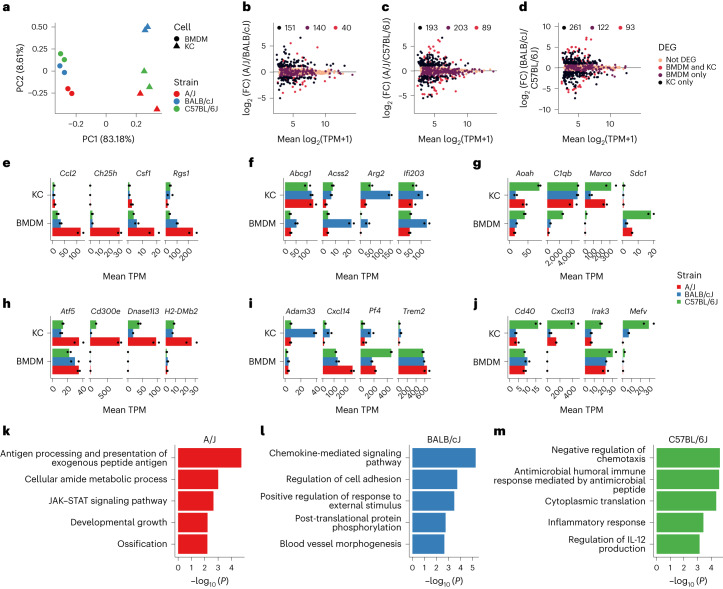
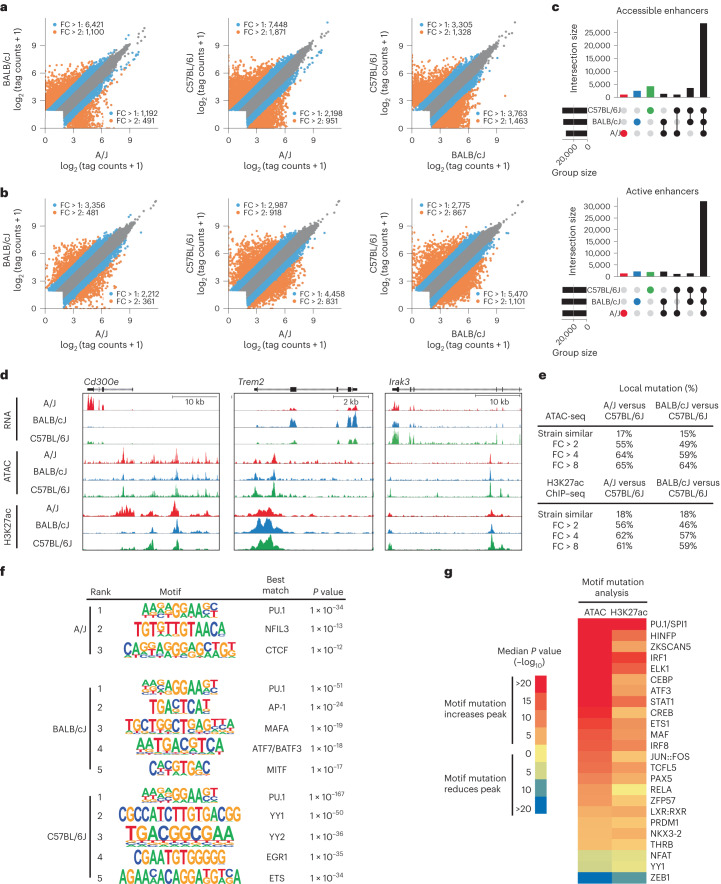
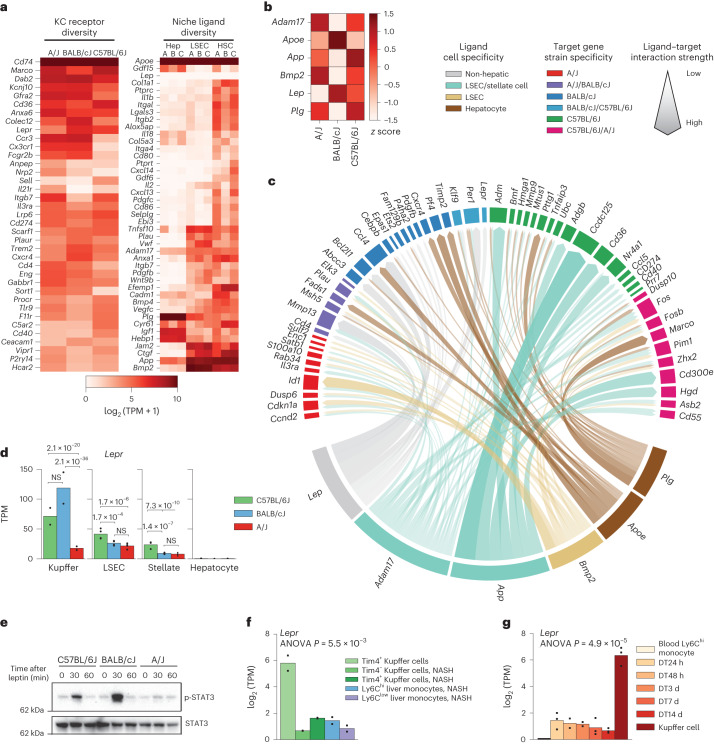
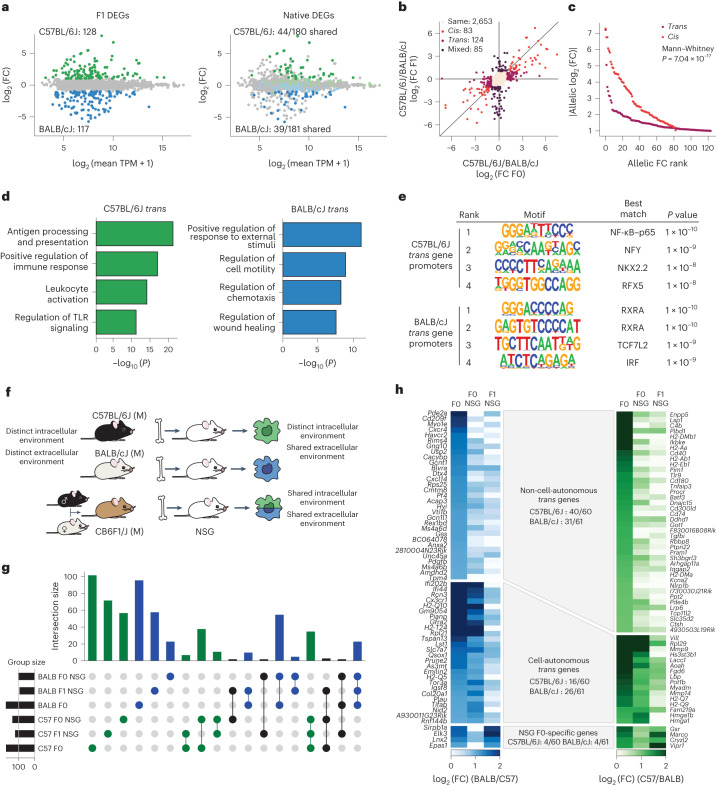
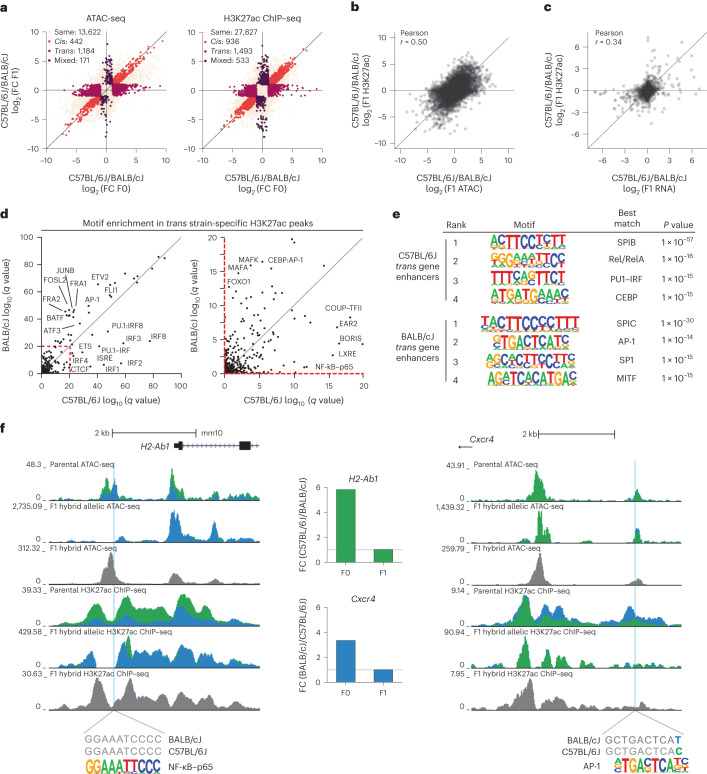
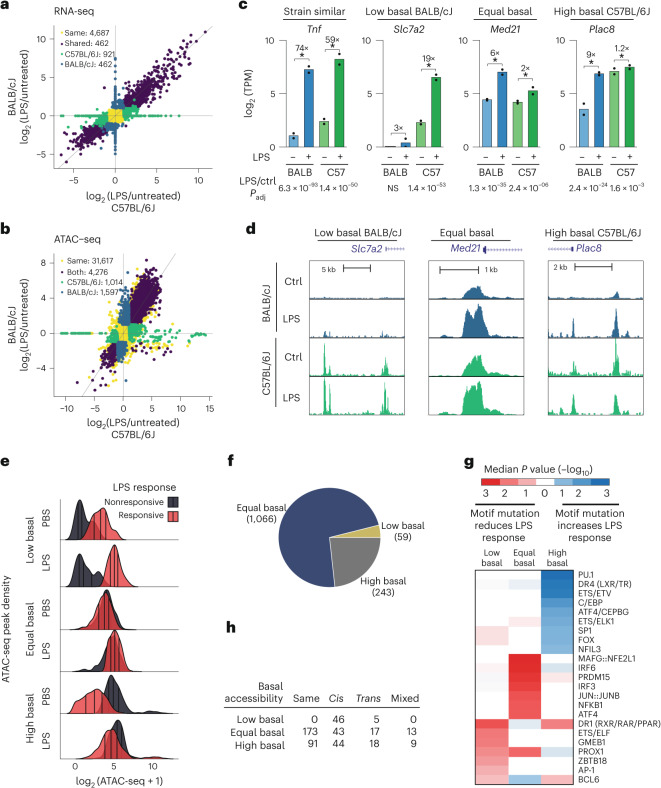
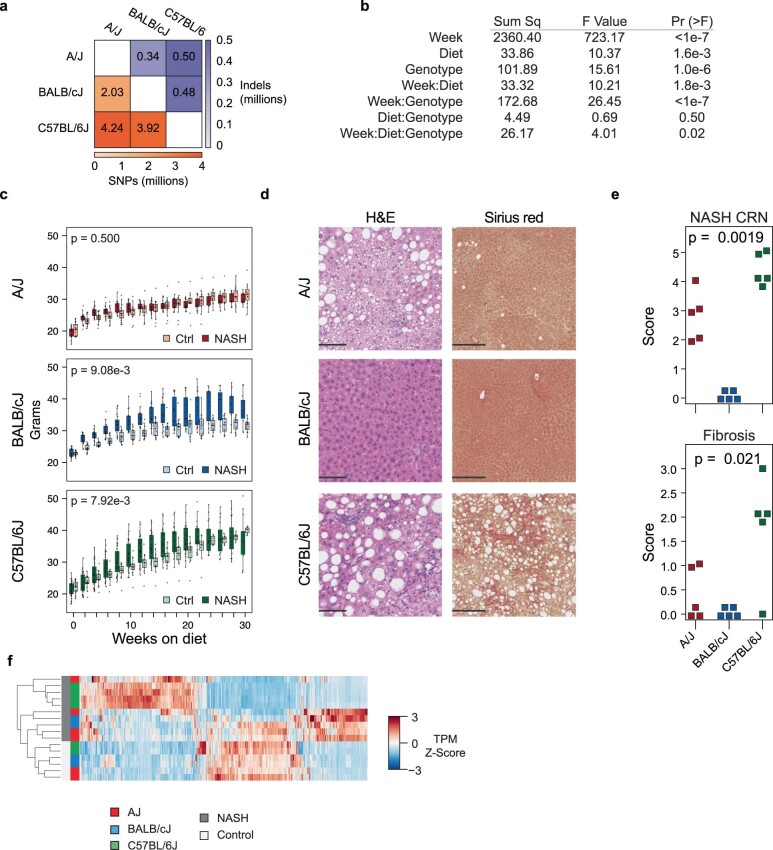
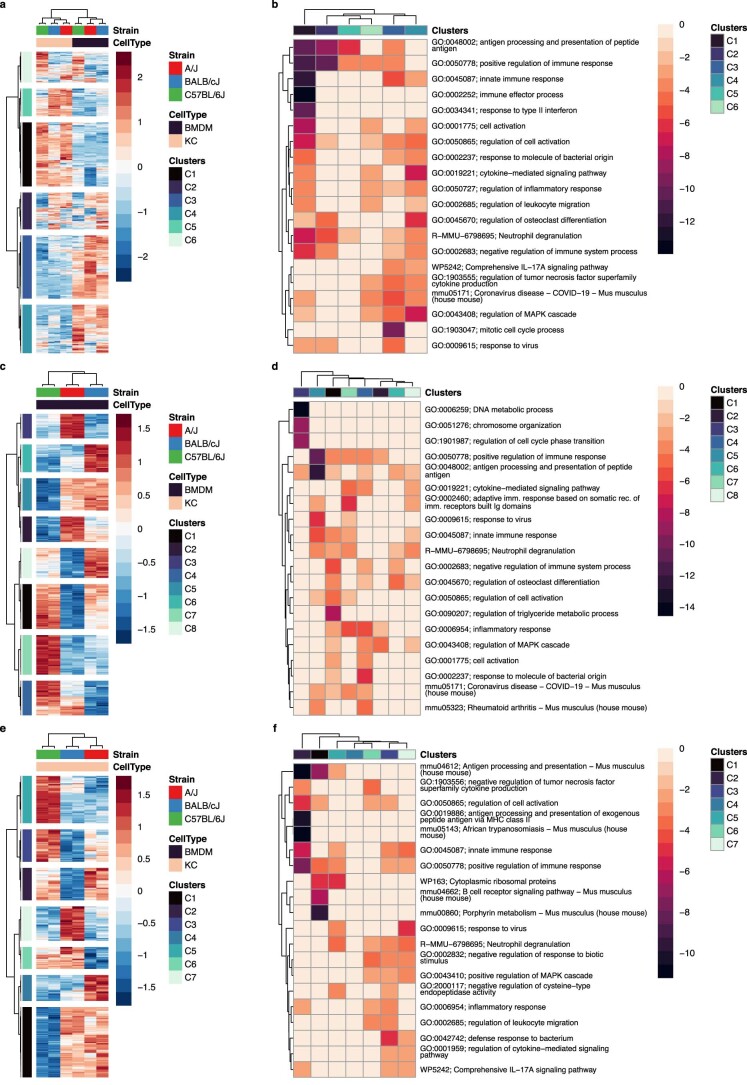
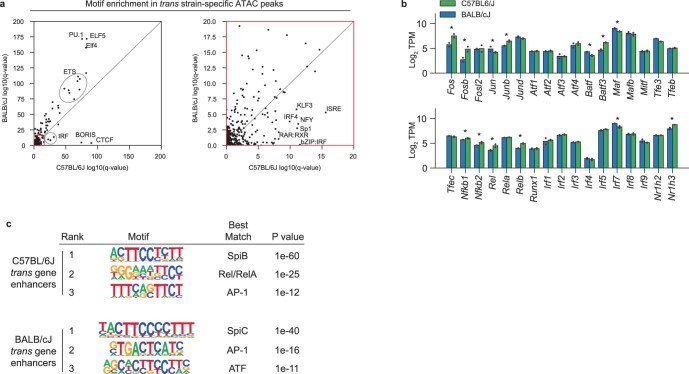
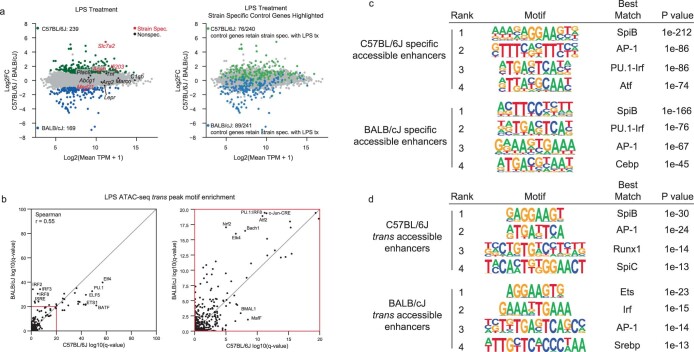
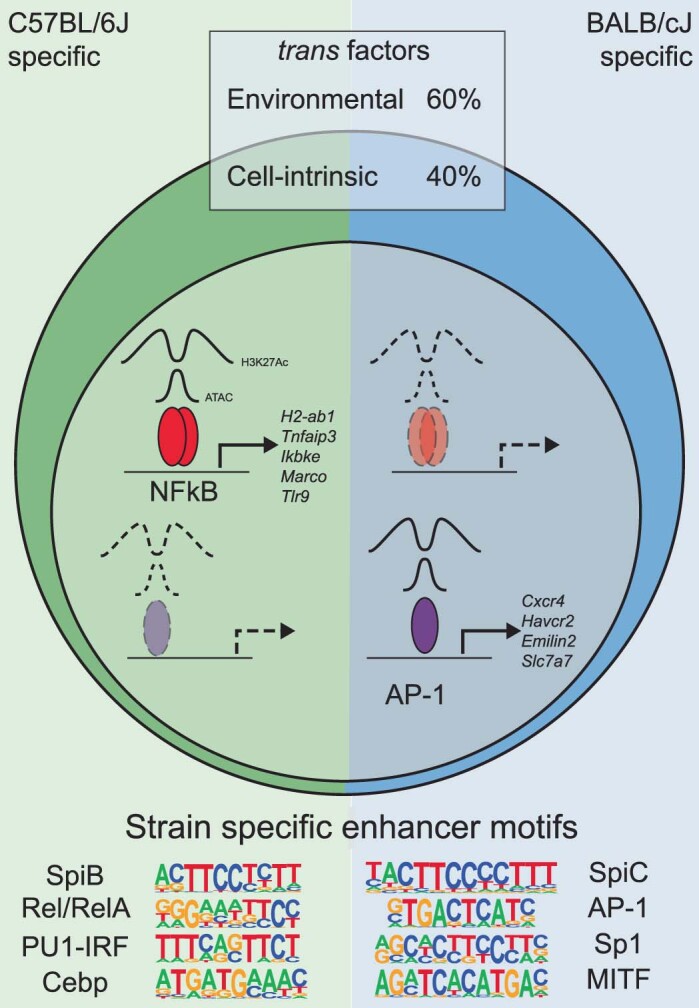
Noncoding genetic variation drives phenotypic diversity, but underlying mechanisms and affected cell types are incompletely understood. Here, investigation of effects of natural genetic variation on the epigenomes and transcriptomes of Kupffer cells derived from inbred mouse strains identified strain-specific environmental factors influencing Kupffer cell phenotypes, including leptin signaling in Kupffer cells from a steatohepatitis-resistant strain. Cell-autonomous and non-cell-autonomous effects of genetic variation were resolved by analysis of F1 hybrid mice and cells engrafted into an immunodeficient host. During homeostasis, non-cell-autonomous trans effects of genetic variation dominated control of Kupffer cells, while strain-specific responses to acute lipopolysaccharide injection were dominated by actions of cis-acting effects modifying response elements for lineage-determining and signal-dependent transcription factors. These findings demonstrate that epigenetic landscapes report on trans effects of genetic variation and serve as a resource for deeper analyses into genetic control of transcription in Kupffer cells and macrophages in vitro.


Conflict of interest statement

C.K.G. is a cofounder, equity holder and member of the Scientific Advisory Board of Asteroid Therapeutics. The other authors declare no competing interests.

Figures

Fig. 1
Fig. 1. Gene-by-environment transcriptional regulation of primary mouse macrophages.
a, Global principal component analysis for RNA-seq data from BMDMs and Kupffer cells from the indicated strains. Data represent any gene expressed above a TPM threshold of 8; n = 2 per group; PC, principal component; KC, Kupffer cells. bd, Comparison of the mean TPM and the DeSeq2 log2 (fold change) (log2 (FC)) value for RNA-seq data from Kupffer cells purified from the indicated strains. Differentially expressed genes were identified using a log2 (fold change) of >1, an adjusted P value of <0.05 and a TPM of >8, as identified using DeSeq2 P value (Wald’s test with multiple testing correction using the Benjamini–Hochberg method) and HOMER (TPM normalization); DEG, differentially expressed gene. ej, Expression of representative genes in BMDMs (e, f and g) and Kupffer cells (h, i and j) identified as A/J specific (left; e and h), BALB/cJ specific (middle; f and i) or C57BL/6J specific (right; g and j). Genes were defined as strain specific if they were expressed at a significantly higher level in one strain than in both other strains. Data represent the mean TPM. km, Gene ontology enrichment for strain-specific genes, which were defined as genes with significantly increased expression (log2 (fold change) > 1, adjusted P < 0.05) in one strain compared to both other strains, for example, increased expression in A/J mice relative to BALB/cJ mice and in A/J mice relative to C57BL/6J mice; n = 2 per subgroup for transcriptional analysis.
Fig. 2
Fig. 2. Local and global effect of natural genetic variation on the Kupffer cell epigenome.
a, Scatter plots of log2 (tag counts) for ATAC-seq signal at the union set of irreproducible discovery rate (IDR) ATAC-seq peaks across all strains; n = 4 per group. b, Scatter plots of log2 (tag counts) for H3K27ac ChIP–seq signal at the union set of IDR ATAC-seq peaks across all strains; tags are annotated with a window size of 1,000 base pairs (bp) centered on the middle of the IDR peak; n = 3 per group. c, Overlap of active and accessible genomic loci for each strain. Accessible loci are defined as sites with >16 HOMER-normalized ATAC-seq tags. Active loci are defined as sites with >32 HOMER-normalized H3K27ac ChIP–seq tags. d, Strain-specific epigenetic signals associated with transcriptional activation. Cd300e expression and H3K27ac acetylation of nearby enhancers are specific to A/J Kupffer cells. Trem2 is preferentially expressed in BALB/cJ Kupffer cells and is associated with increased acetylation of an intronic enhancer. Irak3 is preferentially expressed in C57BL/6J Kupffer cells and is associated with C57BL/6J-specific ATAC-seq peaks and increased acetylation of nearby enhancers; kb, kilobases. e, Enhancers were categorized into strain similar or strain specific for both ATAC-seq and H3K27ac ChIP–seq data. The table denotes percentages of enhancers at each fold change cutoff that harbor local genetic variation within the 200 bp of the IDR peak. f, Motifs associated with strain-specific active enhancers, defined as loci that had strain-specific increases in H3K27ac. g, MAGGIE motif mutation analysis on strain differentially accessible and active enhancers.
Fig. 3
Fig. 3. Hepatic Kupffer cell niche differences predicted using network analysis.
a, Gene expression of receptors by Kupffer cells (left) or ligand by niche companion cells (right) from the indicated cell types (‘A’, ‘B’ and ‘C’ annotations on the right indicate expression in A/J, BALB/cJ and C57BL/6J mice, respectively); Hep, hepatocytes; HSC, hematopoietic stem cells. b, Top NicheNet ligand activity scores for each strain. Significance was normalized to z score across strains; n = 2 samples per group for Kupffer cell RNA-seq, and n = 4 samples per subgroup for niche companion cell RNA-seq. c, Circos plot demonstrating gene targets of the top six NicheNet ligands from b. The width of arrows represents the NicheNet activation score for a given ligand–target gene pair. d, Strain-specific expression of the leptin receptor in hepatic cells. P values are derived from DESeq2 (Wald’s test with multiple testing correction using the Benjamini–Hochberg method); n = 2 samples per group for Kupffer cell RNA-seq, and n = 4 samples per subgroup for niche companion cell RNA-seq; NS, not significant. e, Immunoblot assessment of total and phosphorylated STAT3 in liver tissue from mice injected with 1 mg per kg (body weight) leptin via the intraperitoneal route. Data are representative of three experiments. f, Expression of the gene encoding the leptin receptor in Kupffer cells from healthy C57BL/6J mice (left) and myeloid cells including macrophages and monocytes isolated from mice fed an Amylin liver NASH (AMLN) NASH-inducing diet for 20 weeks. Data were analyzed by one-way analysis of variance (ANOVA); P = 5.5 × 10–3; n = 2 samples per subgroup. g, Expression of the gene encoding the leptin receptor in embryonic-derived Kupffer cells (far right) and bone marrow-derived monocytes repopulating the liver at specific time points following depletion of resident Kupffer cells with diptheria toxin. Data were analyzed by one-way ANOVA; P = 4.9 × 10–5; n = 2 samples for Ly6Chi monocytes, DT48 h, DT3 d and DT14 d subgroups; n= 3 samples for DT24 h, DT7 d and Kupffer cell subgroups. Source data
Fig. 4
Fig. 4. Cell-autonomous and non-cell-autonomous trans interactions contribute to gene expression differences in Kupffer cells.
a, Differential allelic expression in F1 hybrid mice with significantly biased genes colored by strain (left) or allelic expression in F1 hybrid mice with overlayed F0 strain-specific genes (right). The dark-colored dots represent genes with strain-specific bias in F0 mice and allelic bias in F1 hybrid mice. The light-colored dots indicate genes that lost strain specificity in F1 hybrid mice. Data are presented in an ‘MA plot’ format. On the x axes, data depict the log2-transformed average TPM between samples from the displayed comparison. On the y axes, data depict relative expression differences (log2 (fold change)) calculated using DeSeq2. b, Comparison of gene expression ratios using Kupffer cells from parental mice (x axis) to Kupffer cells from F1 mice (y axis). Genes with maintained expression differences in both comparisons are labeled ‘cis’ and are colored red; genes differentially expressed in parental cells and without allelic bias in F1 cells are labeled ‘trans’ and are colored light purple; genes expressed similarly in parental data and with allelic bias are labeled ‘mixed’ and are colored dark purple; genes expressed similarly in both comparisons are labeled ‘same’ and are colored light beige. c, Cumulative distribution of allelic fold change in parental strains associated with cis and trans genes. d, Gene ontology enrichment of BALB/cJ and C57BL/6J-specific trans genes. e, HOMER de novo motif enrichment in promoters associated with BALB/cJ- or C57BL/6J-specific trans genes. f, Experimental schematic for chosen strategies used to predict cell-autonomous and non-cell-autonomous patterns of strain-specific gene expression by Kupffer cells. g, UpSet plot displaying intersections of BALB/cJ and C57BL/6J strain-specific genes across the parental, F0–NSG transplant and F1–NSG transplant conditions. Vertical bar plots illustrate the number of genes in a set, with colored dots below the plots representing the experiments sharing a given set of differential genes. h, Overlap of trans genes identified in F1 and NSG models. The trans genes were identified as in b. NSG trans genes were filtered to only consider genes harboring a mutation, allowing discrimination of allelic reads in F1 Kupffer cells.
Fig. 5
Fig. 5. Cis and trans analysis of epigenetic loci reveals upstream regulators of trans transcriptional diversity.
a, Comparison of ATAC-seq (left) and H3K27ac ChIP–seq (right) tag ratios using Kupffer cells from parental mice (x axes) and F1 hybrid mice (y axis). All IDR ATAC-seq peaks harboring a mutation were considered for analysis. Peaks with maintained ATAC-seq tag differences in both comparisons are labeled ‘cis’ and are colored red; peaks with differential ATAC-seq tags in parental cells but not in the F1 model are labeled ‘trans’ and are colored purple; peaks with similar ATAC-seq tags in parental data and allelic bias in ATAC-seq tags in F1 mice are labeled ‘mixed’ and are colored dark purple; peaks with similar ATAC-seq tags in both comparisons are labeled ‘same’ and are colored beige. b, Correlation of allelic ATAC-seq and H3K27ac ChIP–seq reads at IDR ATAC-seq peaks with at least 16 ATAC-seq and H3K27ac reads in at least one sample. c, Correlation of allelic RNA-seq reads and promoter H3K27ac ChIP–seq reads for transcripts expressed at TPM > 4 and promoters with greater than eight H3K27ac ChIP–seq reads in at least one sample. d, Enrichment score of known transcription factor motifs in trans BALB/cJ-specific enhancers (y axis) and in trans C57BL/6J H3K27ac enhancers (x axis). e, De novo motif enrichment at active enhancers (>32 H3K27ac tags) associated with C57BL/6J or BALB/cJ trans genes. f, Examples of trans-regulated epigenetic loci upstream of trans-regulated genes. A strain-invariant NF-κB motif lies within a trans-regulated C57BL/6J-specific enhancer upstream of the C57BL/6J trans gene H2-Ab1 (left). An AP-1 motif with a mutation outside the core binding sequence lies in a trans-regulated BALB/cJ-specific enhancer upstream of the BALB/cJ-specific trans gene Cxcr4 (right). Colored tracks/bars denote BALB/cJ (blue) or C57BL/6J (green) data.
Fig. 6
Fig. 6. Strain-specific response to LPS determined by cis-acting changes in motif affinity.
a, Comparison of transcriptional response to LPS in C57BL/6J (x axis) and BALB/cJ (y axis) Kupffer cells. Mice were treated with 0.1 mg per kg (body weight) LPS by intraperitoneal injection for 2 h before Kupffer cell isolation. Genes were considered differentially expressed if their expression differed with an absolute log2(fold change) > 1 and adjusted P < 0.05. Genes were separated into C57BL/6J- or BALB/cJ-specific LPS-induced genes (green and blue, respectively) or ‘same’ if LPS induced equivalent expression changes in both C57BL/6J and BALB/cJ Kupffer cells (purple); n = 2 samples per subgroup. b, Comparison of ATAC-seq response to LPS in C57BL/6J (x axis) and BALB/cJ (y axis) Kupffer cells; n = 4 samples for basal C57BL/6J and BALB/cJ ATAC-seq data, and n = 2 and n = 3 for LPS-treated C57BL/6J and BALB/cJ ATAC-seq data, respectively. c, Examples of strain-similar and strain-differential transcriptional responses to LPS. The asterisk (*) indicates a DESeq2-adjusted P value of <0.05 (Wald’s test with multiple testing correction using the Benjamini–Hochberg method) for the comparison between LPS and basal conditions; n = 2 mice per group for the LPS-treated RNA-seq data; ctrl, control; Padj, adjusted P value; BALB, BALB/cJ; C57, C57BL/6J. d, ATAC-seq signal at nearby enhancers associated with ‘low basal’, ‘equal basal’ and ‘high basal’ genes. e, Distribution of ATAC-seq signal in ‘low basal’, ‘equal basal’ and ‘high basal’ composite enhancers. f, Number of enhancers in each basal accessibility category. g, MAGGIE motif mutation analysis comparing motif scores between strains associated with each category of enhancer. ‘Motif mutation’ refers to reduced motif scores in one strain relative to the comparison strain. Heatmap P-values refer to the motif scores in the LPS non-responsive strain relative to the responsive strain. h, Overlap of three enhancer categories with cis and trans enhancer analysis performed in CB6F1/J Kupffer cells isolated from mice treated with LPS for 2 h; P < 3 × 10–24 (Pearson chi-squared P value for association of basal states and cis/trans regulation).
Extended Data Fig. 1
Extended Data Fig. 1. Inbred strains vary in susceptibility to a NASH-model diet.
a, Degree of natural genetic variation between three inbred strains used in this study. b, Modeled weight gain assessed bi-weekly for each strain fed ad libitum with the Amylin liver NASH model diet, or a matched control diet. Main effects and their interaction were assessed for significance using a linear mixed model fit by maximum likelihood [‘lmerModLmerTest’] and assessed by type III analysis of variance using Satterthwaite’s method. Sample sizes are shown in Supplemental Table 3. c, Weekly weight gain in each strain on the AMLN diet. Box-whiskers boxes denote medians and first and third quartiles, and whiskers denote 1.5*IQR (interquartile range) as per ggplot2 defaults. All individual data points are overlayed in place of outlier values. P-values denote t-statistic probabilities for the diet*time interaction using Satterthwaite’s method. Data were modeled as in b by subsetting on strain and reducing the main strain effect. Sample sizes are shown in Supplemental Table 3. d, Histopathological evidence of NASH in following 30 weeks of AMLN diet in each strain of mice using hematoxylin and eosin (left) and Sirius red (right) staining of mouse livers. Scale bars denote 100 microns. e, Histopathological scoring of NASH (top) and fibrosis (bottom) in each strain of mouse following 30 weeks of AMLN diet. Strain effects were assessed independently for NASH CRN and fibrosis score using a Kruskal-Wallis test (R, kruskal.test). N = 5 samples per group for histopathologic data. f, Unsupervised clustering of strain-specific differential genes from Kupffer cells from mice fed control or AMLN NASH-inducing diet, N = 2 per group for control diet Kupffer cells, N = 4 for A/J and C57BL/6J AMLN diet Kupffer cells and N = 2 for BALB/cJ AMLN diet Kupffer cells. Differential genes were defined using pairwise comparisons in DESeq2 with a Log2 Fold Change > 1 and an adjusted p value < 0.05 (Wald’s test with multiple testing correction using Benjamini–Hochberg method)FDR adjusted p-value >< 0.05.
Extended Data Fig. 2
Extended Data Fig. 2. Gene-by-environment control of macrophage transcription.
a, Global comparison of differentially expressed genes between Kupffer cells or bone marrow-derived macrophages (BMDMs) of the indicated strain. Data represent the row z-score of log2(tpm + 1) values. b, Gene clusters identified in a. Data were subjected to Gene ontology analysis using Metascape. Data indicate the log10(p-value). c,e, Global comparison of strain-specific gene expression only in BMDMs, as in a. d,f, Metascape analysis of results from c and e, as assessed in b. Gene lists for individual clusters a, c and e are provided in Supplemental Table 1.
Extended Data Fig. 3
Extended Data Fig. 3. Principal component analysis of epigenetic datasets.
a, PCA of parental ATAC-seq data colored by strain (top) and batch (bottom). b, PCA of parental H3K27Ac ChIP-seq data colored by strain (top) and batch (bottom). c, PCA of F1 hybrid ATAC-seq and ChIP-seq data with data colored by strain and read alignment method, read alignment methods include perfectly aligned reads (pink) and perfectly aligned reads overlying mutations that discriminate between BALB/cJ and C57BL/6J (maroon). d, PCA of parental LPS treated Kupffer cells with control Kupffer cells as comparison, colored by strain (top) and batch (bottom).
Extended Data Fig. 4
Extended Data Fig. 4. Motif enrichment analyses.
HOMER de novo motif analysis of shared accessible enhancers (‘ATAC’, ATAC-seq tags > 8) shared by all 3 strains and active enhancers (‘H3K27Ac’, H3K27Ac ChIP-seq tags > 16). a, Top 15 de novo motifs enriched at accessible enhancers as determined by HOMER. b, Top 15 de novo motifs enriched at active enhancers as determined by HOMER.
Extended Data Fig. 5
Extended Data Fig. 5. Data generation for network analysis.
a, Experimental schematic for isolation of hepatic cell types from inbred strains. b, Assessment of cell isolation purity at via RNA-seq signal at cell specific gene expression loci. Hepatocytes (yellow shades), Kupffer cells (green shades), and liver sinusoidal endothelial cells (LSEC) (red shades) were sorted with <1% contamination. Hepatic stellate cell (purple shades) RNA-seq libraries displayed minor (<10%) contamination with LSECs and Kupffer cells (seen as RNA-seq signal in Clec4f and Stab1 loci). c, FACS strategy for stellate, LSEC, and Kupffer cell isolation. d, Strain-specific transcriptional variation in hepatocytes, LSECs, and Stellate cells. N = 4 samples per subgroup.
Extended Data Fig. 6
Extended Data Fig. 6. Strain- and allele-specific expression in NSG models.
a, Comparison of strain-specific gene expression in parental C57BL/6J and BALB/cJ Kupffer cells and C57BL/6J and BALB/cJ Kupffer cells isolated from NSG hosts following bone marrow transplant. Top, cis trans plot. Bottom left, MA plot showing strain-specific gene expression in the F0-NSG model. Bottom right, MA plot of F0-NSG gene expression overlaid with F0 differential genes. Dark colored genes are strain specific in parental Kupffer cells and F0-NSG Kupffer cells, while light colored genes lose strain specificity in the F0-NSG model. b, Comparison of strain-specific expression in parental C57BL/6J and BALB/cJ Kupffer cells and allelic bias in CB6F1/J Kupffer cells isolated from NSG hosts following bone marrow transplant.
Extended Data Fig. 7
Extended Data Fig. 7. Motif enrichment analyses of trans-associated data.
a, Left, HOMER known motif enrichment in BALB/cJ trans-regulated ATAC-seq peaks (y-axis) and C57BL/6J trans-regulated ATAC-seq peaks (x-axis). Right, view of highlighted region in left panel. b, Expression of selected transcription factors in C57BL/6J and BALB/cJ F0 Kupffer cells. * indicates differential expression with DESeq2 adjusted p-value < 0.05 (Wald’s test with multiple testing correction using Benjamini–Hochberg method) Exact p-values as follows: Fos 0.0017; Fosb 0.003; Jun 0.026; Junb 9.38e-9; Batf 0.047; Batf3 4.04e-10; Maf 8.15e-06; Nfkb1 0.004; Nfkb2 0.006; Rel 0.001; Relb 1.86e-6; Irf7 2.25e-5; Nr1h3 3.51e-7. c, Motif enrichment in ATAC-seq labeled enhancers associated with C57BL/6J and BALB/cJ trans genes.
Extended Data Fig. 8
Extended Data Fig. 8. Strain-specific transcriptional regulation in response to LPS.
a, Effect of LPS treatment on homeostatic strain-specific genes. Left panel shows differential expression of transcripts in LPS treated C57BL/6J and BALB/cJ Kupffer cells. Select genes that display differential expression under LPS treatment are shown in red, while genes that are non-specific are shown in black. Right panel shows parental strain-specific genes overlayed onto strain-specific expression under LPS treatment. b, Motif enrichment in strain-specific trans peaks following LPS treatment. c, De novo motif enrichment of C57BL/6J and BALB/cJ specific accessible enhancers following LPS treatment. d, De novo motif enrichment of C57BL/6J and BALB/cJ specific trans enhancers following LPS treatment. P values in c and d calculated under binomial distribution as implemented by HOMER.
Extended Data Fig. 9
Extended Data Fig. 9. Summary model.
Model of trans-regulated strain-specific Kupffer cell transcriptional networks. A majority of trans effects are controlled by the strain-specific cellular environment, while a smaller fraction of trans effects are driven by cell-intrinsic differences in pathway activity. Trans differences in pathway activity induce differential transcription factor activation and gene expression. Examples of strain-specific transcription factor motifs and downstream genes are shown for BALB/cJ and C57BL/6J Kupffer cells.

References

    1. Hindorff LA, et al. Potential etiologic and functional implications of genome-wide association loci for human diseases and traits. Proc. Natl Acad. Sci. USA. 2009;106:9362–9367. doi: 10.1073/pnas.0903103106. - DOI - PMC - PubMed
    1. Link VM, et al. Analysis of genetically diverse macrophages reveals local and domain-wide mechanisms that control transcription factor binding and runction. Cell. 2018;173:1796–1809. doi: 10.1016/j.cell.2018.04.018. - DOI - PMC - PubMed
    1. van der Veeken J, et al. Natural genetic variation reveals key features of epigenetic and transcriptional memory in virus-specific CD8 T cells. Immunity. 2019;50:1202–1217. doi: 10.1016/j.immuni.2019.03.031. - DOI - PMC - PubMed
    1. Price AL, et al. Single-tissue and cross-tissue heritability of gene expression via identity-by-descent in related or unrelated individuals. PLoS Genet. 2011;7:e1001317. doi: 10.1371/journal.pgen.1001317. - DOI - PMC - PubMed
    1. Liu X, Li YI, Pritchard JK. Trans effects on gene expression can drive omnigenic inheritance. Cell. 2019;177:1022–1034. doi: 10.1016/j.cell.2019.04.014. - DOI - PMC - PubMed