

Association of neighborhood-level sociodemographic factors with Direct-to-Consumer (DTC) distribution of COVID-19 rapid antigen tests in 5 US communities
- PMID: 37735647
- PMCID: PMC10515232
- DOI: 10.1186/s12889-023-16642-3
Association of neighborhood-level sociodemographic factors with Direct-to-Consumer (DTC) distribution of COVID-19 rapid antigen tests in 5 US communities
Abstract
Background: Many interventions for widescale distribution of rapid antigen tests for COVID-19 have utilized online, direct-to-consumer (DTC) ordering systems; however, little is known about the sociodemographic characteristics of home-test users. We aimed to characterize the patterns of online orders for rapid antigen tests and determine geospatial and temporal associations with neighborhood characteristics and community incidence of COVID-19, respectively.
Methods: This observational study analyzed online, DTC orders for rapid antigen test kits from beneficiaries of the Say Yes! Covid Test program from March to November 2021 in five communities: Louisville, Kentucky; Indianapolis, Indiana; Fulton County, Georgia; O'ahu, Hawaii; and Ann Arbor/Ypsilanti, Michigan. Using spatial autoregressive models, we assessed the geospatial associations of test kit distribution with Census block-level education, income, age, population density, and racial distribution and Census tract-level Social Vulnerability Index. Lag association analyses were used to measure the association between online rapid antigen kit orders and community-level COVID-19 incidence.
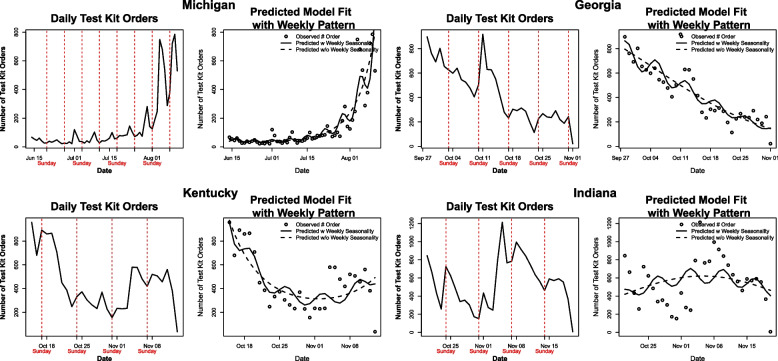
Results: In total, 164,402 DTC test kits were ordered during the intervention. Distribution of tests at all sites were significantly geospatially clustered at the block-group level (Moran's I: p < 0.001); however, education, income, age, population density, race, and social vulnerability index were inconsistently associated with test orders across sites. In Michigan, Georgia, and Kentucky, there were strong associations between same-day COVID-19 incidence and test kit orders (Michigan: r = 0.89, Georgia: r = 0.85, Kentucky: r = 0.75). The incidence of COVID-19 during the current day and the previous 6-days increased current DTC orders by 9.0 (95% CI = 1.7, 16.3), 3.0 (95% CI = 1.3, 4.6), and 6.8 (95% CI = 3.4, 10.2) in Michigan, Georgia, and Kentucky, respectively. There was no same-day or 6-day lagged correlation between test kit orders and COVID-19 incidence in Indiana.
Conclusions: Our findings suggest that online ordering is not associated with geospatial clustering based on sociodemographic characteristics. Observed temporal preferences for DTC ordering can guide public health messaging around DTC testing programs.
Keywords: COVID-19; Direct-to-consumer; Geospatial analysis; Rapid antigen tests.
© 2023. BioMed Central Ltd., part of Springer Nature.
Conflict of interest statement
VK is principal, and TS, SS, CN, and EH are employees of health care technology company CareEvolution. DDM reports consulting and research grants from Bristol-Myers Squibb and Pfizer, consulting and research support from Fitbit, consulting, and research support from Flexcon, research grant from Boehringer Ingelheim, consulting from Avania, non-financial research support from Apple Computer, consulting/other support from Heart Rhythm Society. All other authors declare no competing interests.
Figures


References
Publication types
MeSH terms
Grants and funding
LinkOut - more resources
Full Text Sources
Medical
