

Integrating single-nucleus sequence profiling to reveal the transcriptional dynamics of Alzheimer's disease, Parkinson's disease, and multiple sclerosis
- PMID: 37735671
- PMCID: PMC10515258
- DOI: 10.1186/s12967-023-04516-6
Integrating single-nucleus sequence profiling to reveal the transcriptional dynamics of Alzheimer's disease, Parkinson's disease, and multiple sclerosis
Abstract
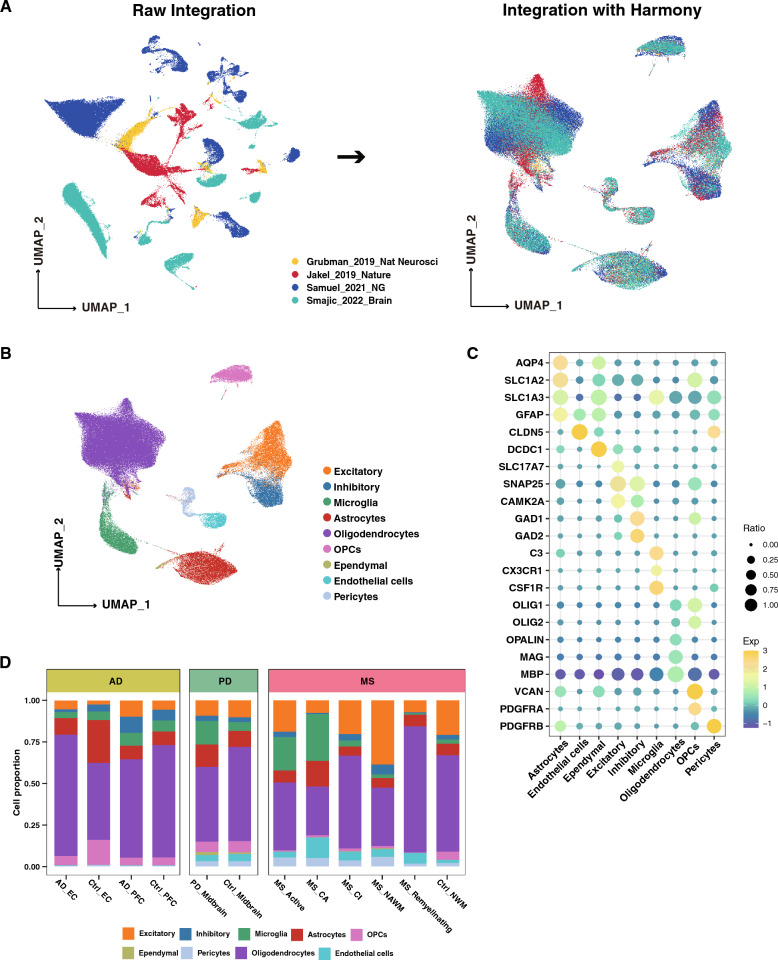
Background: Alzheimer's disease (AD), Parkinson's disease (PD), and multiple sclerosis (MS) are three nervous system diseases that partially overlap clinically and genetically. However, bulk RNA-sequencing did not accurately detect the core pathogenic molecules in them. The availability of high-quality single cell RNA-sequencing data of post-mortem brain collections permits the generation of a large-scale gene expression in different cells in human brain, focusing on the molecular features and relationships between diseases and genes. We integrated single-nucleus RNA-sequencing (snRNA-seq) datasets of human brains with AD, PD, and MS to identify transcriptomic commonalities and distinctions among them.
Methods: The snRNA-seq datasets were downloaded from Gene Expression Omnibus (GEO) database. The Seurat package was used for snRNA-seq data processing. The uniform manifold approximation and projection (UMAP) were utilized for cluster identification. The FindMarker function in Seurat was used to identify the differently expressed genes. Functional enrichment analysis was carried out using the Gene Set Enrichment Analysis (GSEA) and Gene ontology (GO). The protein-protein interaction (PPI) analysis of differentially expressed genes (DEGs) was analyzed using STRING database ( http://string-db.org ). SCENIC analysis was performed using utilizing pySCENIC (v0.10.0) based on the hg19-tss-centered-10 kb-10species databases. The analysis of potential therapeutic drugs was analyzed on Connectivity Map ( https://clue.io ).
Results: The gene regulatory network analysis identified several hub genes regulated in AD, PD, and MS, in which HSPB1 and HSPA1A were key molecules. These upregulated HSP family genes interact with ribosome genes in AD and MS, and with immunomodulatory genes in PD. We further identified several transcriptional regulators (SPI1, CEBPA, TFE3, GRHPR, and TP53) of the hub genes, which has important implications for uncovering the molecular crosstalk among AD, PD, and MS. Arctigenin was identified as a potential therapeutic drug for AD, PD, and MS.
Conclusions: Together, the integrated snRNA-seq data and findings have significant implications for unraveling the shared and unique molecular crosstalk among AD, PD, and MS. HSPB1 and HSPA1A as promising targets involved in the pathological mechanisms of neurodegenerative diseases. Additionally, the identification of arctigenin as a potential therapeutic drug for AD, PD, and MS further highlights its potential in treating these neurological disorders. These discoveries lay the groundwork for future research and interventions to enhance our understanding and treatment of AD, PD, and MS.
Keywords: Alzheimer’s diseases; Arctigenin; Crosstalk; HSPA1A; HSPB1; Multiple sclerosis; Parkinson’s disease; Ribosomal proteins; Single-cell sequence.
© 2023. BioMed Central Ltd., part of Springer Nature.
Conflict of interest statement
No authors had conflicts of interests relevant to this study.
Figures


References
-
- Nebes RD, Halligan EM, Rosen J, Reynolds CF., 3rd Cognitive and motor slowing in Alzheimer's disease and geriatric depression. J Int Neuropsychol Soc. 1998;4(5):426–434. - PubMed
-
- Oertel W, Schulz JB. Current and experimental treatments of Parkinson disease: a guide for neuroscientists. J Neurochem. 2016;139(Suppl 1):325–337. - PubMed
-
- Longoni G, Rocca MA, Pagani E, Riccitelli GC, Colombo B, Rodegher M, Falini A, Comi G, Filippi M. Deficits in memory and visuospatial learning correlate with regional hippocampal atrophy in MS. Brain Struct Funct. 2015;220(1):435–444. - PubMed
Publication types
MeSH terms
Substances
LinkOut - more resources
Full Text Sources
Medical
Research Materials
Miscellaneous
