. 2023 Sep 21;11(1):208.
doi: 10.1186/s40168-023-01637-4.

Reducing gut microbiome-driven adipose tissue inflammation alleviates metabolic syndrome

Affiliations

Reducing gut microbiome-driven adipose tissue inflammation alleviates metabolic syndrome

N K Newman et al. Microbiome. .

Abstract

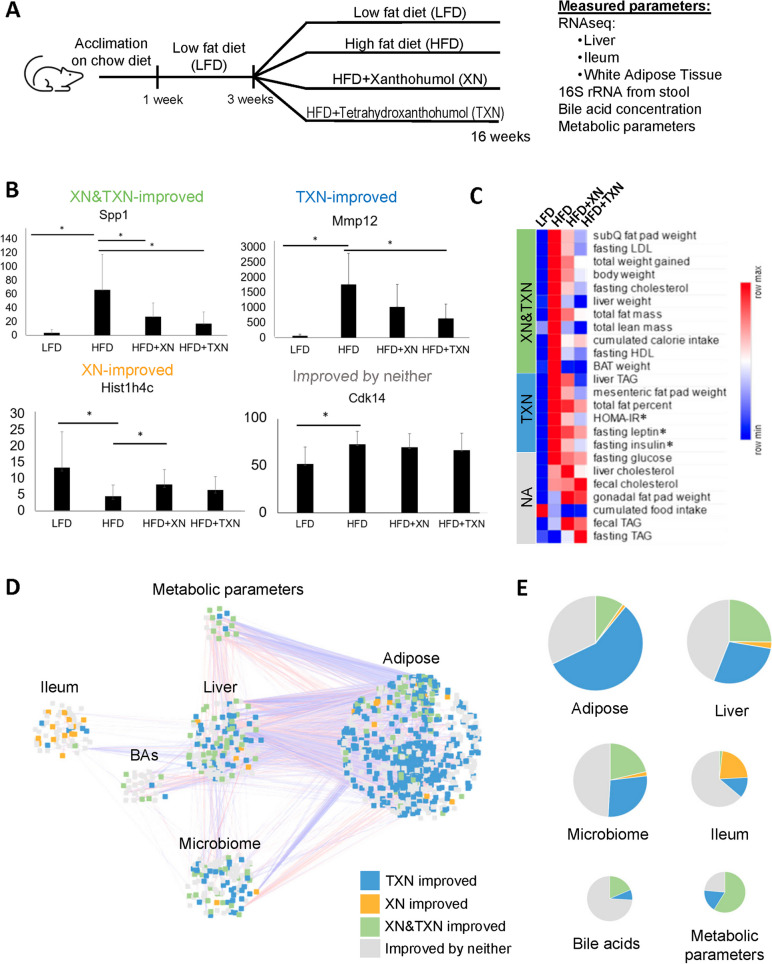
Background: The gut microbiota contributes to macrophage-mediated inflammation in adipose tissue with consumption of an obesogenic diet, thus driving the development of metabolic syndrome. There is a need to identify and develop interventions that abrogate this condition. The hops-derived prenylated flavonoid xanthohumol (XN) and its semi-synthetic derivative tetrahydroxanthohumol (TXN) attenuate high-fat diet-induced obesity, hepatosteatosis, and metabolic syndrome in C57Bl/6J mice. This coincides with a decrease in pro-inflammatory gene expression in the gut and adipose tissue, together with alterations in the gut microbiota and bile acid composition.

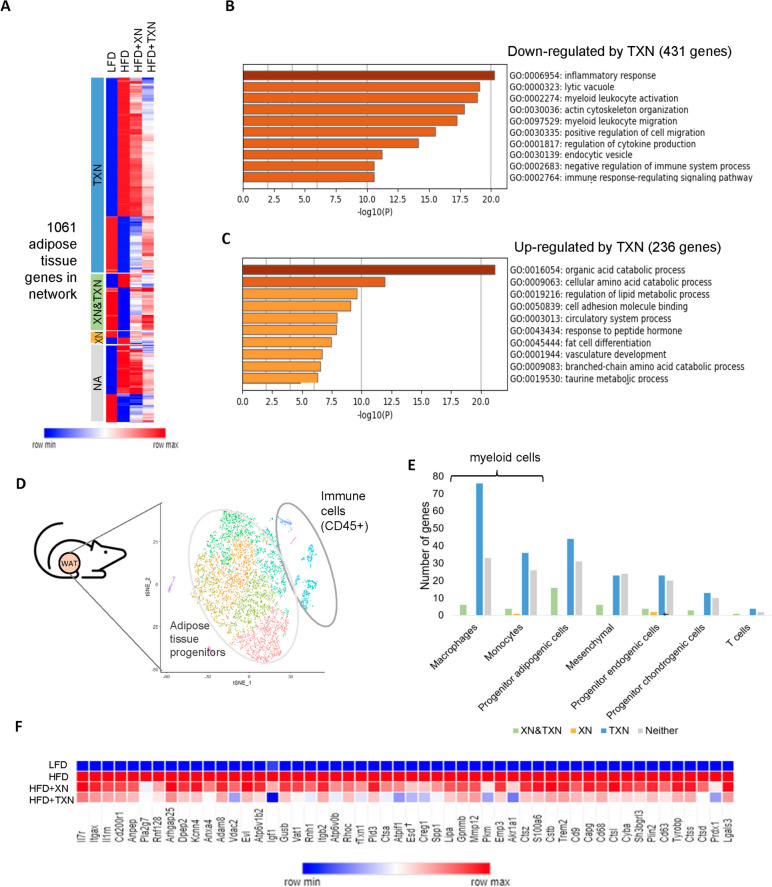
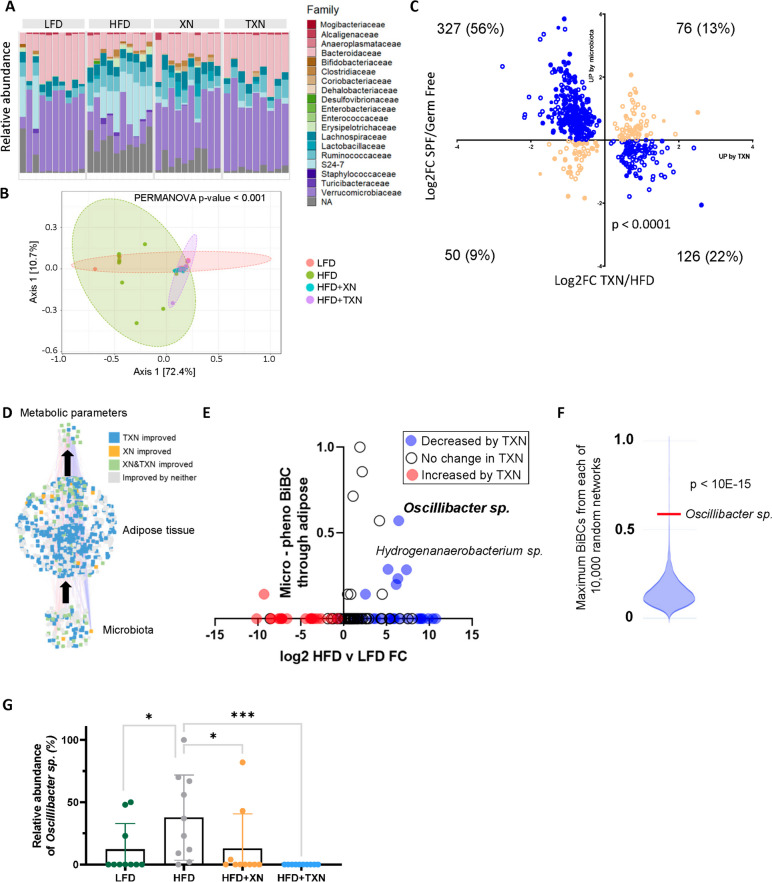
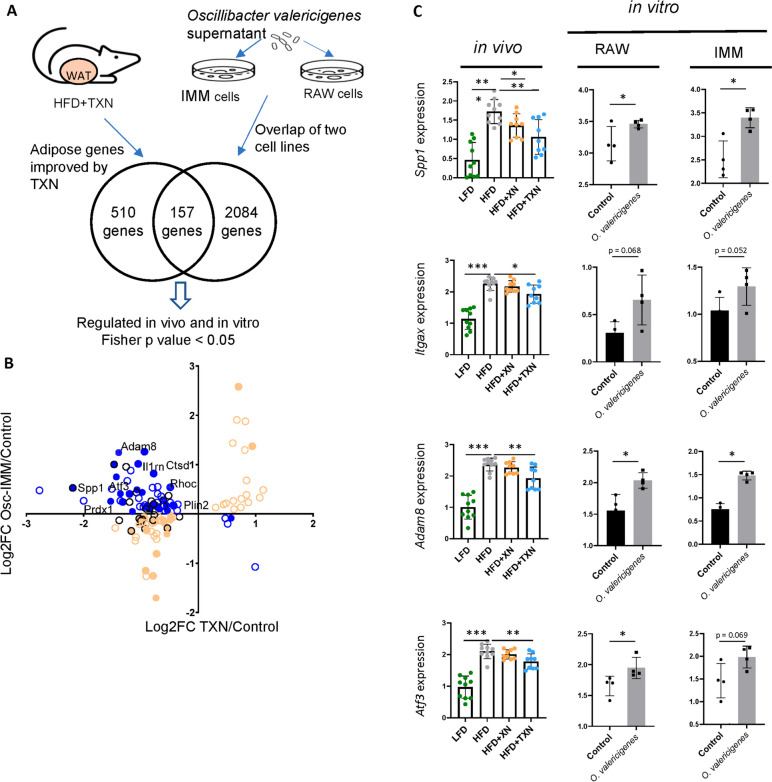
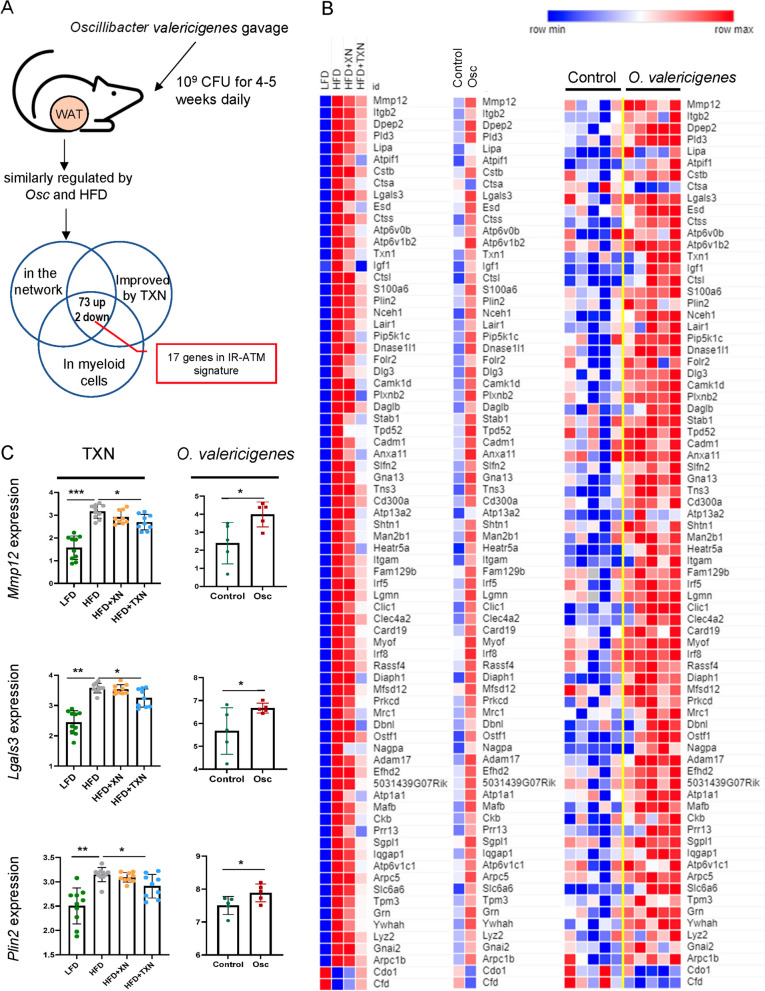
Results: In this study, we integrated and interrogated multi-omics data from different organs with fecal 16S rRNA sequences and systemic metabolic phenotypic data using a Transkingdom Network Analysis. By incorporating cell type information from single-cell RNA-seq data, we discovered TXN attenuates macrophage inflammatory processes in adipose tissue. TXN treatment also reduced levels of inflammation-inducing microbes, such as Oscillibacter valericigenes, that lead to adverse metabolic phenotypes. Furthermore, in vitro validation in macrophage cell lines and in vivo mouse supplementation showed addition of O. valericigenes supernatant induced the expression of metabolic macrophage signature genes that are downregulated by TXN in vivo.

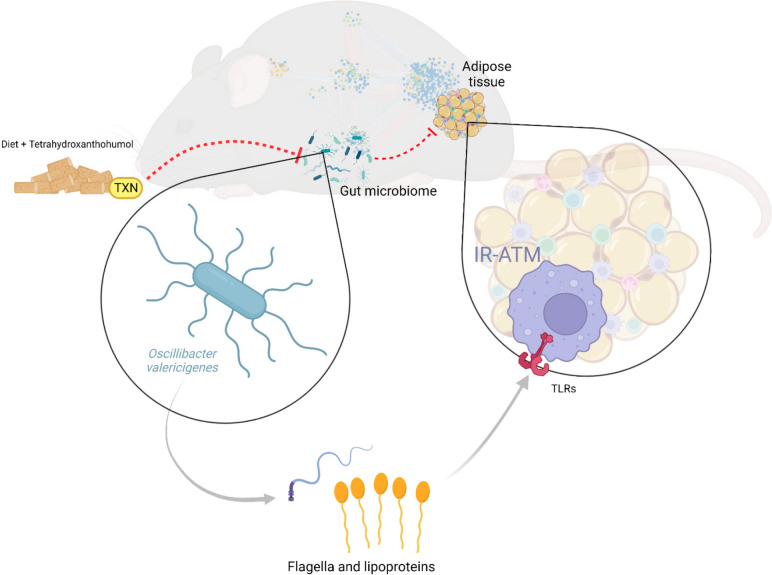
Conclusions: Our findings establish an important mechanism by which TXN mitigates adverse phenotypic outcomes of diet-induced obesity and metabolic syndrome. TXN primarily reduces the abundance of pro-inflammatory gut microbes that can otherwise promote macrophage-associated inflammation in white adipose tissue. Video Abstract.


Conflict of interest statement

The authors declare that they have no competing interests.

Figures

Fig. 1
Fig. 1
TXN has major effects on gene expression in white adipose tissue. A Overview of the mouse experiments, duration, and measurements. The study contained three treatment groups: low fat control diet (LFD), high fat diet (HFD), high fat diet with XN supplementation (HFD+XN), and high fat diet with TXN supplementation (HFD+TXN). Phenotypic parameters, fecal bile acid composition, fecal 16S rRNA gene sequences, and tissue transcriptomes were determined. B Each parameter was categorized into one of four different groups (XN-improved, TXN-improved, XN&TXN-improved, improved by neither). Shown here is an example of the expression of one gene from each category, with values in quantile normalized counts per million (CPM). C The majority of measured phenotypes (especially those related to glucose homeostasis and adiposity) are reduced by TXN in an opposite way to the direction of change in the HFD group versus LFD (Mann–Whitney P < 0.05, * = Mann–Whitney P < 0.05 in HFD and < 0.1 in TXN). Colors represent the average of median normalized values of each group, relative to the other groups in the row (e.g., the darkest blue color indicates the lowest mean while dark red indicates the highest). D A transkingdom multi-organ network was reconstructed. Nodes in the network represent features that are significantly changed between HFD and LFD. Edges represent Spearman correlations between parameters (red is a positive association, blue is negative). Nodes are colored based on the treatment effect category as described in the Fig. 1B examples. E The proportion of parameters in each treatment effect category described in Fig. 1D. Size of the pie chart corresponds to the number of nodes for each data type in the network
Fig. 2
Fig. 2
Inflammatory processes in adipose tissue are the primary processes affected by TXN. A Heatmap representing expression of each gene in the adipose tissue subnetwork across all treatment groups. Colors represent the quantile normalized log2(CPM+1) mean of each group, relative to the other groups in the row (e.g., the darkest blue color indicates the lowest mean while dark red indicates the highest). B Metascape functional enrichment of genes downregulated by TXN showing enrichment for inflammatory processes. C Genes up regulated by TXN are enriched for metabolic pathways. D The t-SNE plot shows adipose tissue from high fat high sugar diet fed mice (n = 5 mice, with 9383 pooled number of cells after preprocessing for quality [Additional file 1]). E The number of genes belonging to each cell-type assignment in the adipose tissue subnetwork. TXN improves gene expression primarily in the myeloid cell population. F Adipose tissue network genes improved by TXN treatment in the IR-ATM gene signature are shown. Dagger symbol indicates not significant change. Colors represent values calculated in the same way as in A
Fig. 3
Fig. 3
Identification of regulatory microbes causing the inflammatory response. A Family level relative abundance plots of microbes across the different treatment groups. B PCoA plot of microbiota based on treatment group. C The microbiota-dependent up- and down-regulated genes present in adipose tissue and improved by TXN treatment. The x-axis represents log2 fold change TXN/HFD and y-axis represents log2 fold change SPF/germ-free mice. Blue circles indicate genes whose expression was improved by TXN treatment and microbiota-dependent. Orange circles indicate no reversal in expression direction. The filled circles were assigned to myeloid cells (two-sided Fisher’s exact test, p-value < 0.0001). D The subnetwork derived from the original network to identify regulatory microbes that affect the host phenotypes by acting through adipose tissue. E BiBC between microbes and phenotypes indicates Oscillibacter sp. and Hydrogenanaerobacterium sp. as two regulatory microbes whose levels are both reduced by TXN treatment. F An analysis of 10,000 random networks with the same number of nodes and edges as the observed network revealed that the observed BiBC for Oscillibacter sp. was much higher than due to chance (p-value < 10E-15, one-sample Wilcoxon test). G The abundance of ASV_61 (identified as Oscillibacter sp.) in each treatment group. Brackets indicate the results for specific comparisons. Values are in normalized counts per million. Two-tailed Mann–Whitney p-values are shown; *p-value ≤ 0.05; ****p-value ≤ 0.0001
Fig. 4
Fig. 4
O. valericigenes treatment of macrophage cell line increases the expression of IR-ATM genes whose expression was improved by TXN in vivo. A Treatment of macrophage cell lines IMM and RAW 264.7 with O. valericigenes regulated expression of 2241 genes (one-sided Fisher’s exact test; FDR-adjusted p-value < 0.05), of which 157 were reversed by TXN treatment in the adipose tissue of mice fed HFD (HFD+TXN). B The XY-plot shows genes significantly improved by TXN treatment in vivo with concordant regulation in both macrophage cell lines (individual comparison p-value < 0.1). Blue circles indicate those genes that were improved by TXN treatment and were microbiota-dependent. Orange circles indicate no change in expression direction. The filled circles indicate those genes assigned to myeloid cells. The black circles indicate IR-ATM signature genes (one-sided Fisher’s test, p-value < 0.05). C Expression of representative genes decreased by TXN treatment in the adipose tissue in vivo and increased with O. valericigenes treatment in vitro. Values are normalized counts per million. *Mann–Whitney p-value < 0.05; **p-value < 0.01; ***p-value < 0.001
Fig. 5
Fig. 5
O. valericigenes treatment increases the expression of IR-ATM genes in mouse white adipose tissue that are improved by TXN treatment. A Outline of O. valericigenes experiment and subsequent gene expression analysis from WAT (n = 5 per group). The Venn diagram shows 75 genes from myeloid cells overlapping between similar effects of HFD and O. valericigenes with opposite effects of TXN. WAT genes from the network in Fig. 1D. B Expression of adipose tissue genes increased by HFD and decreased by TXN treatment in mice (left panel) vs the same adipose tissue genes following O. valericigenes supplementation of mice (right panel). The middle panel shows the mean of the samples in the right panel. Colors represent the quantile normalized log2(CPM+1) mean of each group, relative to the other groups in the row (e.g., the darkest blue color indicates the lowest mean while dark red indicates the highest). C Comparison of in vivo adipose tissue gene expression in two sets of experiments. One experiment used varying diets (low fat diet and high fat diet) and interventions (XN and TXN treatment) while the other used only a normal chow diet with or without O. valericigenes supplementation. Shown are examples of adipose tissue genes (in the IR-ATM signature) decreased by TXN treatment but induced by O. valericigenes (Osc) supplementation in vivo. Values are in normalized counts per million. *Mann–Whitney p-value < 0.05; **p-value < 0.01; ***p-value < 0.001
Fig. 6
Fig. 6
Summary figure. Consumption of TXN affects the composition of the gut microbial community, reducing Oscillibacter spp. (known to produce TLR agonists such as flagellin and lipoproteins), which in turn leads to a reduction of metabolically damaging insulin resistance associated adipose tissue macrophages (IR-ATMs)

Similar articles

Cited by

References

    1. Belete R, Ataro Z, Abdu A, Sheleme M. Global prevalence of metabolic syndrome among patients with type I diabetes mellitus: a systematic review and meta-analysis. Diabetol Metab Syndr. 2021;13(1):25. doi: 10.1186/s13098-021-00641-8. - DOI - PMC - PubMed
    1. Eslam M, Sanyal AJ, George J, International Consensus P MAFLD: a consensus-driven proposed nomenclature for metabolic associated fatty liver disease. Gastroenterology. 2020;158(7):1999–2014.e1991. doi: 10.1053/j.gastro.2019.11.312. - DOI - PubMed
    1. Fouad Y, Elwakil R, Elsahhar M, Said E, Bazeed S, Ali Gomaa A, Hashim A, Kamal E, Mehrez M, Attia D. The NAFLD-MAFLD debate: eminence vs evidence. Liver Int. 2021;41(2):255–260. doi: 10.1111/liv.14739. - DOI - PubMed
    1. Nucera S, Ruga S, Cardamone A, Coppoletta AR, Guarnieri L, Zito MC, Bosco F, Macrì R, Scarano F, Scicchitano M, et al. MAFLD progression contributes to altered thalamus metabolism and brain structure. Sci Rep. 2022;12(1):1207. doi: 10.1038/s41598-022-05228-5. - DOI - PMC - PubMed
    1. Pérez-Muñoz EP, Antunes-Ricardo M, Martínez-Ávila M, Guajardo-Flores D. Eryngium species as a potential ally for treating metabolic syndrome and diabetes. Front Nutr. 2022;9:878306. doi: 10.3389/fnut.2022.878306. - DOI - PMC - PubMed

Publication types

Substances