. 2023 Oct;29(10):2065-2072.
doi: 10.3201/eid2910.230824.

Stability of Monkeypox Virus in Body Fluids and Wastewater

Stability of Monkeypox Virus in Body Fluids and Wastewater

Claude Kwe Yinda et al. Emerg Infect Dis. 2023 Oct.

Abstract

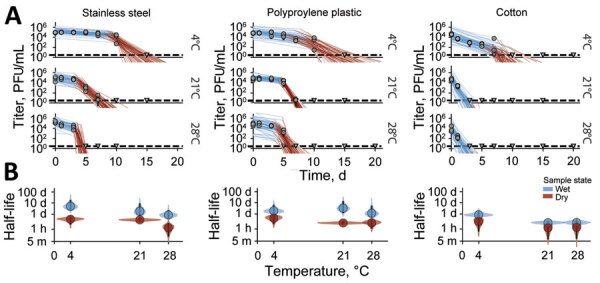
An outbreak of human mpox infection in nonendemic countries appears to have been driven largely by transmission through body fluids or skin-to-skin contact during sexual activity. We evaluated the stability of monkeypox virus (MPXV) in different environments and specific body fluids and tested the effectiveness of decontamination methodologies. MPXV decayed faster at higher temperatures, and rates varied considerably depending on the medium in which virus was suspended, both in solution and on surfaces. More proteinaceous fluids supported greater persistence. Chlorination was an effective decontamination technique, but only at higher concentrations. Wastewater was more difficult to decontaminate than plain deionized water; testing for infectious MPXV could be a helpful addition to PCR-based wastewater surveillance when high levels of viral DNA are detected. Our findings suggest that, because virus stability is sufficient to support environmental MPXV transmission in healthcare settings, exposure and dose-response will be limiting factors for those transmission routes.

Keywords: United States; body fluids; human monkeypox virus; mpox; sexually transmitted infections; surfaces; virus stability; viruses.


Figures

Figure 1
Figure 1
Monkeypox virus decay on cotton, polypropylene, and stainless steel under different environmental conditions. A) Regression lines showing predicted exponential decay of virus titers over time compared with measured (directly inferred) virus titers. Points show posterior median of measured titers; black lines show 95% credible intervals. Colored lines indicate random draws from the joint posterior distribution of exponential decay rate (negative of the slope) and intercept (initial virus titer), visualizing range of possible decay patterns for each experimental condition. Blue lines show virus titers during the inferred wet phase, when residual moisture remains visible on the surface; red lines show virus titers during the inferred dry phase, when evaporation has reached a state of quasi-equilibrium. The exact breakpoint was inferred from the data with a previous measurement from the last day of observable liquid. B) Inferred virus half-lives by surface and temperature condition. Dots show the posterior median half-life estimate and black lines show 68% (thick) and 95% (thin) credible intervals. Violin plots show the shape of posterior distribution. Blue show inferred virus half-lives on surfaces during wet phase and red on surfaces during dry phase.
Figure 2
Figure 2
Monkeypox virus decay in human blood, semen, serum, saliva, urine, and feces solutions deposited on surfaces. A) Regression lines showing predicted exponential decay of virus titers over time compared with measured (directly inferred) virus titers. Points show posterior median measured titers; black lines show 95% credible intervals. Colored lines indicate random draws from joint posterior distribution of exponential decay rate (negative of the slope) and intercept (initial virus titer), visualizing range of possible decay patterns for each experimental condition. Top row shows experiments in bulk solution (liquid); bottom row shows experiments on surfaces. For surface experiments, light blue lines show the inferred titers during the wet phase, when visible residual moisture remains on the surface; red lines show the inferred dry phase, when evaporation has reached a state of quasi-equilibrium. The exact breakpoint was inferred from the data with a previous measurement from the last day of observable liquid. B) Inferred virus half-lives by condition and state. Dots show the posterior median half-life estimate and black lines show 68% (thick) and 95% (thin) credible intervals. Violin plots show the shape of posterior distribution. Dark blue show inferred virus half-lives in bulk solution, light blue on surfaces during wet phase, and red on surfaces during dry phase.
Figure 3
Figure 3
Monkeypox virus decay in different human serum dilutions in Dulbecco modified Eagle medium. A) Regression lines showing predicted exponential decay of virus titers over time compared with measured (directly inferred) virus titers. Points show posterior median measured titers; black lines show 95% credible intervals. Colored lines indicate random draws from joint posterior distribution of the exponential decay rate (negative of the slope) and intercept (initial virus titer), visualizing range of possible decay patterns for each experimental condition. B) Inferred virus half-lives by condition and state. Dots show posterior median half-life estimate and black lines show 68% (thick) and 95% (thin) credible intervals. Violin plots show the shape of posterior distribution of virus half-lives.
Figure 4
Figure 4
Monkeypox virus exponential decay and decontamination in wastewater and DI water. A) Regression lines showing predicted exponential decay of virus titer over time compared with measured (directly inferred) virus titers. Points show posterior median measured titers; black lines show 95% exponential decay rate (negative of the slope) and intercept (initial virus titer), visualizing range of possible decay patterns for each experimental condition. B) Inferred virus half-lives as a function of free chlorine concentration in parts per million. Violin plots show the shape of the posterior distribution of virus half-lives. Dots show credible intervals for posterior median half-life estimates and black lines show 68% (thick) and 95% (thin) credible intervals. Violin plots show the shape of posterior distribution. Dark blue show inferred virus half-lives in DI water and red in wastewater. DI, deionized; ppms, parts per million.

References

    1. Mwanbal PT, Tshioko KF, Moudi A, Mukinda V, Mwema GN, Messinger D, et al. Human monkeypox in Kasai Oriental, Zaire (1996-1997). Euro Surveill. 1997;2:33–5. 10.2807/esm.02.05.00161-en - DOI - PubMed
    1. Nalca A, Rimoin AW, Bavari S, Whitehouse CA. Reemergence of monkeypox: prevalence, diagnostics, and countermeasures. Clin Infect Dis. 2005;41:1765–71. 10.1086/498155 - DOI - PubMed
    1. Curaudeau M, Besombes C, Nakouné E, Fontanet A, Gessain A, Hassanin A. Identifying the most probable mammal reservoir hosts for monkeypox virus based on ecological niche comparisons. Viruses. 2023;15:727. 10.3390/v15030727 - DOI - PMC - PubMed
    1. World Health Organization. Multi-country monkeypox outbreak: situation update [cited 2022 Jun 1]. https://www.who.int/emergencies/disease-outbreak-news/item/2022-DON396.
    1. Rimoin AW, Mulembakani PM, Johnston SC, Lloyd Smith JO, Kisalu NK, Kinkela TL, et al. Major increase in human monkeypox incidence 30 years after smallpox vaccination campaigns cease in the Democratic Republic of Congo. Proc Natl Acad Sci U S A. 2010;107:16262–7. 10.1073/pnas.1005769107 - DOI - PMC - PubMed

Publication types