. 2023 Nov 1;31(11):3193-3209.
doi: 10.1016/j.ymthe.2023.09.010. Epub 2023 Sep 20.

CXCR4-modified CAR-T cells suppresses MDSCs recruitment via STAT3/NF-κB/SDF-1α axis to enhance efficacy against pancreatic cancer

Affiliations

CXCR4-modified CAR-T cells suppresses MDSCs recruitment via STAT3/NF-κB/SDF-1α axis to enhance efficacy against pancreatic cancer

Ruixin Sun et al. Mol Ther. .

Abstract

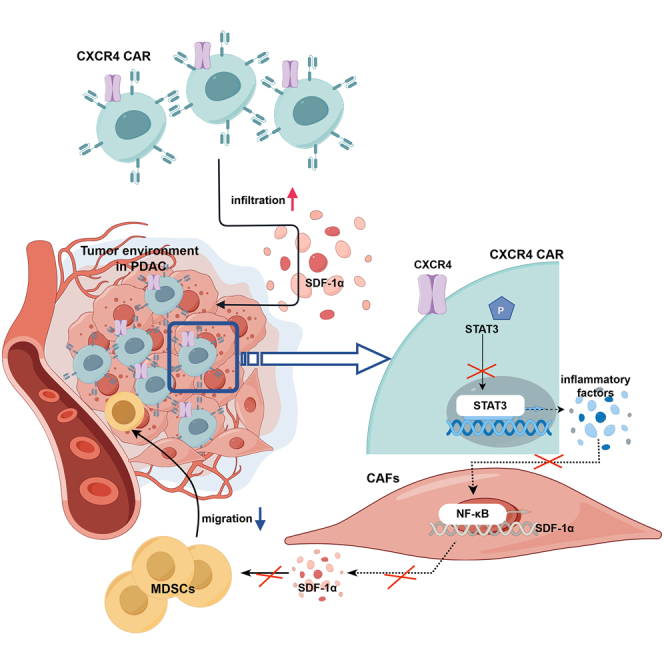
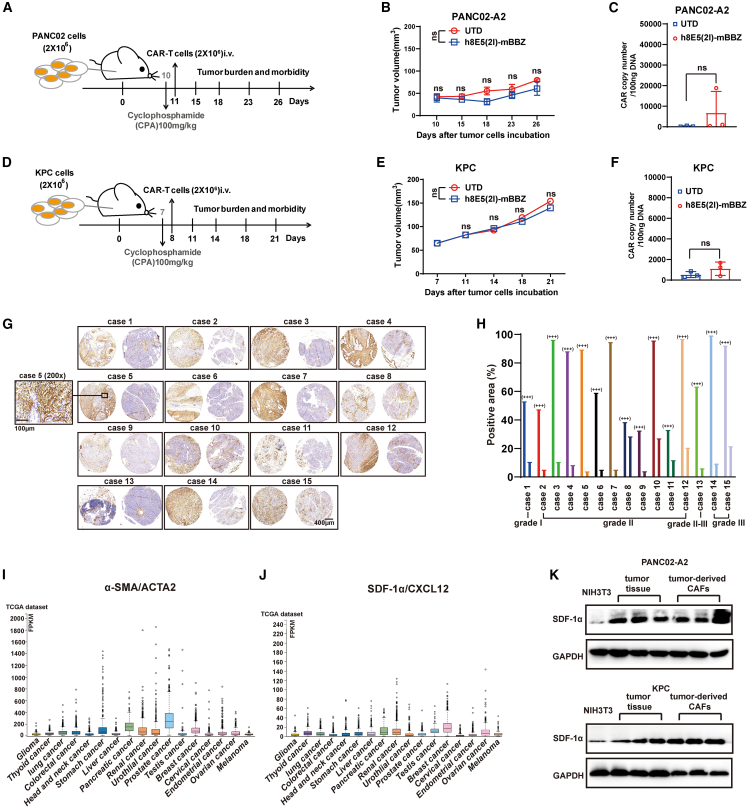
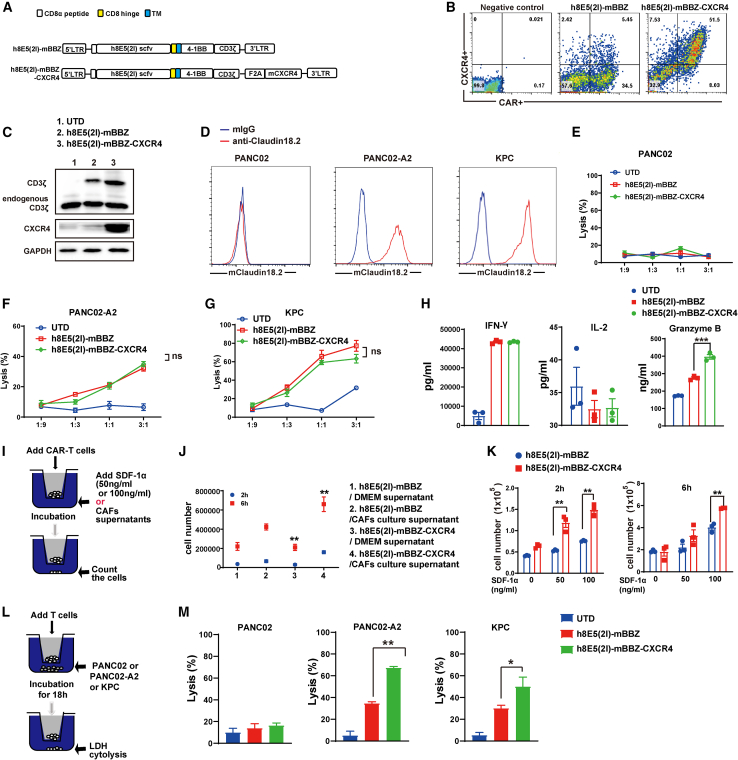
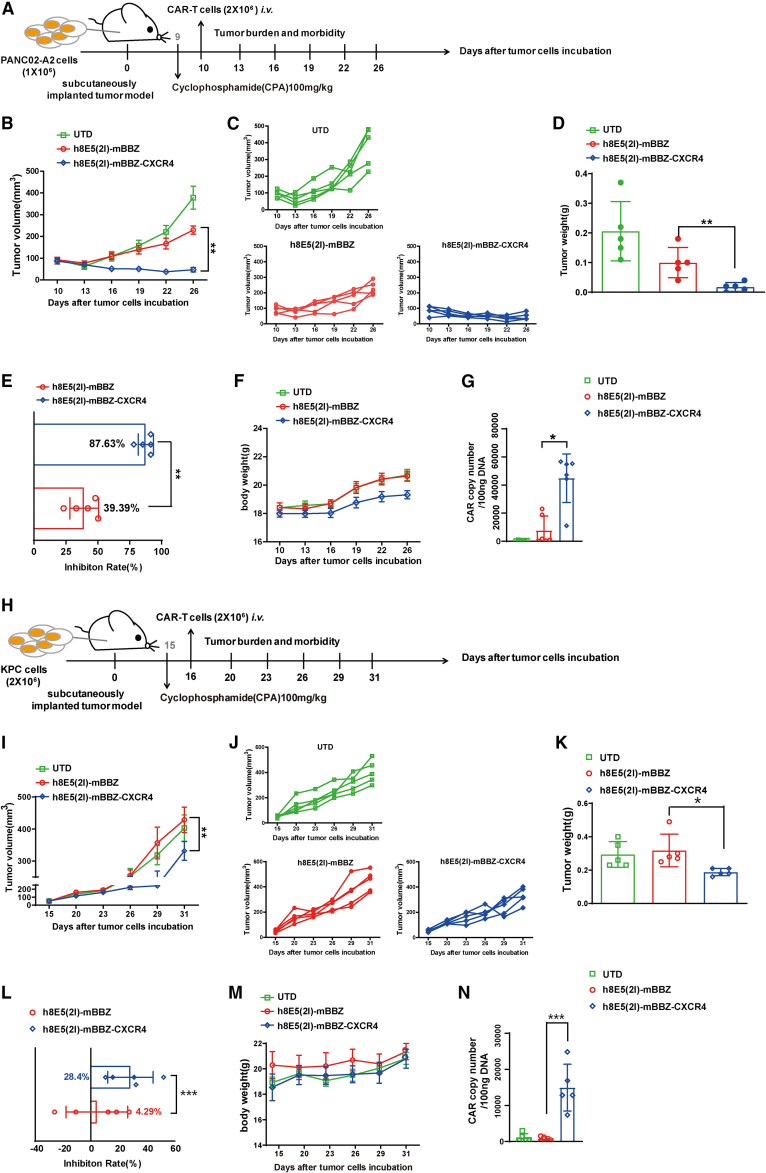
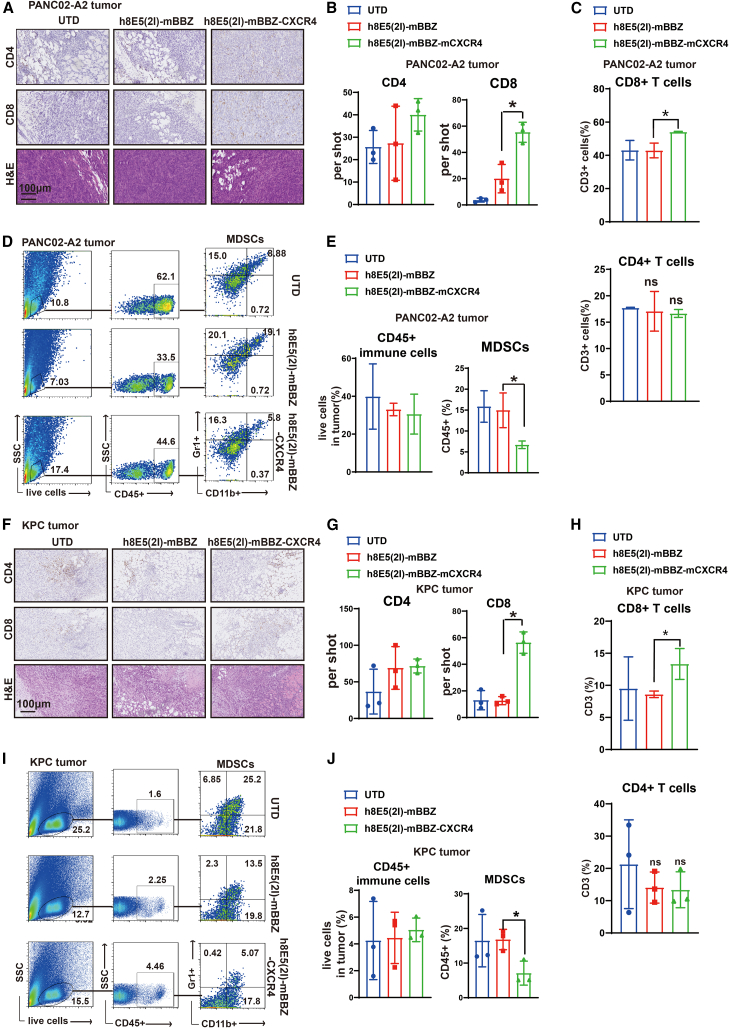
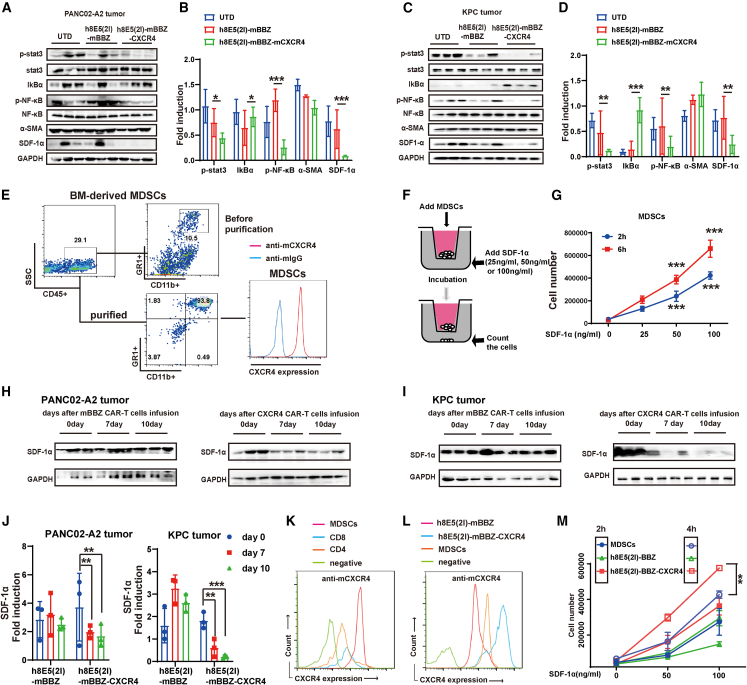
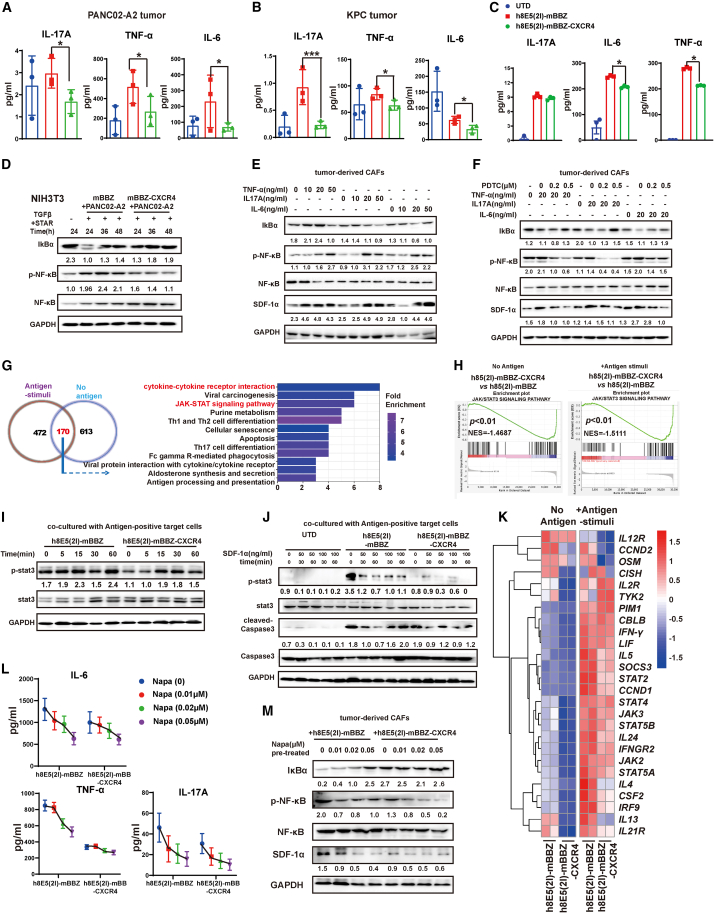
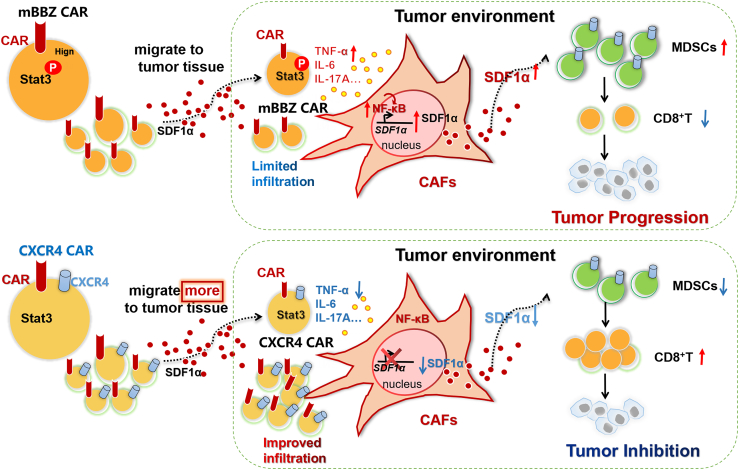
Claudin18.2 (CLDN18.2)-specific chimeric antigen receptor (CAR-T) cells displayed limited efficacy in CLDN18.2-positive pancreatic ductal adenocarcinoma (PDAC). Strategies are needed to improve the trafficking capacity of CLDN18.2-specific CAR-T cells. PDAC has a unique microenvironment that consists of abundant cancer-associated fibroblasts (CAFs), which could secrete stromal cell-derived factor 1α (SDF-1α), the ligand of CXCR4. Then, we constructed and explored CLDN18.2-targeted CAR-T cells with CXCR4 co-expression in treating immunocompetent mouse models of PDAC. The results indicated that CXCR4 could promote the infiltration of CAR-T cells and enhance their efficacy in vivo. Mechanistically, the activation of signal transducer and activator of transcription 3 (STAT3) signaling was impaired in CXCR4 CAR-T cells, which reduced the release of inflammatory factors, such as tumor necrosis factor-α, IL-6, and IL-17A. Then, the lower release of inflammatory factors suppressed SDF-1α secretion in CAFs via the nuclear factor κB (NF-κB) pathway. Therefore, the decreased secretion of SDF-1α in feedback decreased the migration of myeloid-derived suppressor cells (MDSCs) in tumor sites. Overall, our study demonstrated that CXCR4 CAR-T cells could traffic more into tumor sites and also suppress MDSC migration via the STAT3/NF-κB/SDF-1α axis to obtain better efficacy in treating CLDN18.2-positive pancreatic cancer. Our findings provide a theoretical rationale for CXCR4 CAR-T cell therapy in PDAC.

Keywords: CAFs; CAR-T cells; MDSCs; PDAC; SDF-1α; cancer-associated fibroblasts; chimeric antigen receptor; myeloid-derived suppressor cells; pancreatic ductal adenocarcinoma; stromal cell-derived factor 1α.


Conflict of interest statement

Declaration of interests H.J. and Z.L. have ownership interests of CAR-T cells relating to this work and are stockholders in CARsgen Therapeutics.

Figures

None
Graphical abstract
Figure 1
Figure 1
Large amounts of CAFs existing in tumor tissue of pancreatic cancer In vivo experimental of (A–C) PANC02-A2 and (d–f) KPC allografts. (A, D) Experimental scheme of in vivo anti-tumor experiment under lympho depletion condition. C57BL/6 mice were inoculated subcutaneously with PANC02-A2 cells, and treated by intraperitoneal injection with CPA and then given CAR-T cells (intravenously). C57BL/6 mice: age 4–6 weeks, female, n = 5 mice per group. (B and E) The tumor volume of tumors of each treatment group. (C and F) CAR copy number in genomic DNA of residual tumors after CAR-T cells therapy was measured by RT-qPCR (TaqMan probe). (G) IHC staining of α-SMA protein expression in the representative pancreatic cancer samples. Scale bars, 400 μm or 100 μm. (H) The statistical results of the positive area and intensity of IHC staining of α-SMA protein expression in the site of cancer or para cancer. (I and J) The Cancer Genome Atlas analysis of the (I) α-SMA/ACTA2 and (J) SDF-1α/CXCL12 expression in different tumor types. (K) Western blot of SDF-1α expression in NIH3T3 cells, tumor tissues and tumor-derived CAFs. Glyceraldehyde 3-phosphate dehydrogenase (GAPDH) served as a loading control.
Figure 2
Figure 2
Generation of mBBZ CARs co-expressing CXCR4 (A) Schematic representation of the modular composition of CLDN18.2-targeted conventional and CXCR4 CAR. This construct includes an extracellular region of antigen recognition, a transmembrane domain, an intracellular region of mouse 4-1BB costimulatory molecules, and a mouse CD3-ζ chain. (B) The transduction efficiency and CXCR4 expression of mBBZ and CXCR4 CAR-T cells on splenic T cells derived from C57BL/6 was determined by flow cytometry. Untreated T cells served as negative controls. (C) Western blot of CD3-ζ and CXCR4 expression in CAR-T cells. Glyceraldehyde 3-phosphate dehydrogenase (GAPDH) served as a loading control. (D) The expression of CLDN18.2 on PANC02, PANC02-A2. and KPC cells. Cells incubated with a mouse anti-mouse IgG antibody as negative control. (E–G) CAR-T cells were co-incubated with the CLDN18.2-negative or CLDN18.2-positive target cells at varying E:T ratios for 18 h. Cell lysis was tested using a standard nonradioactive cytotoxicity assay. (H) CAR-T cells were co-cultured with antigen-positive cells at a ratio of 1:1 for 48 h. IFN-γ, IL-2, and granzyme B in co-culture supernatants were quantified by ELISA assays (n = 3). (I) Transwell co-culture of CAR-T cells with cell culture supernatant of CAFs or SDF-1α. (J) CAR-T cells were added to the upper chamber and the cell culture supernatant of CAFs was added in the lower chamber. The cell number in the lower chamber was counted at 2 and 6 h. (K) CAR-T cells were added to the upper chamber, and 0, 50, or 100 ng/mL SDF-1α was added in the lower chamber. The cell number in the lower chamber was counted at 2 h and 6 h. (L) Transwell co-culture and LDH release tests of CAR-T cells in the upper chamber with tumor cells in the lower chamber. (M) The LDH release in the lower chamber was tested at 18 h. All data are presented as the mean ± SEM of triplicate experiments. ∗∗p < 0.01.
Figure 3
Figure 3
CXCR4 enhanced anti-tumor effect of CAR-T cells in pancreatic cancer (A–G) In vivo experimental of PANC02-A2 allografts. (A) Experimental scheme of in vivo antitumor experiment under lymph depletion condition. C57BL/6 mice were inoculated subcutaneously with PANC02-A2 cells and treated with intraperitoneal injection with CPA and then given CAR-T cells intravenously. (B and C) The tumor volume of tumors of each treatment group. (d) The tumor weight at the endpoint of the animal experiment. (E) The tumor growth inhibition of each treatment group. (F) The body weight of each treatment group. (G) CAR copy number in genomic DNA of residual tumors after CAR-T cells therapy was measured by RT-qPCR (TaqMan probe). (H–N) In vivo experiment with KPC allografts. (H) Experimental scheme of in vivo antitumor experiment under lymph depletion condition. C57BL/6 mice were inoculated subcutaneously with KPC cells, and treated by intraperitoneal injection with CPA and then given CAR-T cells intravenously. (I and J) The tumor volume of tumors of each treatment group. (K) The tumor weight at the endpoint of the animal experiment. (L) The tumor growth inhibition of each treatment group. (M) The body weight of each treatment group. (N) CAR copy number in genomic DNA of residual tumors after CAR-T cells therapy was measured by RT-qPCR (TaqMan probe). C57BL/6 mice: age 4–6 weeks, female, n = 5 mice per group. All data are presented as the mean ± SEM of triplicate experiments. ∗p < 0.05, ∗∗p < 0.01, ∗∗∗p < 0.001.
Figure 4
Figure 4
CXCR4 CAR-T cell treatment reduced recruitment of MDSCs in tumor tissue of CLDN18.2-positive tumor-bearing mice (A–E) Analysis the immune cells in tumor tissues of PANC02-A2 allografts. (A and B) The representative immunostaining images and quantification of CD4+ and CD8+ T cells and hematoxylin and eosin staining in tumor tissues from each treatment group. The images were obtained under original magnification ×200. Scale bars, 100 μm. (C) The quantitation of tumor-infiltrating CD8+ and CD4+ cells in CD3+ T cells of each treatment group by flow cytometry. (D and E) Representative flow cytometry plots showing the frequencies and quantitation of tumor-infiltrating CD45+ immune cells and MDSCs of each treatment group. (F–J) Analysis the immune cells in tumor tissues of KPC allografts. (F and G) Representative immunostaining images and quantification of CD4+ and CD8+ T cells and hematoxylin and eosin staining in tumor tissues from each treatment group. The images were obtained under original magnification ×200. Scale bars, 100 μm. (H) The quantitation of tumor-infiltrating CD8+ and CD4+ cells in CD3+ immune cells of each treatment group by flow cytometry. (I and J) Representative flow cytometry plots showing the frequencies and quantitation of tumor-infiltrating CD45+ immune cells and MDSCs of each treatment group. All data are presented as the mean ± SEM of triplicate experiments. ∗p < 0.05.
Figure 5
Figure 5
The SDF-1α downregulation in CAFs by the treatment of CXCR4 CAR-T cells (A–D) The protein levels of p-stat3, stat3, IkBα, p-NF-κB, NF-κB, α-SMA, and SDF-1α in the tumor tissue of (A and B) PANC02-A2-tumor bearing-mice and (C and D) KPC tumor-bearing mice from each treatment group. Glyceraldehyde 3-phosphate dehydrogenase (GAPDH) served as a loading control. (E) The expression and of CXCR4 on MDSCs determined by FACS. Representative flow cytometry plots showing the frequencies of MDSCs (CD11b+ Gr1+ cells) in CD45+ immune cells isolated from bone marrow (BM). (F) Transwell co-culture of MDSCs with different concentrations of SDF-1α. (G) Effects of SDF-1α on the chemotaxis of MDSCs. MDSCs were added to the upper chamber and 0, 50, or 100 ng/mL SDF-1α was added in the lower chamber. The cell number in the lower chamber was counted at 2 and 6 h. (H and I) The protein levels and of SDF-1α in the tumor tissue of (H) PANC02-A2-tumor bearing mice and (I) KPC-tumor bearing mice from each treatment group at days 0, 10, and 14. GAPDH served as a loading control. (J) The expression of CXCR4 on CD8+ T cells, CD4+ T cells, and MDSCs determined by flow cytometry. (K) The expression of CXCR4 on mBBZ, CXCR4 CAR-T cells, or MDSCs determined by flow cytometry. (M) Effects of SDF-1α on the chemotaxis of mBBZ, CXCR4 CAR-T cells, and MDSCs. mBBZ, CXCR4 CAR-T cells, or MDSCs were added to the upper chamber and 0, 50, or 100 ng/mL SDF-1α was added in the lower chamber. The cell number in the lower chamber was counted at 2 and 6 h. All data are presented as the mean ± SEM of triplicate experiments. ∗p < 0.05, ∗∗p < 0.01, ∗∗∗p < 0.001.
Figure 6
Figure 6
Decreased expression of inflammatory factors contributed to SDF-1α reduction in CAFs via NF-κB signaling pathway in the CXCR4 CAR-T cell treatment group (A and B) The secretion levels of TNF-α, IL-17A, and IL-6 in tumor tissues of PANC02-A2 and KPC tumor-bearing mice from each treatment group. (C) The production of TNF-α, IL-17A, and IL-6 from different CAR-T cells and target cells co-culture system. Different CAR-T cells and target cells were cultured at a 1:1 ratio of for 24 h. (D) The activation of NF-κB signaling pathway in CAFs induced by CAR-T cells. The NIH3T3-induced CAFs were treated with the cell culture supernatant of antigen-positive tumor cells and CAR-T cells for 24, 36, or 48 h. (E and F) The expressions of p-NF-κB, NF-κB, IkBα, SDF-1α, and glyceraldehyde 3-phosphate dehydrogenase (GAPDH) were determined by western blot. (E) The tumor-derived CAFs were treated with TNF-α, IL-17A, or IL-6 at the concentrations of 0, 10, 20, or 50 ng/mL for 48 h. (F) The tumor-derived CAFs were treated with 20 ng/mL TNF-α, 20 ng/mL IL-17A, or 20 ng/mL with the exposure of PDTC at the concentration for 0, 0.2, or 0.5 μM for 48 h. (G) RNA-seq was performed on CAR-T cells stimulated with antigen-positive target cells for 4 h (n = 2). Functional enrichment analysis of Kyoto Encyclopedia of Genes and Genomes pathways changed in CXCR4 CAR-T cells compared with the mBBZ CAR-T cells with or without antigen stimulation. (H) Gene set enrichment analysis of the activation of JAK/STAT3 signaling pathway between mBBZ and CXCR4 CAR-T cells with or without antigen stimulation. (I) The expression of p-stat3, stat3, caspase 3, cleaved caspase 3, and GAPDH in the mBBZ and CXCR4 CAR-T cells with antigen stimulation for 0, 5, 15, 30, or 60 min. (J) The expression of p-stat3, stat3, caspase 3, cleaved caspase 3, and GAPDH in the UTD, mBBZ, and CXCR4 CAR-T cells treated with antigen stimulation for 0, 30, or 60 min and different concentrations of SDF-1α. (K) The heatmap results shows JAK/STAT3-regulated gene expression, with red and blue representing higher and lower transcription, respectively. (L) The secretion levels of TNF-α, IL-17A, and IL-6 in mBBZ or CXCR4 CAR-T cells and antigen-positive tumor cells co-culture system. mBBZ or CXCR4 CAR-T cells were co-incubated with antigen-positive tumor cells at a 1:1 ratio with STAT3 signaling pathway inhibitor napabucasin (0, 0.01, 0.02, or 0.05 μM) for 24 h and the cytokines in supernatants were measured by CBA kits. (M) The expressions of p-NF-κB, NF-κB, IκBα, SDF-1α, and GAPDH was determined by western blot. The cell supernatants of CAR-T cells and antigen positive tumor cells with the exposure of napabucasin (0, 0.01, 0.02, or 0.05 μM) for 48 h were added into the tumor-derived CAFs and cultured for 24 h. All data are presented as the mean ± SEM of triplicate experiments. ∗p < 0.05, ∗∗∗p < 0.001.
Figure 7
Figure 7
Schema: Overexpression of CXCR4 enhances the anti-tumor ability of CAR-T cells by suppressing the infiltration of MDSCs (Top) After co-incubating CAR-T cells with antigen-positive target cells, with activated STAT3 signaling pathway, CAR-T cells secreted more inflammatory factors such as TNF-α, IL-17A, and IL-6. These inflammatory factors activated the NF-κB signaling pathway in CAFs, thereby increasing SDF-1α expression. Excessive SDF-1α secretion induced the infiltration of immunosuppressive cells MDSCs, thereby forming a tumor immunosuppressive microenvironment and limiting the function of CAR-T cells. (Bottom) Co-expression of CXCR4 improved the migration of CAR-T cells. Moreover, CXCR4 reduced the activity of STAT3 signaling pathway in CAR-T cells. The impaired activation of STAT3 signaling pathway suppressed the secretion of TNF-α, IL-17A, and IL-6, then decreased SDF-1α expression in the CAFs via NF-κB signaling pathway, thereby limiting the infiltration of MDSCs and enhancing the anti-tumor effect of CAR-T cells.

Similar articles

Cited by

References

    1. Porter D.L., Hwang W.T., Frey N.V., Lacey S.F., Shaw P.A., Loren A.W., Bagg A., Marcucci K.T., Shen A., Gonzalez V., et al. Chimeric antigen receptor T cells persist and induce sustained remissions in relapsed refractory chronic lymphocytic leukemia. Sci. Transl. Med. 2015;7:303ra139. - PMC - PubMed
    1. Shi D., Shi Y., Kaseb A.O., Qi X., Zhang Y., Chi J., Lu Q., Gao H., Jiang H., Wang H., et al. Chimeric Antigen Receptor-Glypican-3 T-Cell Therapy for Advanced Hepatocellular Carcinoma: Results of Phase I Trials.(2020) Clin. Cancer Res. 2020;26:3979–3989. - PubMed
    1. Neelapu S.S., Locke F.L., Go W.Y. CAR T-Cell Therapy in Large B-Cell Lymphoma. N. Engl. J. Med. 2018;378:1065. - PubMed
    1. Sun Y. Tumor microenvironment and cancer therapy resistance. Cancer Lett. 2016;380:205–215. - PubMed
    1. Kershaw M.H., Westwood J.A., Parker L.L., Wang G., Eshhar Z., Mavroukakis S.A., White D.E., Wunderlich J.R., Canevari S., Rogers-Freezer L., et al. A phase I study on adoptive immunotherapy using gene-modified T cells for ovarian cancer. Clin. Cancer Res. 2006;12(20 Pt 1):6106–6115. - PMC - PubMed

Publication types

MeSH terms

LinkOut - more resources