. 2024 Jan;20(4):e2302404.
doi: 10.1002/smll.202302404. Epub 2023 Sep 22.

Directional Cell Migration Guided by a Strain Gradient

Affiliations

Directional Cell Migration Guided by a Strain Gradient

Feiyu Yang et al. Small. 2024 Jan.

Abstract

Strain gradients widely exist in development and physiological activities. The directional movement of cells is essential for proper cell localization, and directional cell migration in responses to gradients of chemicals, rigidity, density, and topography of extracellular matrices have been well-established. However; it is unclear whether strain gradients imposed on cells are sufficient to drive directional cell migration. In this work, a programmable uniaxial cell stretch device is developed that creates controllable strain gradients without changing substrate stiffness or ligand distributions. It is demonstrated that over 60% of the single rat embryonic fibroblasts migrate toward the lower strain side in static and the 0.1 Hz cyclic stretch conditions at ≈4% per mm strain gradients. It is confirmed that such responses are distinct from durotaxis or haptotaxis. Focal adhesion analysis confirms higher rates of contact area and protrusion formation on the lower strain side of the cell. A 2D extended motor-clutch model is developed to demonstrate that the strain-introduced traction force determines integrin fibronectin pairs' catch-release dynamics, which drives such directional migration. Together, these results establish strain gradient as a novel cue to regulate directional cell migration and may provide new insights in development and tissue repairs.

Keywords: cell stretching devices; focal adhesion; mechanotransduction; motor-clutch model; single cell migration; strain gradient; tensotaxis; traction force.


Conflict of interest statement

Conflict of Interest

The authors declare no conflict of interest.

Figures

Figure 1.
Figure 1.
Design and calibration of the strain gradient generation device. a) Photo of the strain gradient generation device. Scale bar, 10 mm. b) Schematic showing the gear control mechanism. Scale bar, 10 mm. c) Photo of double-layer membranes with triangle cut-out (top) and square cut-out (bottom). Scale bar, 10 mm. d) Schematic showing device assembly and stretching application. e) Simulated strain fields for uniform strain (left) and strain gradient (right). f) Strain map showing experimental calibration of strain fields for uniform strain (left) and strain gradient (right).
Figure 2.
Figure 2.
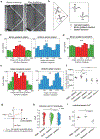
Tensotaxis behavior of REFs. a) Photos of REFs seeding on the gradient double layer membrane, before (left) and after (right) stretching. Region of interests was encircled with white dash lines. Scale bar, 200 μm. b) Schematics for the adjusted reference based on the cell’s location on the gradient (left) and the uniform double-layer membrane (right). c–e) Histograms showing cell migration direction distributions under static strain gradient group (c, left, N = 7, M = 554), static uniform strain group (c, right, N = 8, M = 654), pre-stretched static strain gradient control group (d, N = 7, M = 732), cyclic strain gradient group (e, left, N = 7, M = 649), and cyclic uniform strain group (e, right, N = 8, M = 630). f) Individual sample’s percentage of cells migrate to lower strain direction. Two sample t-tests were run between each pair of groups. g) Schematic showing the FMI|| calculation. h) Violin plots show individual cell’s FMI|| distribution for static gradient group (N = 7, M = 554) (Mean = 0.158), cyclic gradient group (N = 7, M = 649) (Mean = 0.228), and pre-stretched strain gradient control group (N = 7, M = 732) (Mean = −0.022). Mann–Whitney tests were run between each pair of groups. i) Individual samples’ average FMI|| distribution for static gradient group (N = 7), cyclic gradient group (N = 7), and pre-stretched strain gradient control group (N = 7). Two sample t-tests were run between each pair of groups. Rayleigh tests were run to determine the unimodal distribution of the circular data. **p < 0.01. ***p < 0.001. ****p < 0.0001. N: Sample number; M: Cell number.
Figure 3.
Figure 3.
Strain magnitude regulates REF tensotaxis. a) Photo of dividing an individual gradient sample into four strain magnitude regions (R1–R4). Scale bar: 200 μm. b–d) Violin plots show individual cell’s FMI|| distribution from R1 to R4 for the static gradient group (b, N = 7, M1 = 94, M2 = 128, M3 = 201, M4 = 131), cyclic gradient group (c, N = 7, M1 = 116, M2 = 242, M3 = 223, M4 = 68), and pre-stretched static gradient control group (d, N = 7, M1 = 66, M2 = 171, M3 = 247, M4 = 248). e) Individual cells’ average FMI|| from R1 to R4 for the static gradient, cyclic gradient and pre-stretched control group. Mann–Whitney tests were run between each pair of groups. *p < 0.05, **p < 0.01. N: Sample number; M1: Cell quantity in R1; M2: Cell quantity in R2; M3: Cell quantity in R3; M4: Cell quantity in R4.
Figure 4.
Figure 4.
Focal adhesion dynamics and polarized cell protrusion in response to strain gradient. a) Raw images (top) and focal adhesions identified images (bottom) of a representative REF before (left) and after (right) stretching. Scale bar 20 μm. b) Normalized percentage change of the total focal adhesion area in the lower and higher strain halves of the cells (N = 16). c) Overlapping the images before and after stretching by the nucleus center (red dot) and the gradient direction (yellow dash line). The protrusions (purple) and retractions (blue) after stretching were color coded. d) Percentage of cell area change in the lower and higher strain half (N = 17). Two sample t-tests were run. *p < 0.05. ****p < 0.0001. N: cell number.
Figure 5.
Figure 5.
Extended 2D motor-clutch modeling simulates tensotaxis. a) Schematic of a cell model. b) Motor-clutch module of an individual vertex. c) Schematic of a simulated cell model migrating from (blue line) to (red line) on a 4% gradient of strain substrate. The cell centroid is located on the 15% strain region. Black dots are cell vertex. The numbers indicate the vertex index. d) Representative of predicted cell trajectories on the 4% gradient of strain substrate (N = 10). Cell centroid (x = 0, y = 0) is located on 15% strain region. e) Life time percentage of f) engaged integrin-fibronectin pairs and traction force, and actin retrogradation flow velocity during cell migration. Red and green regions represent the lower and high strain side, respectively. N: cell number.

Similar articles

Cited by

References

    1. Ayad NME, Kaushik S, Weaver VM, Philos. Trans. R. Soc., B 2019, 374, 20180215. - PMC - PubMed
    1. Swartz MA, Fleury ME, Annu. Rev. Biomed. Eng. 2007, 9, 229. - PubMed
    1. Sun Y, Chen CS, Fu J, Annu. Rev. Biophys. 2012, 41, 519. - PMC - PubMed
    1. Abilez OJ, Tzatzalos E, Yang H, Zhao M-T, Jung G, Zöllner AM, Tiburcy M, Riegler J, Matsa E, Shukla P, Zhuge Y, Chour T, Chen VC, Burridge PW, Karakikes I, Kuhl E, Bernstein D, Couture LA, Gold JD, Zimmermann WH, Wu JC, Stem Cells 2017, 36, 265. - PMC - PubMed
    1. Gudipaty SA, Lindblom J, Loftus PD, Redd MJ, Edes K, Davey CF, Krishnegowda V, Rosenblatt J, Nature 2017, 543, 118. - PMC - PubMed

Publication types

LinkOut - more resources