

Effects of sex, age, and body mass index on serum bicarbonate
- PMID: 37736141
- PMCID: PMC10512520
- DOI: 10.3389/frsle.2023.1195823
Effects of sex, age, and body mass index on serum bicarbonate
Abstract
Rationale: Obesity hypoventilation syndrome (OHS) is often underdiagnosed, with significant morbidity and mortality. Bicarbonate, as a surrogate of arterial carbon dioxide, has been proposed as a screening tool for OHS. Understanding the predictors of serum bicarbonate could provide insights into risk factors for OHS. We hypothesized that the bicarbonate levels would increase with an increase in body mass index (BMI), since the prevalence of OHS increases with obesity.
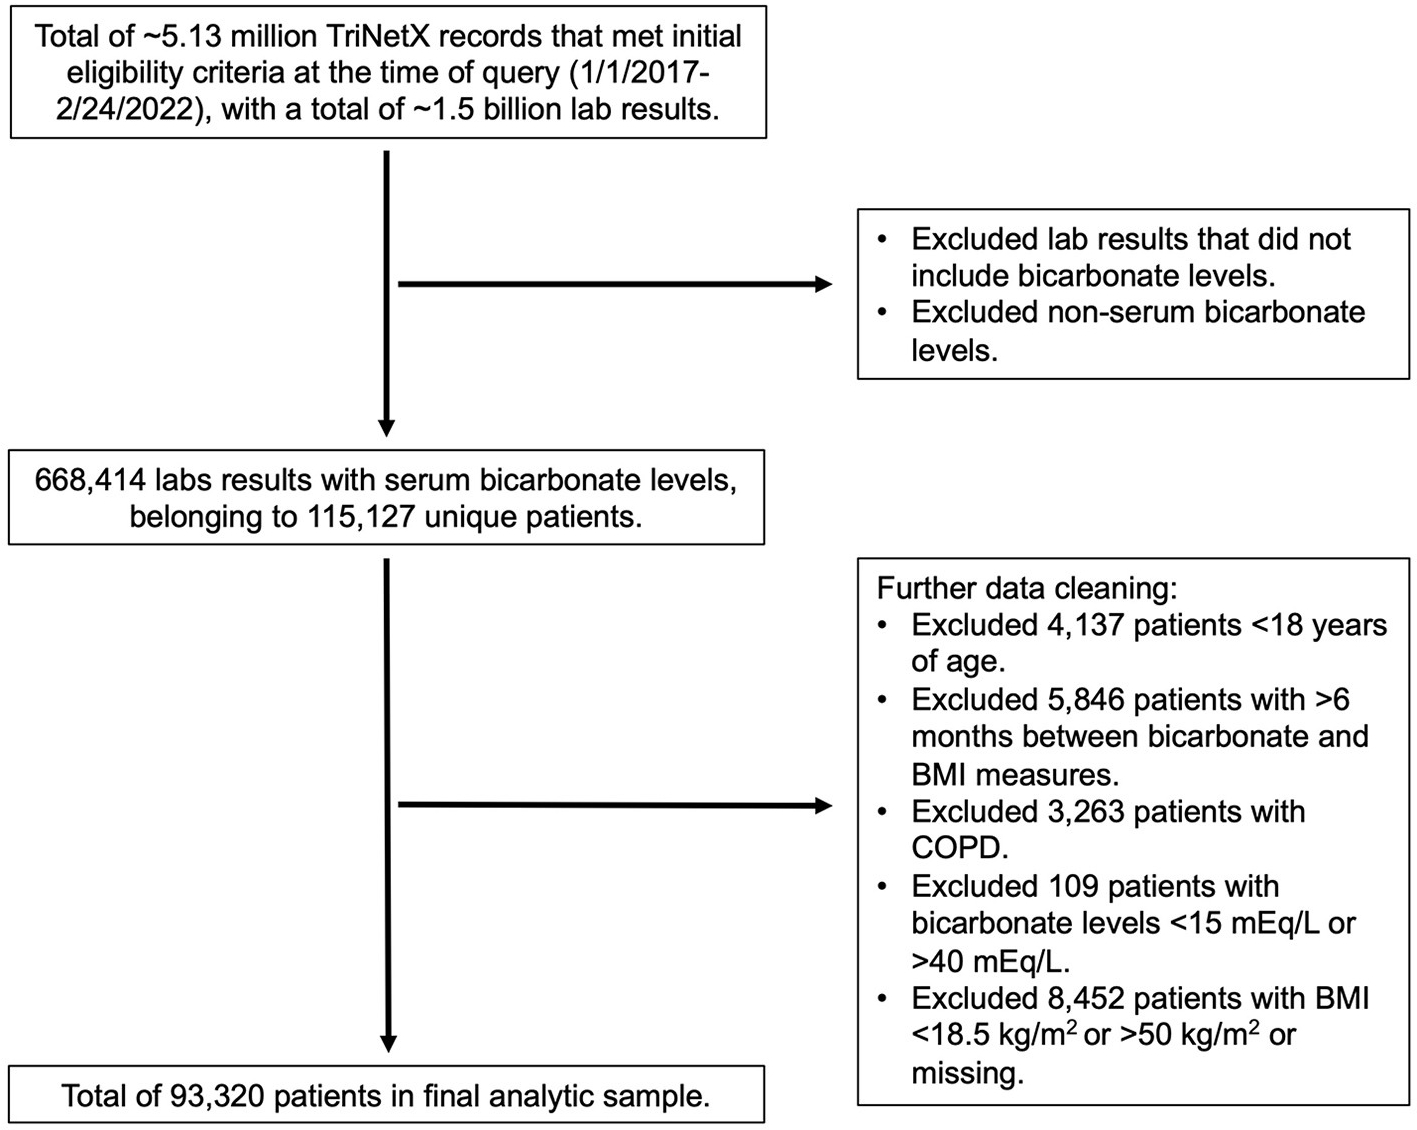
Methods: We used the TriNetX Research Network, an electronic health record database with de-identified clinical data from participating healthcare organizations across the United States, to identify 93,320 adults without pulmonary or advanced renal diseases who had serum bicarbonate and BMI measurements within 6 months of each other between 2017 and 2022. We used linear regression analysis to examine the associations between bicarbonate and BMI, age, and their interactions for the entire cohort and stratified by sex. We also applied a non-linear machine learning algorithm (XGBoost) to examine the relative importance of age, BMI, sex, race/ethnicity, and obstructive sleep apnea (OSA) status on bicarbonate.
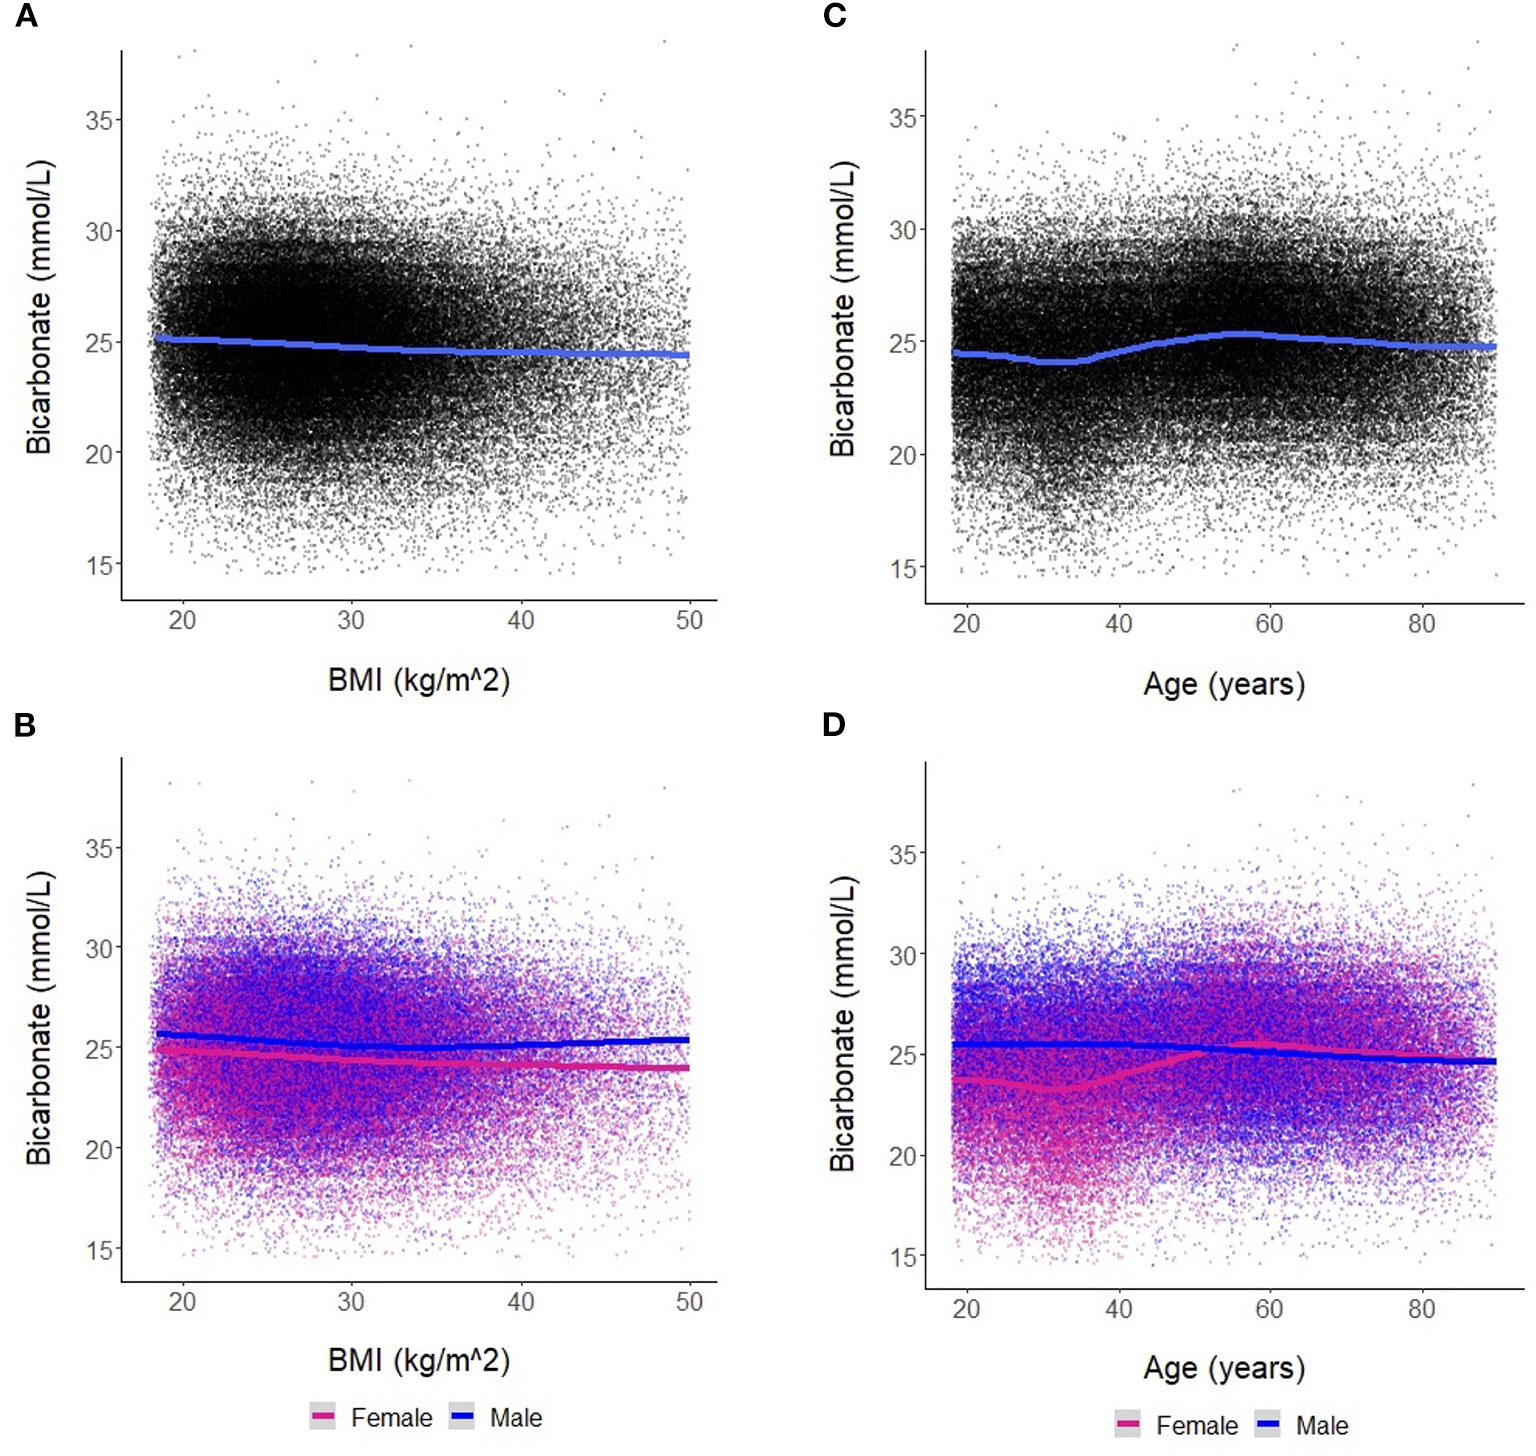
Results: This cohort population was 56% women and 72% white and 80% non-Hispanic individuals, with an average (SD) age of 49.4 (17.9) years and a BMI of 29.1 (6.1) kg/m2. The mean bicarbonate was 24.8 (2.8) mmol/L, with higher levels in men (mean 25.2 mmol/L) than in women (mean 24.4 mmol/L). We found a small negative association between bicarbonate and BMI, with an expected change of -0.03 mmol/L in bicarbonate for each 1 kg/m2 increase in BMI (p < 0.001), in the entire cohort and both sexes. We found sex differences in the bicarbonate trajectory with age, with women exhibiting lower bicarbonate values than men until age 50, after which the bicarbonate levels were modestly higher. The non-linear machine learning algorithm similarly revealed that age and sex played larger roles in determining bicarbonate levels than the BMI or OSA status.
Conclusion: Contrary to our hypothesis, BMI is not associated with elevated bicarbonate levels, and age modifies the impact of sex on bicarbonate.
Keywords: BMI; bicarbonate; obesity; obesity hypoventilation syndrome; sex; sleep apnea.
Conflict of interest statement
Conflict of interest LK and JJ declared that they were an editorial board member of Frontiers, at the time of submission. This had no impact on the peer review process and the final decision. The remaining authors declare that the research was conducted in the absence of any commercial or financial relationships that could be construed as a potential conflict of interest.
Figures


Similar articles
-
Clinical predictors of obesity hypoventilation syndrome in obese subjects with obstructive sleep apnea.Respir Care. 2015 May;60(5):666-72. doi: 10.4187/respcare.03733. Epub 2015 Jan 13. Respir Care. 2015. PMID: 25587164
-
Obesity hypoventilation syndrome: prevalence and predictors in patients with obstructive sleep apnea.Sleep Breath. 2007 Jun;11(2):117-24. doi: 10.1007/s11325-006-0092-8. Sleep Breath. 2007. PMID: 17187265
-
Elucidating Predictors of Obesity Hypoventilation Syndrome in a Large Bariatric Surgery Cohort.Ann Am Thorac Soc. 2020 Oct;17(10):1279-1288. doi: 10.1513/AnnalsATS.202002-135OC. Ann Am Thorac Soc. 2020. PMID: 32526148
-
Defining obesity hypoventilation syndrome.Breathe (Sheff). 2021 Sep;17(3):210089. doi: 10.1183/20734735.0089-2021. Breathe (Sheff). 2021. PMID: 35035556 Free PMC article. Review.
-
Obesity hypoventilation syndrome, sleep apnea, overlap syndrome: perioperative management to prevent complications.Curr Opin Anaesthesiol. 2017 Feb;30(1):146-155. doi: 10.1097/ACO.0000000000000421. Curr Opin Anaesthesiol. 2017. PMID: 27792079 Review.
Cited by
-
Age Trajectories of O2 Saturation and Levels of Serum Bicarbonate or End-Tidal CO2 Across the Life Course of Women and Men: Insights from EHR and PSG Data.Biomolecules. 2025 Jun 17;15(6):884. doi: 10.3390/biom15060884. Biomolecules. 2025. PMID: 40563523 Free PMC article.
References
-
- Apley DW, and Zhu J (2016). Visualizing the Effects of Predictor Variables in Black Box Supervised Learning Models. Available online at: https://arxiv.org/abs/161208468v.2 (accessed March 20, 2023).
Grants and funding
LinkOut - more resources
Full Text Sources