. 2023 Sep 6:11:1170758.
doi: 10.3389/fcell.2023.1170758. eCollection 2023.

Role of ferroptosis and immune infiltration in intervertebral disc degeneration: novel insights from bioinformatics analyses

Affiliations

Role of ferroptosis and immune infiltration in intervertebral disc degeneration: novel insights from bioinformatics analyses

Xiao-Wei Liu et al. Front Cell Dev Biol. .

Abstract

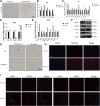
Background: Intervertebral disc degeneration (IVDD), which contributes to stenosis of the spinal segment, commonly causes lower back pain. The process of IVDD degradation entails gradual structural adjustments accompanied by extreme transformations in metabolic homeostasis. However, the molecular and cellular mechanisms associated with IVDD are poorly understood. Methods: The RNA-sequencing datasets GSE34095 and GSE56081 were obtained from the Gene Expression Omnibus (GEO) database. Ferroptosis-related differentially expressed genes (DEGs) were identified from these gene sets. The protein-protein interaction (PPI) network was established and visualized using the STRING database and Cytoscape software, and the key functional modules of ferroptosis-related genes were identified. Gene ontology (GO) and Kyoto Encyclopedia of Genes and Genomes (KEGG) pathway enrichment analyses were performed on the DEGs. Weighted gene co-expression network analysis (WGCNA), immune infiltration analysis in the GEO database, and other GSE series were used as validation datasets. The xCELL algorithm was performed to investigate the immune cell infiltration differences between the degenerated IVDD and control groups. Results: The major genes involved in nucleus pulposus tissue immune infiltration and ferroptosis-related genes were mined by bioinformatics analysis. A total of 3,056 DEGs were obtained between the IVDD tissue and control groups. The DEGs were enriched in the cell cycle; apoptosis; necroptosis; and the PI3K-Akt, Hippo, and HIF-1 signaling pathways. PCR and Western blot techniques were utilized to confirm the differential ferroptosis-related genes. The results indicated that the protein expression levels of NCOA4 and PCBP1 were elevated, while the protein expression level of GPX4 was reduced in NPCs following IL-1β treatment. Our study has found that severe disc tissue degeneration leads to a noteworthy increase in the expression of CD8A in naive T cells, CCR7 in memory CD4+ cells, GZMB in natural killer (NK) cells, and CD163 and CD45 in macrophages. Conclusion: Our data demonstrate that ferroptosis occurs in IVDD, suggesting that ferroptosis may also increase IVDD improvement by triggering immune infiltration. This work was conducted to further understand IVDD pathogenesis and identify new treatment strategies.

Keywords: bioinformatics analyses; ferroptosis-related genes; immune infiltration; intervertebral disc degeneration; weighted gene co-expression network analysis.


Conflict of interest statement

The authors declare that the research was conducted in the absence of any commercial or financial relationships that could be construed as a potential conflict of interest.

Figures
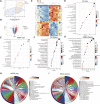
FIGURE 1
FIGURE 1
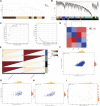
Differential mapping analysis of IVDD (A) t-distributed stochastic neighbor embedding (t-SNE) depicting the whole profile of the two datasets. (B) Volcano plots of DEGs. (C) Thermal plots of DEGs. (D–G) Bubble diagram represents GO and KEGG enrichment analysis of DEGs. (H–I) KEGG chord plot showing the top 20 biological processes.
FIGURE 2
FIGURE 2
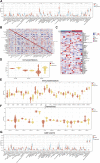
Construction of weighted co-expression network and identification of significant modules (A) Genetic tree diagram. (B) Clustering dendrogram of the clinical data from 16 IVDD samples. (C) Analysis of the scale-free ft index and mean connectivity for various soft-thresholding powers beta. (D) Module feature vector clustering heat map. (E) Heat map of the correlation between module eigengenes (MEs) and clinical characteristics of IVDD patients. Each cell contains the correlation coefficient and p-value. (F–I) Scatter plots of the GS score and MM for genes in the four modules.
FIGURE 3
FIGURE 3
Landscape of immune infiltration in IVDD (A) Violin plot of the immune cell proportions. (B) Correlation matrix of immune cell proportions: * represents the significance of the correlation. (C) Heat map of the proportions of immune cell types. (D–F) Violin plot of the immune factors. (G) Violin plot of the immune cell proportions in GSE124272.
FIGURE 4
FIGURE 4
Identification of candidate genes. (A) Venn diagram between ferroptosis-related genes and DEGs. (B) Ferroptosis-related gene PPI network. (C) Heat map of correlation analysis between the 21 screened genes. (D) Clustered heat map of ferroptosis-related genes. (E) ROC curve evaluation of candidate genes. (F) Correlation matrix of ferroptosis-related genes: * represents the significance of correlation, and the number represents the correlation level. (*p < 0.05, **p < 0.01, and ***p < 0.001).
FIGURE 5
FIGURE 5
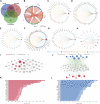
Upstream regulatory network prediction according to the downregulated DEGs (A) Five hub genes were obtained by taking the intersections of DEGs, WGCNA genes, and ferroptosis-related genes. (B) Interactions between characteristic genes at the molecular level. (C–H) Potential microRNAs and transcription factors (TFs) that regulate ferroptosis-related genes. (I) Predicted TFs and intermediate protein network diagram. (J) Regulatory network diagram according to the prediction of the downregulated DEGs. The node sizes are scaled proportional to the corresponding degree. (K) Kinases and (L) TFs according to the predictions of the downregulated DEGs.
FIGURE 6
FIGURE 6
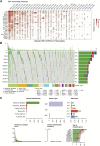
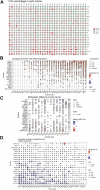
Single-nucleotide variation (SNV) frequency and variant types of the ferroptosis-related genes (A) Heat map showing the SNV frequencies of 21 ferroptosis-related genes across different cancer types. (B) Waterfall plot depicting the SNVs of the top ten mutated genes among the ferroptosis-related genes in the specific cancers. (C) SNV classes of the ferroptosis-related genes in the pan-cancer analysis.
FIGURE 7
FIGURE 7
Associations between ferroptosis-related genes, genomic features, and expression. (A) Copy number variation (CNV) pie chart showing the proportions of different types of CNVs in each gene across diverse cancer types. (B) Correlations between CNV and mRNA expression levels. (C) Profile of correlations between methylation and mRNA expression levels. (D) Methylation differences between tumor and normal samples of ferroptosis-related genes in cancers. Blue dots represent negative correlations, and red dots represent positive correlations. The sizes of the dots represent significance. Hete Amp: heterozygous amplification; Hete Del: heterozygous deletion; Homo Amp: homozygous amplification; Homo Del: homozygous deletion; and None: no CNV.
FIGURE 8
FIGURE 8
mRNA expression levels of candidate genes (A) Representative images of nucleus pulposus cell (NPC) senescence. (B) Relative mRNA expression levels of aging markers in senescent NPCs. (C) Relative mRNA expression levels of ferroptosis-related genes and immune-related markers in senescent NPCs. (D) Relative mRNA expression levels of aging markers in NPCs treated with IL-1β. (E) Relative mRNA expression levels of ferroptosis-related genes and immune-related markers in NPCs treated with IL-1β. (F) Western blot analysis of NCOA4, PCBP1, and GPX4 protein expression in NPCs treated with IL-1β. (G) Immunohistochemical staining of p21 and collagen II in the disc samples. (H, I) Immunofluorescence staining of NCOA4, PCBP1, and GPX4 in human disc degeneration tissues. (*p < 0.05, **p < 0.01, and ***p < 0.001).

References

    1. Aran D., Hu Z., Butte A. J. (2017). xCell: digitally portraying the tissue cellular heterogeneity landscape. Genome Biol. 18 (1), 220. 10.1186/s13059-017-1349-1 - DOI - PMC - PubMed
    1. Ariga K., Miyamoto S., Nakase T., Okuda S., Meng W., Yonenobu K., et al. (2001). The relationship between apoptosis of endplate chondrocytes and aging and degeneration of the intervertebral disc. Spine (Phila Pa 1976) 26 (22), 2414–2420. 10.1097/00007632-200111150-00004 - DOI - PubMed
    1. Binch A. L. A., Fitzgerald J. C., Growney E. A., Barry F. (2021). Cell-based strategies for IVD repair: clinical progress and translational obstacles. Nat. Rev. Rheumatol. 17 (3), 158–175. 10.1038/s41584-020-00568-w - DOI - PubMed
    1. Bozkurt H., Arac D., Cigdem B. (2019). Effect of preoperative uric Acid level and neutrophil/lymphocyte ratio on preoperative and postoperative visual analogue pain scores in patients with lumbar disc herniation: A cross-sectional study. Turk Neurosurg. 29 (5), 705–709. 10.5137/1019-5149.JTN.25897-19.2 - DOI - PubMed
    1. Castanheira F. V. S., Kubes P. (2019). Neutrophils and NETs in modulating acute and chronic inflammation. Blood 133 (20), 2178–2185. 10.1182/blood-2018-11-844530 - DOI - PubMed