. 2023 Aug 22;14(36):9744-9758.
doi: 10.1039/d3sc03020b. eCollection 2023 Sep 20.

Stabilisation of the RirA [4Fe-4S] cluster results in loss of iron-sensing function

Affiliations

Stabilisation of the RirA [4Fe-4S] cluster results in loss of iron-sensing function

Elizabeth Gray et al. Chem Sci. .

Abstract

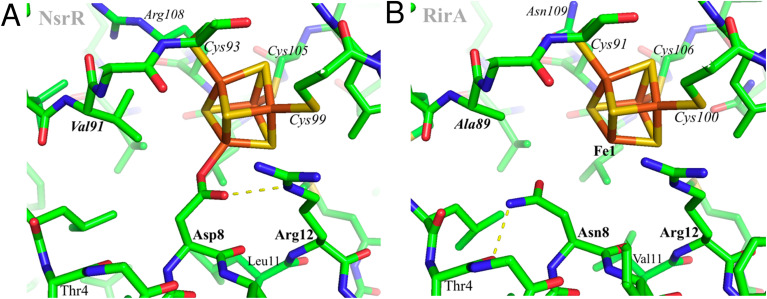
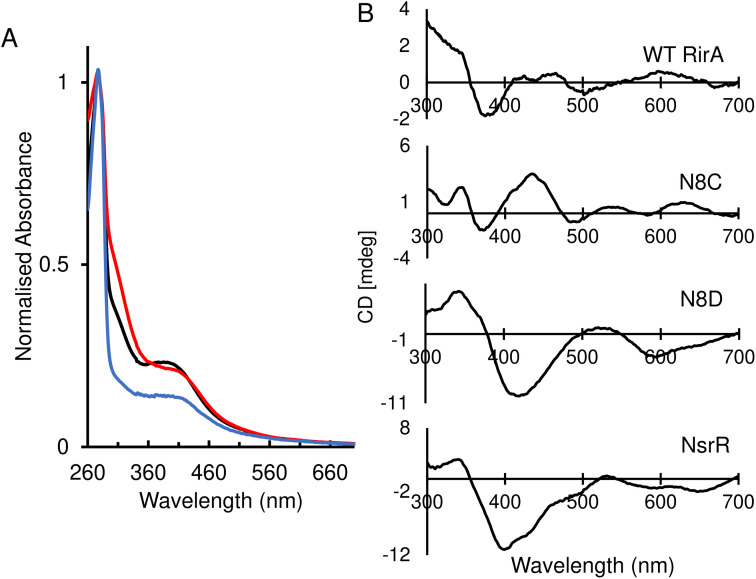
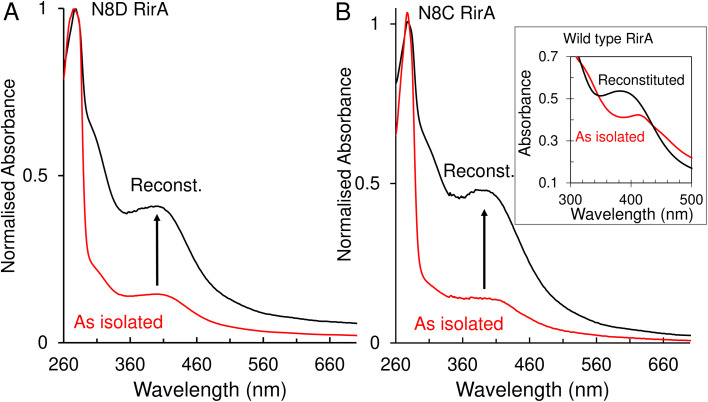
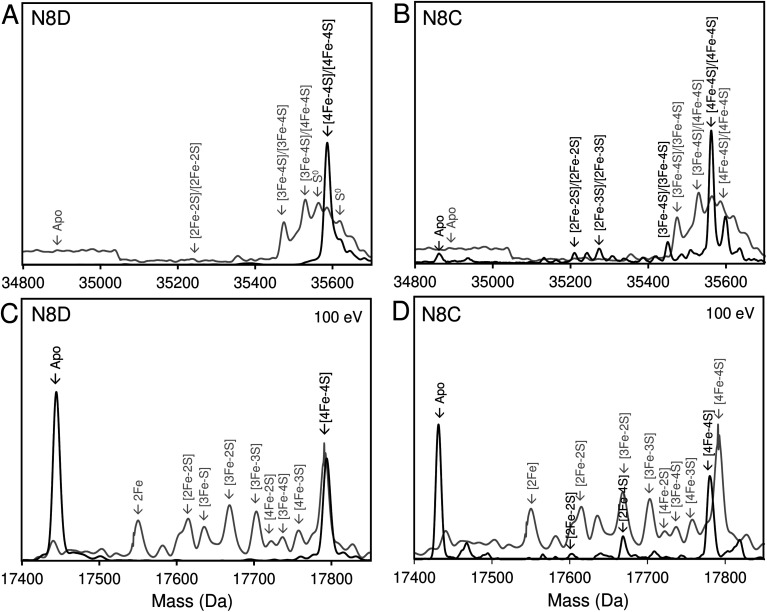
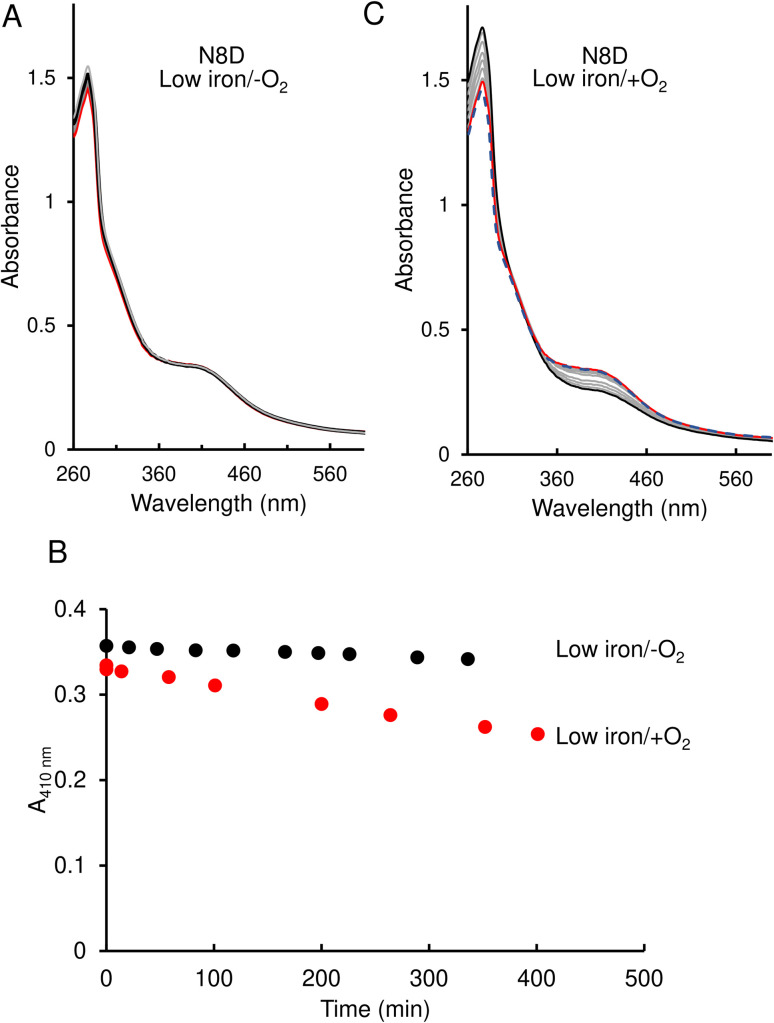
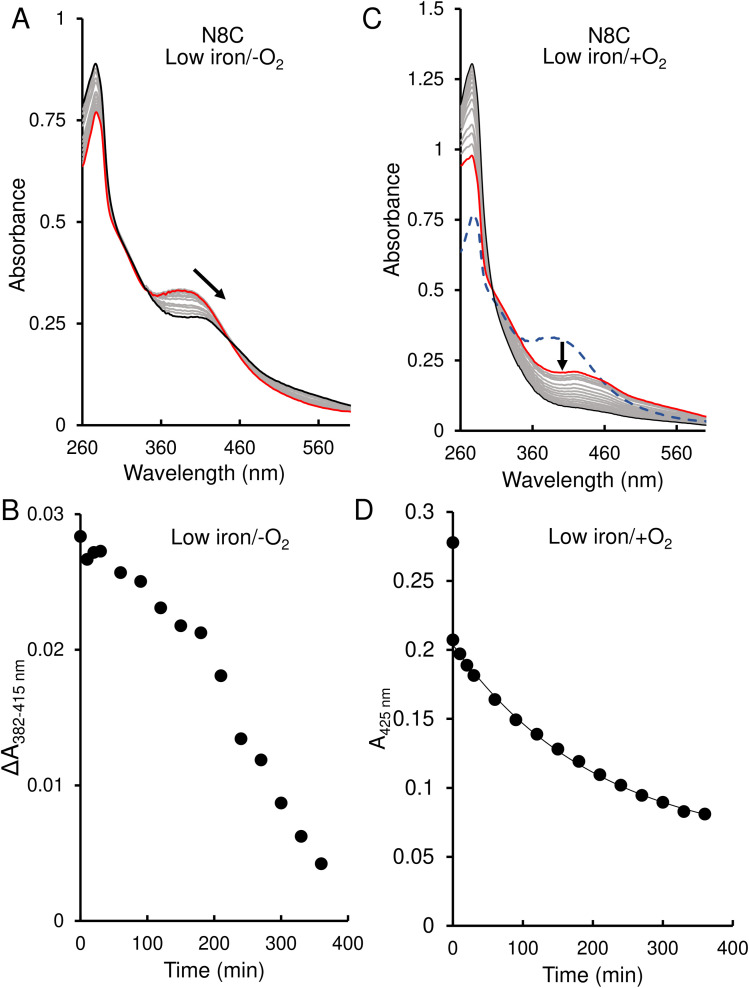
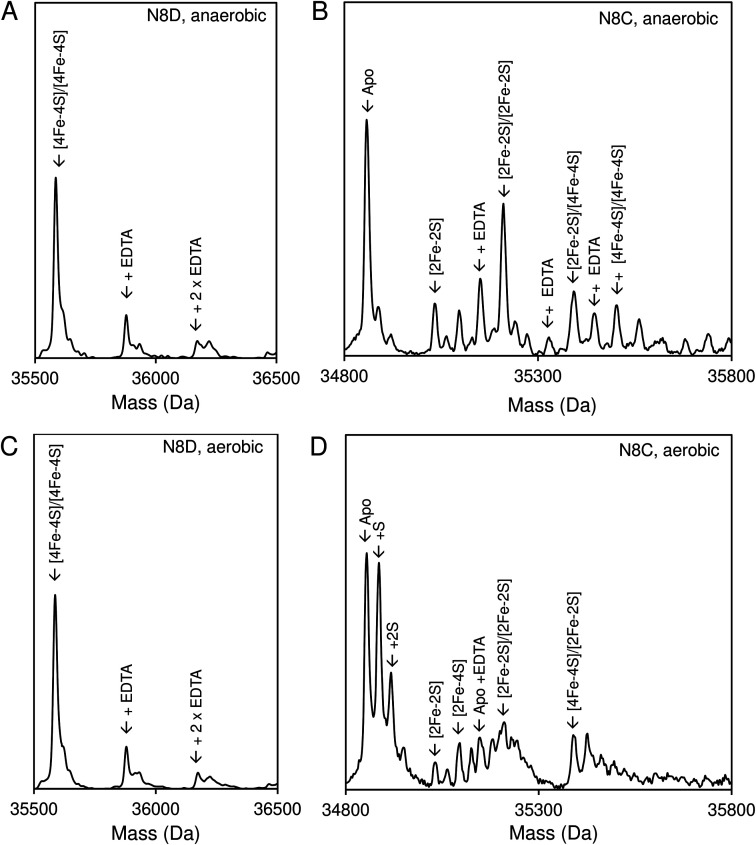
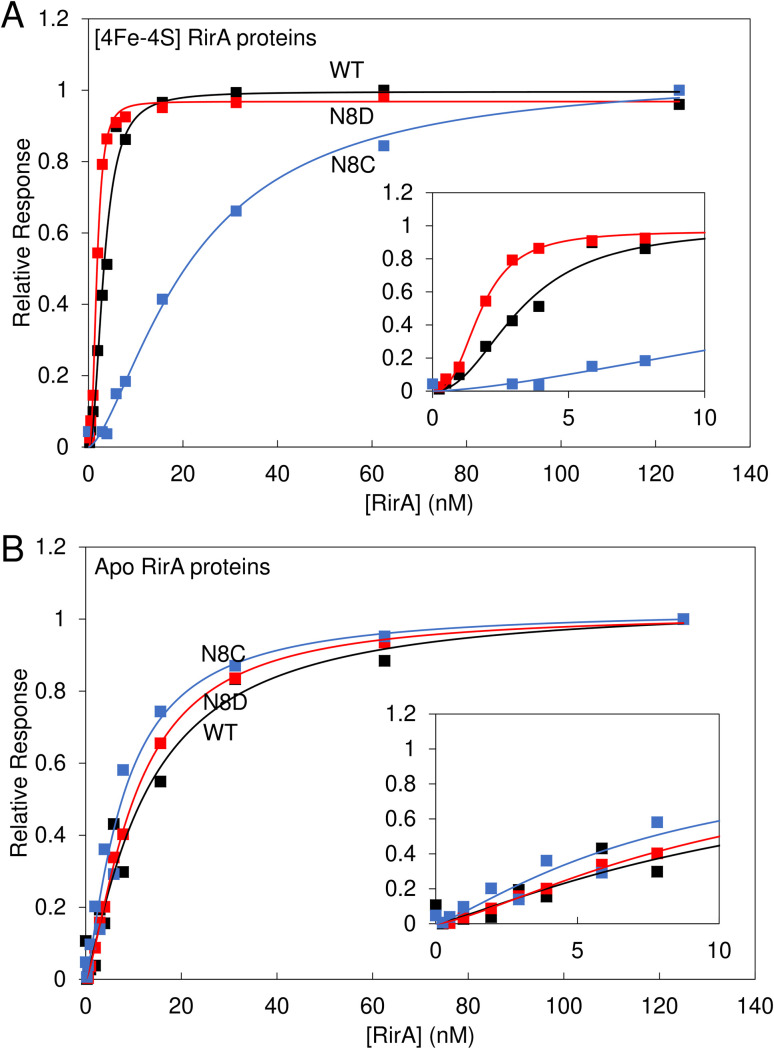
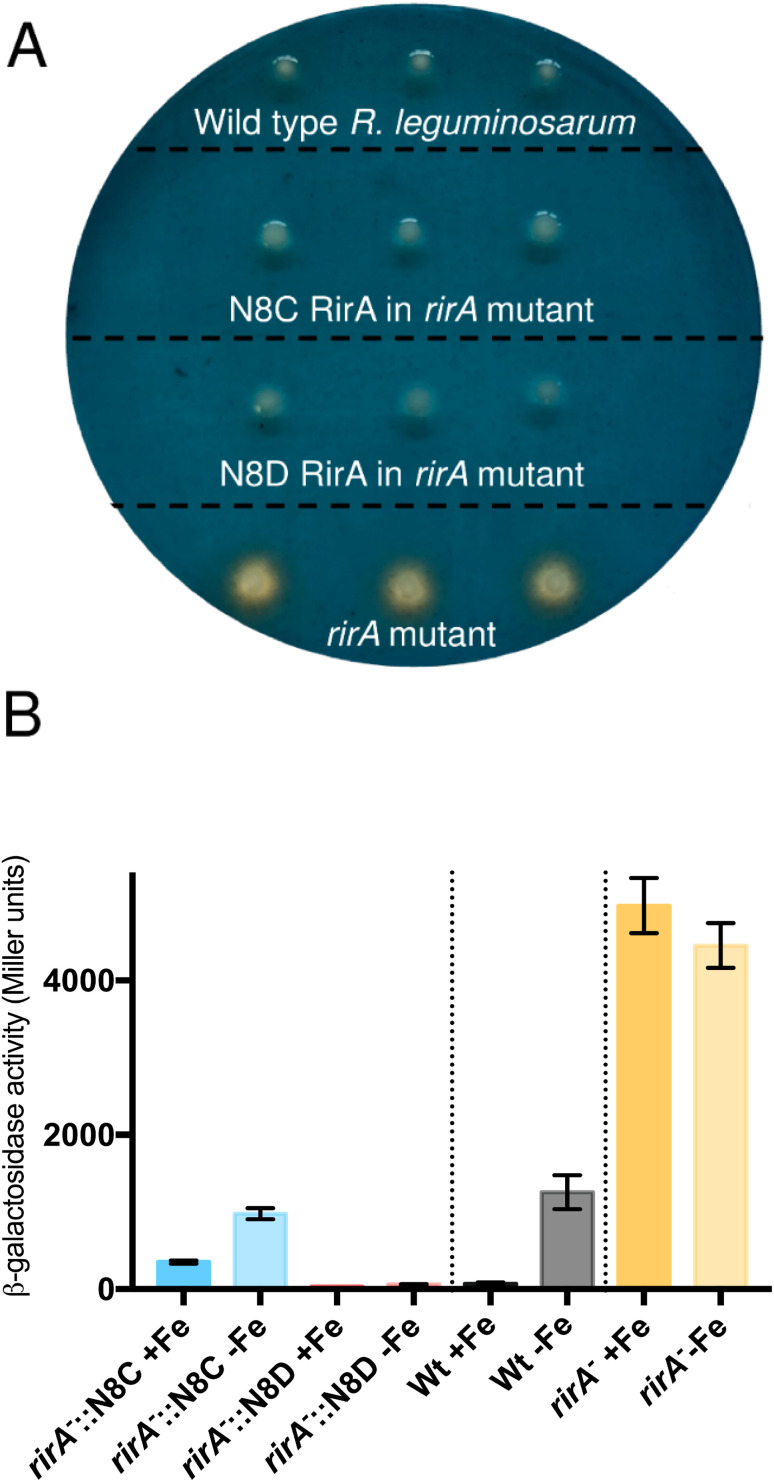
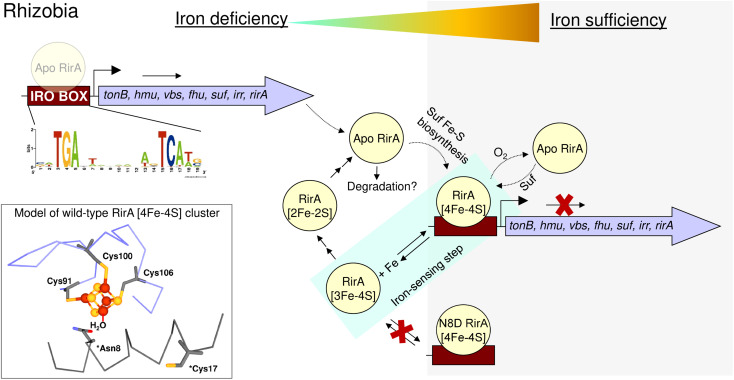
RirA is a global iron regulator in diverse Alphaproteobacteria that belongs to the Rrf2 superfamily of transcriptional regulators, which can contain an iron-sulfur (Fe-S) cluster. Under iron-replete conditions, RirA contains a [4Fe-4S] cluster, enabling high-affinity binding to RirA-regulated operator sequences, thereby causing the repression of cellular iron uptake. Under iron deficiency, one of the cluster irons dissociates, generating an unstable [3Fe-4S] form that subsequently degrades to a [2Fe-2S] form and then to apo RirA, resulting in loss of high-affinity DNA-binding. The cluster is coordinated by three conserved cysteine residues and an unknown fourth ligand. Considering the lability of one of the irons and the resulting cluster fragility, we hypothesized that the fourth ligand may not be an amino acid residue. To investigate this, we considered that the introduction of an amino acid residue that could coordinate the cluster might stabilize it. A structural model of RirA, based on the Rrf2 family nitrosative stress response regulator NsrR, highlighted residue 8, an Asn in the RirA sequence, as being appropriately positioned to coordinate the cluster. Substitution of Asn8 with Asp, the equivalent, cluster-coordinating residue of NsrR, or with Cys, resulted in proteins that contained a [4Fe-4S] cluster, with N8D RirA exhibiting spectroscopic properties very similar to NsrR. The variant proteins retained the ability to bind RirA-regulated DNA, and could still act as repressors of RirA-regulated genes in vivo. However, they were significantly more stable than wild-type RirA when exposed to O2 and/or low iron. Importantly, they exhibited reduced capacity to respond to cellular iron levels, even abolished in the case of the N8D version, and thus were no longer iron sensing. This work demonstrates the importance of cluster fragility for the iron-sensing function of RirA, and more broadly, how a single residue substitution can alter cluster coordination and functional properties in the Rrf2 superfamily of regulators.


Conflict of interest statement

The authors have no conflicts to declare.

Figures

Fig. 1
Fig. 1. Structural modelling of [4Fe–4S] RirA. Based on (A), the structure of [4Fe–4S] NsrR, a model of the RirA cluster environment was obtained (B). Compared to Asp8 of NsrR, Asn8 of RirA is predicted to be in a different rotamer to prevent clashes between its amide group and either Arg12 or the cluster. A likely Asn8 rotamer is stabilized in RirA by a hydrogen bond to the carbonyl oxygen of Thr4, shown with the dashed line. The same side chain conformation for Asp8 would not be possible in NsrR because of its collision with Val91 (substituted by Ala89 in RirA). Substitution of Asn8 by Asp is clearly feasible, and we note the relatively few residue differences in the immediate cluster environments of NsrR and RirA, consistent with the observed spectroscopic similarities between N8D RirA and wild-type NsrR. In contrast, substitution of RirA Asn8 with Cys would not result in its coordination to Fe1 unless there was a significant protein conformational change. The expected non-protein ligand to the site-differentiated iron ion is not included in (B).
Fig. 2
Fig. 2. Spectroscopic characterisation of as-isolated RirA variants. (A) Normalised UV-visible spectra of reconstituted wild-type RirA (black line) and as-isolated variants N8D (red line) and N8C (blue line) RirA. (B) Circular dichroism (CD) spectra for reconstituted wild-type RirA, and as-isolated variants N8D and N8C RirA, as labelled. The spectrum of S. coelicolor NsrR is also shown for comparison. Samples were prepared in 25 mM Hepes, 50 mM NaCl, 750 mM KCl, pH 7.5. Spectra were recorded using a 1 cm pathlength anaerobic quartz cuvette.
Fig. 3
Fig. 3. UV-visible absorbance characterisation of Asn8 variants of RirA following purification and in vitro cluster reconstitution. (A) Normalised UV-visible absorbance spectra for comparison between as isolated N8D RirA (red line) and reconstituted N8D RirA (black line). Arrow indicates increase of maximum peak at 410 nm corresponding to an increase in [4Fe–4S] cluster loading. (B) As in (A) but for N8C RirA. Inset, UV-visible absorbance spectra of as-isolated (red line) and reconstituted (black line) wild-type RirA for comparison, adapted from ref. . Spectra were recorded for as-isolated, and reconstituted Asn8 variant RirA proteins in 25 mM Hepes, 2.5 mM CaCl2, 50 mM NaCl, 750 mM KCl, pH 7.5. Measurements were obtained using a 1 mm sealed anaerobic cuvette.
Fig. 4
Fig. 4. Native ESI-MS characterisation of reconstituted N8D and N8C RirA in comparison with wild-type protein. (A) Deconvoluted mass spectrum of dimeric N8D RirA showing the only significant species, namely, dimeric, [4Fe–4S]/[4Fe–4S] N8D RirA with no observable cluster degradation species. (B) Deconvoluted mass spectrum of dimeric N8C RirA showing that the [4Fe–4S]/[4Fe–4S] form is the major species, with low intensity peaks due to [3Fe–4S]/[3Fe–4S], [2Fe–2S]/[2Fe–2S] (and persulfidated forms), and apo N8C RirA also present. The deconvoluted mass spectrum of dimeric wild-type RirA is shown for comparison in grey in (A) and (B). (C) Deconvoluted mass spectrum of the monomeric region of N8D RirA when 100 eV isCID was applied (from m/z 1500 to 2200) showing apo and [4Fe–4S] N8D RirA, with no cluster degradation species in between. (D) Deconvoluted mass spectrum of the monomeric region of N8C RirA when 100 eV isCID was applied (from m/z 1500 to 2200) showing apo, [2Fe–2S], [2Fe–4S] and [4Fe–4S] N8C RirA. The deconvoluted mass spectrum of the monomeric region of wild-type RirA is shown for comparison in grey, with cluster degradation species labelled. N8D and N8C RirA proteins (28 μM in cluster following reconstitution) were exchanged into 250 mM ammonium acetate, pH 7.3.
Fig. 5
Fig. 5. Effect of 1 mM EDTA on N8D RirA [4Fe–4S] cluster. (A) UV-visible absorbance spectra of N8D RirA recorded over several hours following the addition of 1 mM EDTA, under anaerobic conditions. The initial spectrum is in red, all intervening spectra are in grey, end point spectrum is in black (B) Plot of absorbance change obtained from anaerobic (black circles) and aerobic (red circles) experiments: A410 nm was plotted as a function of time. (C) As in (A) but under aerobic conditions. The initial spectrum prior to O2 exposure is a blue dashed line, the initial spectrum following exposure to O2 is shown in red, while all intervening spectra are in grey, and the end point spectrum is in black. For both experiments, N8D RirA (29 μM in cluster, as isolated) was in 25 mM Hepes, 2.5 mM CaCl2 50 mM NaCl, 750 mM KCl, pH 7.5. Measurements were obtained using a 1 cm pathlength sealed anaerobic quartz cuvette.
Fig. 6
Fig. 6. Effect of 1 mM EDTA on N8C RirA [4Fe–4S] cluster. (A) UV-visible absorbance spectra of N8C RirA recorded over several hours following the addition of 1 mM EDTA, under anaerobic conditions. (B) Plot of absorbance change obtained from anaerobic experiments: A382 nmA415 nm plotted as a function of time. (C) As in (A) but under aerobic conditions. The initial spectrum prior to O2 exposure is a blue dashed line, the initial spectrum following exposure to O2 is shown in red, while all intervening spectra are in grey, and the end point spectrum is in black. (D) As in (B) but for aerobic experiment and with absorbance A415 nm plotted as a function of time. The immediate decrease in absorbance upon exposure to O2 reflects conversion from a [4Fe–4S] to a [2Fe–2S] cluster. The post-O2 exposure data points were fitted using a single exponential. For both experiments, N8C RirA (29 μM in cluster following reconstitution) was in 25 mM Hepes, 2.5 mM CaCl2 50 mM NaCl, 750 mM KCl, pH 7.5. Measurements were obtained using a 1 cm pathlength sealed anaerobic quartz cuvette. Arrows indicate direction of change.
Fig. 7
Fig. 7. Effect of low iron conditions on N8D and N8C RirA. (A) Deconvoluted final mass spectrum of N8D RirA 30 min after exposure to EDTA in the absence of O2. (B) Deconvoluted final mass spectrum of N8C RirA 30 min after exposure to EDTA in the absence of O2. (C) As in (A) but in the presence of 230 μM O2. (D) As in (B) but in the presence of 230 μM O2. In all cases, spectra show mass peaks corresponding primarily to [4Fe–4S]/[4Fe–4S] dimeric N8D and N8C RirA, with any EDTA adducts as indicated. For N8C, other FeS protein-associated peaks are assigned. Both N8C and N8D RirA (28 μM in cluster following reconstitution) were exposed to 250 μM EDTA at 37 °C in 250 mM ammonium acetate, pH 7.3.
Fig. 8
Fig. 8. Binding of wild-type, N8D and N8C RirA to the fhuA promoter probed by SPR. Analyte binding response of wild-type (black), N8D (red) and N8C (blue) RirA to 200 nM 30 bp fhuA promoter region containing the IRO box consensus sequence in the (A) reconstituted [4Fe–4S] and (B) apo forms. Insets show the early part of the titrations in more detail. Clear sigmoidal behaviour was observed for wild-type and N8D [4Fe–4S] RirA proteins, indicating cooperativity, and the Hill equation was used for fitting, see Table 1. For the [4Fe–4S]-bound form, 0–125 nM dimeric protein concentration was incubated with 200 nM of the 30 bp fhuA oligo in 10 mM Hepes, 150 mM NaCl, 0.05% Tween, pH 7.4. Apo proteins were prepared in 5 mM EDTA overnight, and then titrations were performed as for holo proteins.
Fig. 9
Fig. 9. Effect of N8C and N8D versions of RirA on Fe-dependent expression of a vbsClacZ fusion. (A) Chrome azurol S (CAS) plate assays of siderophore production in wild-type R. leguminosarum, the rirA mutant, and the rirA mutant complemented by cloned rirA encoding Asn8 variants, as indicated. (B) β-Galactosidase activity (Miller units) resulting from the vbsC promotor lacZ fusion in wild-type R. leguminosarum (wild type, Wt, black), a rirA mutant (rirA, orange) and a rirA mutant containing cloned N8C rirA or N8D rirA (blue and red, respectively). Cells were grown with Fe (+Fe), or without added Fe but in the presence of 20 mM 2,2′-dipyridyl (−Fe).
Fig. 10
Fig. 10. Schematic summary of the proposed mechanism of RirA-mediated regulation of Fe-responsive genes in Rhizobia. Under iron sufficiency (grey background), RirA binds a [4Fe–4S] cluster (made via the Suf system) and associates with the IRO motif (sequence shown) of the promoter regions of RirA-regulated genes, resulting in repression of transcription. RirA regulated genes include those indicated: tonB (energy transducer for iron uptake), hmu (heme uptake) vbs and fhu (for the synthesis and uptake of the vicibactin siderophore, respectively), suf (iron-sulfur cluster biosynthesis), irr (a second global iron regulator) and rirA. Under iron deficiency (white background), the [4Fe–4S] cluster of RirA initially loses a Fe2+ ion to form an unstable [3Fe–4S] cluster that degrades to a [2Fe–2S] form and eventually to apo RirA. Forms of RirA containing a degraded Fe–S cluster, or lacking a cluster entirely, bind the IRO motif with lower affinity, and may also be subject to degradation, resulting in increased expression. O2/oxidative stress destabilises the RirA cluster, leading to increased turnover of [4Fe–4S] RirA even under iron sufficiency. Figure adapted from ref. .

References

    1. Yeoman K. H. Curson A. R. J. Todd J. D. Sawers G. Johnston A. W. B. Microbiology. 2004;150:4065–4074. doi: 10.1099/mic.0.27419-0. - DOI - PubMed
    1. Todd J. D. Wexler M. Sawers G. Yeoman K. H. Poole P. S. Johnston A. W. B. Microbiology. 2002;148:4059–4071. doi: 10.1099/00221287-148-12-4059. - DOI - PubMed
    1. Rodionov D. A. Gelfand M. S. Todd J. D. Curson A. R. J. Johnston A. W. B. PLoS Comput. Biol. 2006;2:1568–1585. doi: 10.1371/journal.pcbi.0020163. - DOI - PMC - PubMed
    1. Crack J. C. Munnoch J. Dodd E. L. Knowles F. Al Bassam M. M. Kamali S. Holland A. A. Cramer S. P. Hamilton C. J. Johnson M. K. Thomson A. J. Hutchings M. I. Le Brun N. E. J. Biol. Chem. 2015;290:12689–12704. doi: 10.1074/jbc.M115.643072. - DOI - PMC - PubMed
    1. Schwartz C. J. Giel J. L. Patschkowski T. Luther C. Ruzicka F. J. Beinert H. Kiley P. J. Proc. Natl. Acad. Sci. U. S. A. 2001;98:14895–14900. doi: 10.1073/pnas.251550898. - DOI - PMC - PubMed