. 2023 Aug 29;14(36):9843-9853.
doi: 10.1039/d3sc03078d. eCollection 2023 Sep 20.

Enhancing the NMR signals of plant oil components using hyperpolarisation relayed via proton exchange

Affiliations

Enhancing the NMR signals of plant oil components using hyperpolarisation relayed via proton exchange

Adel Alshehri et al. Chem Sci. .

Abstract

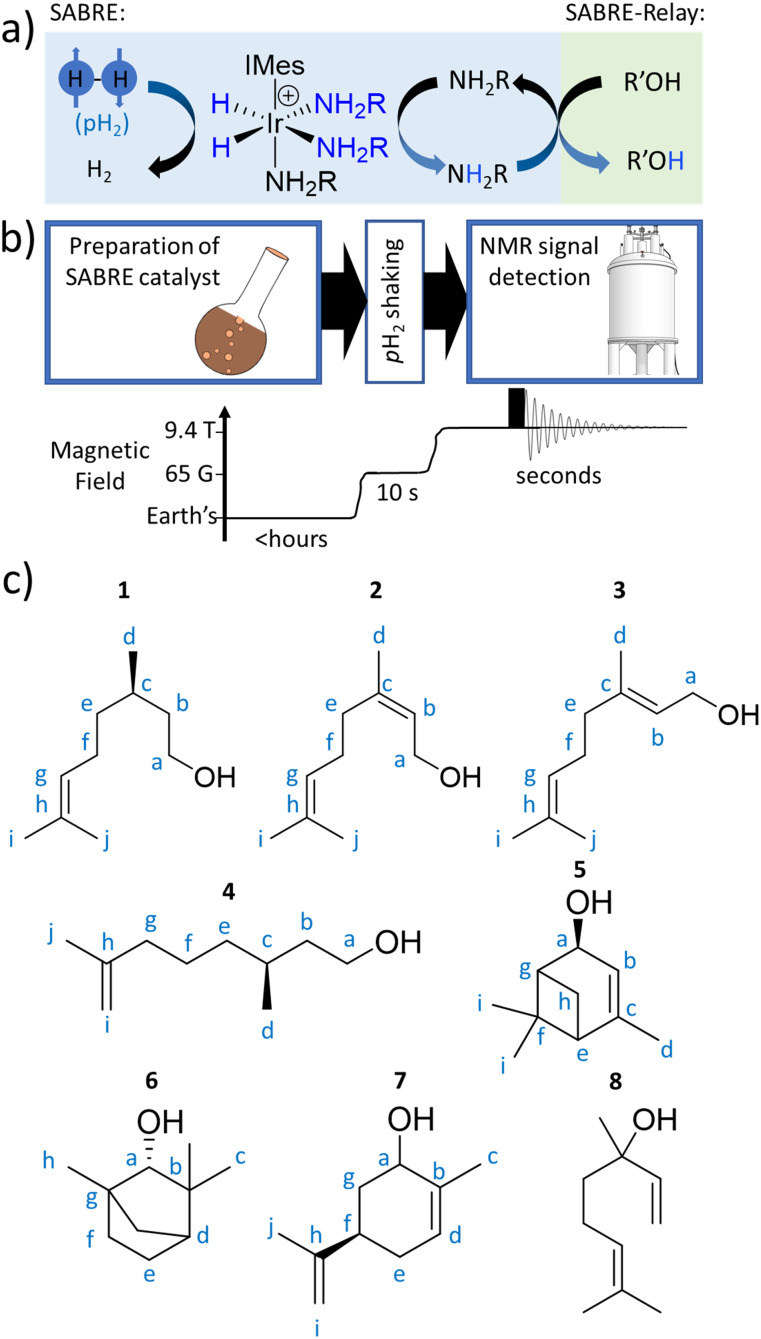
In this work, the limited sensitivity of magnetic resonance is addressed by using the hyperpolarisation method relayed signal amplification by reversible exchange (SABRE-Relay) to transfer latent magnetism from para-hydrogen, a readily isolated spin isomer of hydrogen gas, to components of key plant oils such as citronellol, geraniol, and nerol. This is achieved via relayed polarisation transfer in which an [Ir(H)2(IMes)(NH2R)3]Cl type complex produces hyperpolarised NH2R free in solution, before labile proton exchange between the hyperpolarisation carrier (NH2R) and the OH-containing plant oil component generates enhanced NMR signals for the latter. Consequently, up to ca. 200-fold 1H (0.65% 1H polarisation) and 800-fold 13C NMR signal enhancements (0.65% 13C polarisation) are recorded for these essential oils in seconds. Remarkably, the resulting NMR signals are not only diagnostic, but prove to propagate over large spin systems via a suitable coupling network. A route to optimise the enhancement process by varying the identity of the carrier NH2R, and its concentration is demonstrated. In order to prove utility, these pilot measurements are extended to study a much wider range of plant-derived molecules including rhodinol, verbenol, (1R)-endo-(+)-fenchyl alcohol, (-)-carveol, and linalool. Further measurements are then described which demonstrate citronellol and geraniol can be detected in an off-the-shelf healthcare product rose geranium oil at concentrations of just a few tens of μM in single scan 1H NMR measurements, which are not visible in comparable thermally polarised NMR experiments. This work therefore presents a significant expansion of the types of molecules amenable to hyperpolarisation using para-hydrogen and illustrates a real-world application in the diagnostic detection of low concentration analytes in mixtures.


Conflict of interest statement

There are no conflicts to declare.

Figures

Fig. 1
Fig. 1. (a) SABRE can generate enhanced NMR signals for molecules in reversible exchange with a metal complex, with the metal catalyst also in simultaneous exchange with p-H2. The latent magnetism of p-H2 is unlocked by a symmetry-breaking pairwise oxidative addition reaction to form a metal dihydride. p-H2-derived spin order is then transferred through J-couplings to a ligated molecule. Subsequent dissociation allows enhanced NMR signals for a ligand, now free in solution, to be recorded. This ligand can act as a hyperpolarisation carrier and relay spin order to non-ligating molecules via proton exchange (SABRE-Relay). Note that polarisation can then propagate from the OH proton to other 1H or X nuclei sites in the secondary molecule. (b) Depiction of the hyperpolarisation process with associated time and magnetic field profiles. Upon formation of a magnetisation transfer catalyst in situ, the sample is manually shaken with p-H2 at 6.5 mT for 10 seconds, before being rapidly inserted into a 9.4 T spectrometer and spectral acquisition commenced. (c) The plant oil substrates 1–8 used in this work.
Fig. 2
Fig. 2. (a) Single scan thermally polarised (above) and SABRE-Relay hyperpolarised (lower) 1H NMR spectra of a sample of [IrCl(COD)(IMes)] (5 mM), NH3 (8 equiv.), citronellol (5 equiv.) and p-H2 (3 bar) in DCM-d2 (0.6 mL). The hyperpolarised spectrum is recorded immediately after shaking the sample for 10 seconds with fresh p-H2 at 6.5 mT. (b) Single scan thermally polarised (above) and SABRE-Relay hyperpolarised (middle and lower) 13C NMR spectrum of the same sample. The middle spectrum used a single 90° pulse for 13C detection whereas the INEPT sequence was used in the lower spectrum to transfer magnetisation from the 1H domain to the 13C domain via radiofrequency excitation. Note that the lower spectrum is not shown on the same vertical scale as the middle and upper spectra. The associated NMR signal enhancements are given in Table S4.
Fig. 3
Fig. 3. Comparison of 1H and 13C NMR signal enhancements for (a) 1 (b) 2 and (c) 3 when a sample of each (25 mM) is shaken with [IrCl(COD)(IMes)] (5 mM), NH3 (25 mM) and p-H2 (3 bar) in DCM-d2 (0.6 mL) for 10 seconds at 6.5 mT. Note that the symbols £, $ and & indicate signal overlap and therefore the signal enhancement quoted reflects an average of the two sites.
Fig. 4
Fig. 4. (a) Example single scan thermally polarised (above) and 1H SABRE-Relay hyperpolarised (lower) 1H NMR spectra for a sample of [IrCl(COD)(IMes)] (5 mM), NH3 (55 mM), 4 (25 mM) and p-H2 (3 bar) in DCM-d2 (0.6 mL). The associated NMR signal enhancements are given in the ESI, Table S7. (b) Example single scan thermally polarised (above) and SABRE-Relay hyperpolarised 1H → 13C INEPT (lower) spectra for a sample of [IrCl(COD)(IMes)] (5 mM), NH3 (40 mM), 5 (25 mM) and p-H2 (3 bar) in DCM-d2 (0.6 mL). The associated signal enhancements are given in the ESI, Table S8. (c) Example single scan thermally polarised (above) and 1H SABRE-Relay hyperpolarised (lower) 1H NMR spectra for a sample of [IrCl(COD)(IMes)] (5 mM), NH3 (40 mM), 6 (25 mM) and p-H2 (3 bar) in DCM-d2 (0.6 mL). The associated signal enhancements are given in the ESI, Table S9. (d) Example single scan thermally polarised (above) and 1H SABRE-Relay hyperpolarised (lower) 1H NMR spectra for a sample of [IrCl(COD)(IMes)] (5 mM), NH3 (30 mM), 7 (25 mM) and p-H2 (3 bar) in DCM-d2 (0.6 mL). The associated signal enhancements are given in Table S10. The resonance labels in red and blue correspond to the two diastereomers of 7. All hyperpolarised NMR spectra are recorded immediately after shaking the sample for 10 seconds with fresh p-H2 at 6.5 mT. Note that the hyperpolarised NMR spectra, and their thermally polarised counterparts, are shown on the same vertical scale, except for those in (b).
Fig. 5
Fig. 5. (a and b) Effect of varying the NH3 concentration on the NMR signal enhancements of 1. Samples of 1 (60 mM) were shaken with [IrCl(COD)(IMes)] (5 mM), NH3 (indicated amount) and p-H2 (3 bar) in DCM-d2 (0.6 mL) for 10 seconds at 6.5 mT. (c and d) Effect of varying the concentration of 1 on its NMR signal enhancements. Samples of 1 (indicated amount) were shaken with [IrCl(COD)(IMes)] (5 mM), NH3 (60 mM) and p-H2 (3 bar) in DCM-d2 (0.6 mL) for 10 seconds at 6.5 mT.
Fig. 6
Fig. 6. (a) SABRE-Relay hyperpolarised 1H NMR control experiment for [Ir(H)2(IMes)(NH3)3]Cl formed in situ (lower, black) with a spectrum for the same sample after addition of rose geranium oil (1: 37 μM and 3: 29 μM) (blue). NMR spectra recorded after the addition of more rose geranium oil (1: 92 μM and 3: 72 μM, red spectrum and 1: 554 μM and 3: 431 μM, green spectrum). A thermally polarised NMR spectrum is shown at the top (purple) for comparison (1: 92 μM and 3: 72 μM). The hyperpolarisation process involved shaking a sample for 10 seconds with fresh p-H2 at 6.5 mT. Resonances are labelled according to the scheme shown in Fig. 1c.

Similar articles

Cited by

References

    1. Nikolaou P. Goodson B. M. Chekmenev E. Y. Chem.–Eur. J. 2015;21:3156–3166. doi: 10.1002/chem.201405253. - DOI - PMC - PubMed
    1. Angelovski G. Tickner B. J. Wang G. Nat. Chem. 2023:1–9. - PubMed
    1. Ardenkjær-Larsen J. H. Fridlund B. Gram A. Hansson G. Hansson L. Lerche M. H. Servin R. Thaning M. Golman K. Proc. Natl. Acad. Sci. 2003;100:10158–10163. doi: 10.1073/pnas.1733835100. - DOI - PMC - PubMed
    1. Hövener J. Pravdivtsev A. N. Kidd B. Bowers C. R. Glöggler S. V Kovtunov K. Plaumann M. Katz-Brull R. Buckenmaier K. Jerschow A. Angew. Chem., Int. Ed. 2018;57:11140–11162. doi: 10.1002/anie.201711842. - DOI - PMC - PubMed
    1. Keshari K. R. Wilson D. M. Chem. Soc. Rev. 2014;43:1627–1659. doi: 10.1039/C3CS60124B. - DOI - PMC - PubMed