. 2023 Sep 22;24(1):564.
doi: 10.1186/s12864-023-09552-6.

Profiling the polyadenylated transcriptome of extracellular vesicles with long-read nanopore sequencing

Affiliations

Profiling the polyadenylated transcriptome of extracellular vesicles with long-read nanopore sequencing

Juan-Carlos A Padilla et al. BMC Genomics. .

Abstract

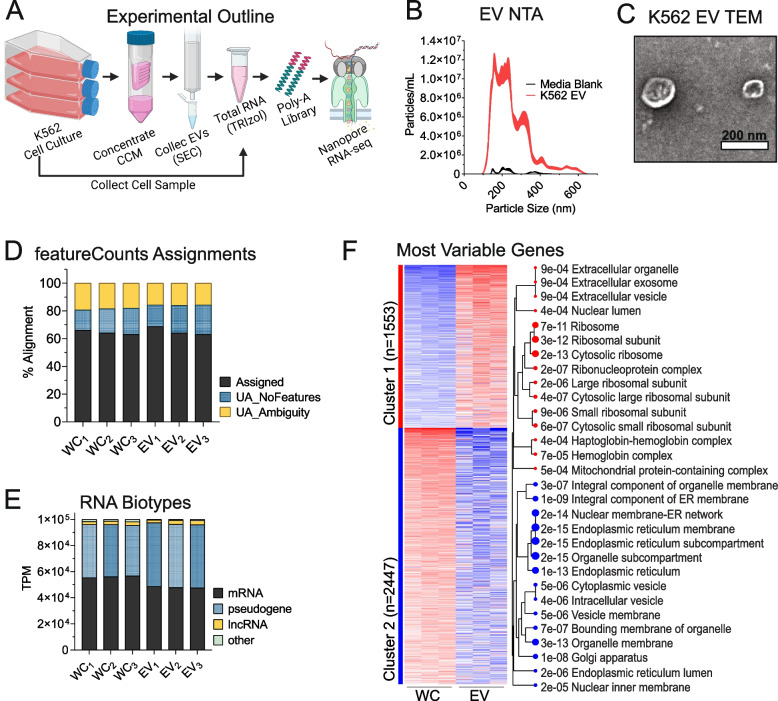
Background: While numerous studies have described the transcriptomes of extracellular vesicles (EVs) in different cellular contexts, these efforts have typically relied on sequencing methods requiring RNA fragmentation, which limits interpretations on the integrity and isoform diversity of EV-targeted RNA populations. It has been assumed that mRNA signatures in EVs are likely to be fragmentation products of the cellular mRNA material, and the extent to which full-length mRNAs are present within EVs remains to be clarified.

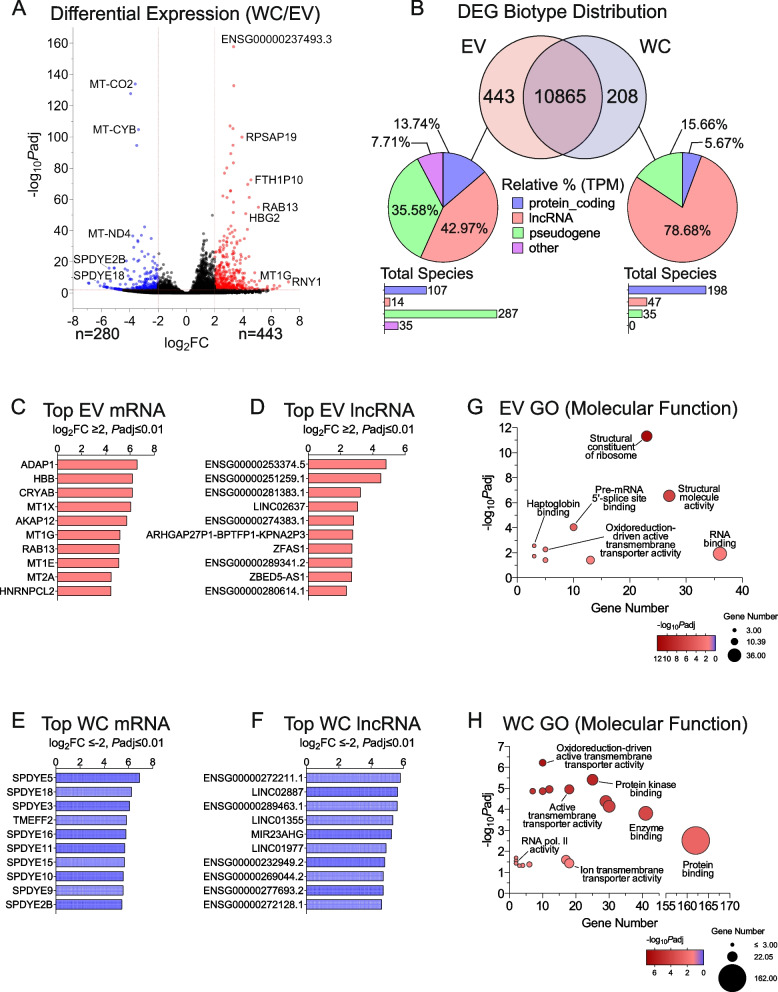
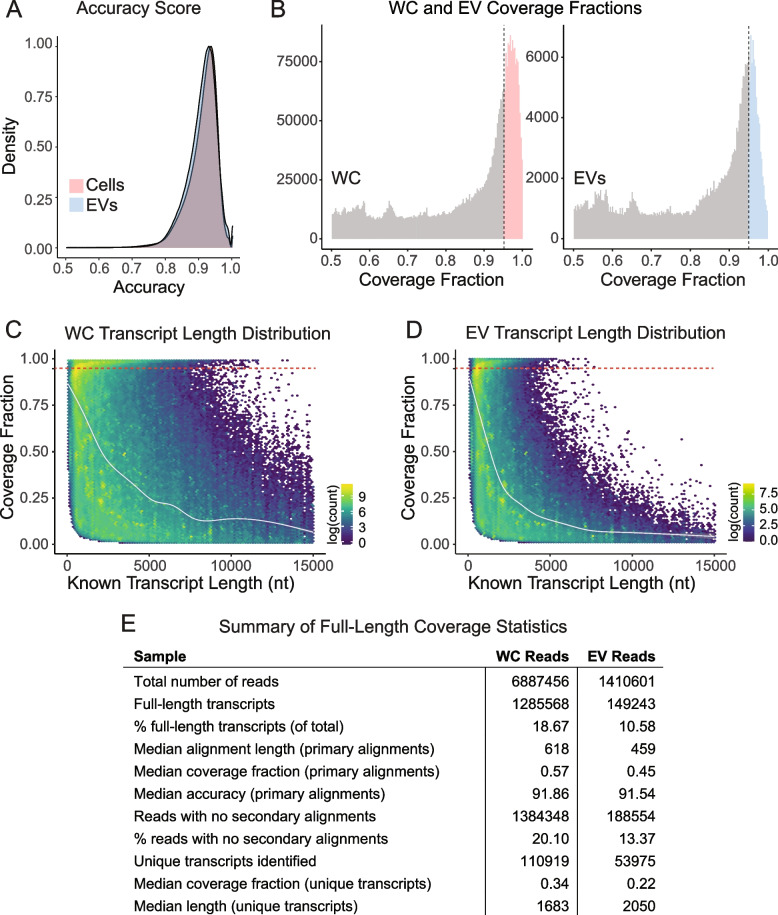
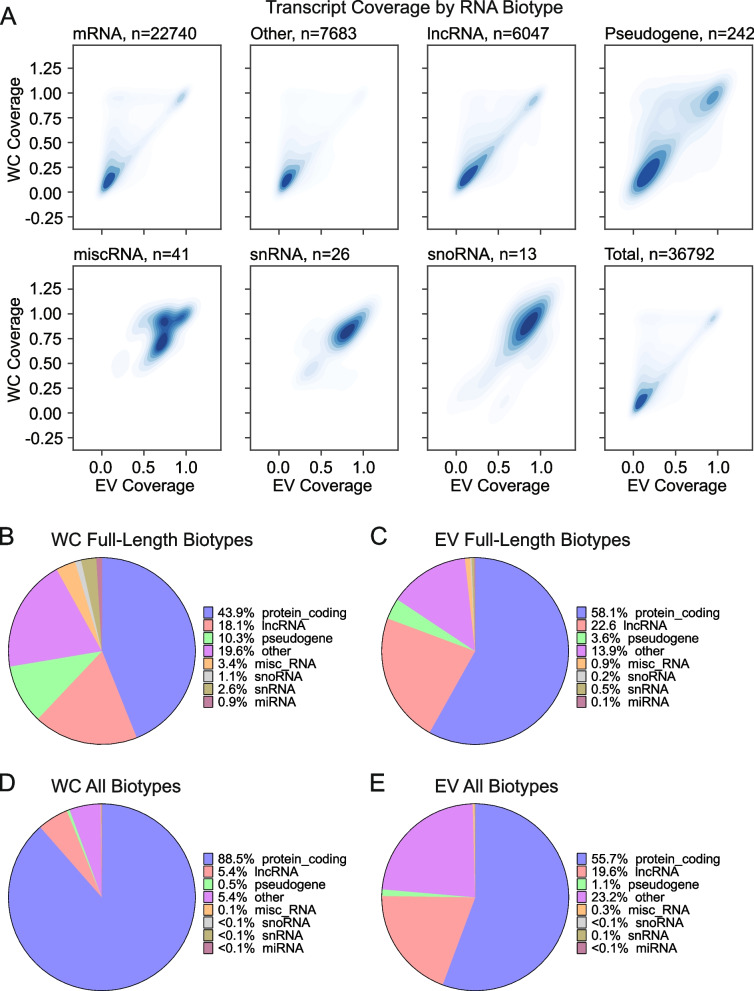
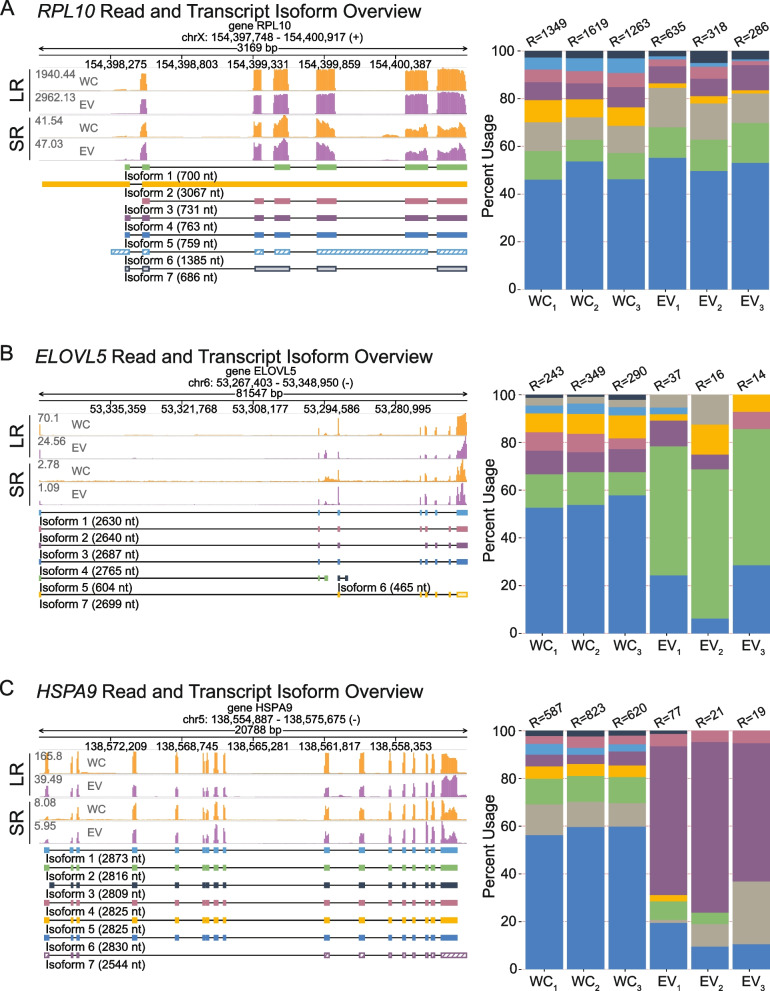
Results: Using long-read nanopore RNA sequencing, we sought to characterize the full-length polyadenylated (poly-A) transcriptome of EVs released by human chronic myelogenous leukemia K562 cells. We detected 443 and 280 RNAs that were respectively enriched or depleted in EVs. EV-enriched poly-A transcripts consist of a variety of biotypes, including mRNAs, long non-coding RNAs, and pseudogenes. Our analysis revealed that 10.58% of all EV reads, and 18.67% of all cellular (WC) reads, corresponded to known full-length transcripts, with mRNAs representing the largest biotype for each group (EV = 58.13%, WC = 43.93%). We also observed that for many well-represented coding and non-coding genes, diverse full-length transcript isoforms were present in EV specimens, and these isoforms were reflective-of but often in different ratio compared to cellular samples.

Conclusion: This work provides novel insights into the compositional diversity of poly-A transcript isoforms enriched within EVs, while also underscoring the potential usefulness of nanopore sequencing to interrogate secreted RNA transcriptomes.

Keywords: Extracellular vesicles; Long-Read RNA Sequencing; Nanopore sequencing; Poly-A; Polyadenylated transcriptome; RNA-seq; Transcript Isoforms; Transcriptomics; lncRNA; mRNA.


Conflict of interest statement

The authors declare no competing interests.

Figures

Fig. 1
Fig. 1
Nanopore sequencing identifies a variety of RNA biotypes. A Graphical experimental outline of the isolation of K562 cellular and extracellular vesicles (EV) total RNA, library preparation, and nanopore sequencing. Graphic created with BioRender.com B Nanoparticle Tracking Analysis (NTA) of cleared cell-conditioned media. Border thickness defines the standard error. C Transmission electron micrographs of iodixanol gradient-purified EVs. EVs were negatively stained with 2% uranyl acetate and imaged on the FEI Tecnai T12 120kV transmission electron microscope. D Stacked bar graphs of the percentage of input of cellular and EV sequencing reads with assigned or unassigned (UA) features as determined by featureCounts. E RNA biotype distributions of cellular and EV transcriptomes. ‘Other’ includes a varied group of minor transcripts including, but not limited to, miscRNA, snRNA, snoRNA, etc. F iDEP unsupervised clustering heatmap of the top 4000 most variable genes in cellular and EV transcriptomes. Cellular component gene ontology (GO) terms associated with each cluster are represented on the right. Red lines denote enrichment in EVs, blue lines denote enrichment in cells
Fig. 2
Fig. 2
EV-enriched RNAs display GO associations to ribonucleoprotein complexes. A Volcano plot of cellular and EV transcriptomes signifying the shift in gene expression levels. Blue dots represent statistically significant downregulated EV-genes (Log2 fold change ≤ -2, Padj≤ 0.01). Red dots represent statistically significant upregulated EV-genes (Log2 fold change ≥ 2, Padj ≤ 0.01). B Venn diagram of differentially expressed RNAs in EV vs WC (Log2 fold change ≥ 2 or ≤ -2, Padj ≤ 0.01). In the center are RNAs which displayed similar expression profiles in either group. Inclusion to this group was limited to RNAs with an average of ≥ 5 reads (triplicates). Differentially expressed RNAs are further categorized into pie charts and bar graphs, denoting their relative percentages in transcripts per million and their contributing RNAs, respectively. C-D Bar graphs of the top 10 EV-enriched (Log2 fold change ≥ 2, Padj ≤ 0.01) mRNA and lncRNA, respectively. E–F Bar graphs of the top 10 cell-enriched/EV-depleted (Log2 fold change ≤ -2, Padj ≤ 0.01) mRNA and lncRNA, respectively. G Bubble plot of GO molecular function of EV-enriched mRNA as determined with g:Profiler. All enriched (Log2 fold change ≥ 2, Padj ≤ 0.01) RNA considered. H Bubble plot of GO molecular function of cell-enriched mRNA as determined with g:Profiler. All enriched (Log2 fold change ≤ -2, Padj ≤ 0.01) RNA considered
Fig. 3
Fig. 3
EVs contain full-length RNAs. A Median accuracy of primary alignment score determined using the BamSlam algorithm. B Histogram distribution of full-length reads in cells and EVs. Represented are the coverage fractions of known transcript length covered by each read (truncated at 0.5). The dotted lines represent the > 95% coverage denoting full-length. Full-length cellular transcripts shown in red, full-length EV transcripts shown in blue. C-D Density plots of cellular (C) and EV (D) transcripts displaying their coverage fractions against known transcripts. E Summary of statistical information as determined by BamSlam
Fig. 4
Fig. 4
EVs contain full-length RNAs of different biotypes. A Density plots of RNA biotypes displaying the transcript coverage in EVs relative to cells. B-C Pie charts displaying the RNA biotype percentages of BamSlam-identified full-length RNAs identified in cells and EVs. D-E Pie charts displaying the RNA biotype percentages of all BamSlam-identified RNAs (full-length and non-full-length) identified in cells and EVs
Fig. 5
Fig. 5
EVs carry differentially expressed transcript isoforms. A Isoform usage analysis of RPL10 displaying recruitment of similar isoform types in EVs relative to cells of origin. The genome browser views represent the sequencing reads along with their associated transcript isoforms. LR represents long-read nanopore sequencing data, while SR represents Illumina short-read sequencing (unpublished data). Histograms represent the percentage of transcript isoform representation per transcriptome, with color coding matching the accompanying isoform. R = total number of detected reads. Isoform identity (as defined by FLAIR): Isoform 1: 6eee3e78-fe04-4ee6-90d4-ecc361ca6e05, Isoform 2: 415620e2-1272-483b-86eb-7d7532fe4780, Isoform 3: ENST00000344746.8, Isoform 4: ENST00000436473.5, Isoform 5: ENST00000369817.7, Isoform 6: 07d5ac1f-db7c-47ab-a5e8-04a78777867e, Isoform 7: 40708139-1f87-49ca-a99a-5f5e1e0422c9. B Isoform usage analysis of ELOVL5 displaying preference for the recruitment of isoform variants in EVs relative to cells of origin, with variant ENST00000370913.5 showing enrichment in EVs. The genome browser views represent the sequencing reads along with their associated transcript isoforms. LR represents long-read nanopore sequencing data, while SR represents Illumina short-read sequencing (unpublished data). R = total number of detected reads. Isoform identity (as defined by FLAIR): Isoform 1: 9d9223d4-0463-4bdf-ae2c-603abfbc8fae, Isoform 2: ENST00000542638.5, Isoform 3: a987f2f6-fdb0-4501-87c3-9b457392a133, Isoform 4: ENST00000304434.11, Isoform 5: ENST00000370913.5, Isoform 6: 03f316c6-1d4c-48e5-ab63-57acbaaf3126, Isoform 7: 4a5f7dbd-8838–4359-af96-63e1ff580847. C Isoform usage analysis of HSPA9 displaying preference for the recruitment of isoform variants in EVs relative to cells of origin, with variant 4671fbc1-2c63-4c88-af4b-90b6b1aa4277 showing enrichment in EVs. The genome browser views represent the sequencing reads along with their associated transcript isoforms. LR represents long-read nanopore sequencing data, while SR represents Illumina short-read sequencing (unpublished data). R = total number of detected reads. Isoform identity (as defined by FLAIR): Isoform 1: ENST00000677988.1, Isoform 2: ENST00000678794.1, Isoform 3: ENST00000678384.1, Isoform 4: ENST00000678300.1, Isoform 5: ENST00000677553.1, Isoform 6: ENST00000297185.9, Isoform 7: 4671fbc1-2c63-4c88-af4b-90b6b1aa4277. For all figures, isoform shading corresponds to: solid color (productive), hatched color (premature termination codon), or faded color (no start codon or has start codon but no stop codon)

Similar articles

Cited by

References

    1. Théry C, Witwer KW, Aikawa E, Alcaraz MJ, Anderson JD, Andriantsitohaina R, Antoniou A, Arab T, Archer F, Atkin-Smith GK, et al. Minimal information for studies of extracellular vesicles 2018 (MISEV2018): a position statement of the International Society for Extracellular Vesicles and update of the MISEV2014 guidelines. J Extracell Vesicles. 2018;7(1):1535750. - PMC - PubMed
    1. van Niel G, D'Angelo G, Raposo G. Shedding light on the cell biology of extracellular vesicles. Nat Rev Mol Cell Biol. 2018;19(4):213–228. - PubMed
    1. Maacha S, Bhat AA, Jimenez L, Raza A, Haris M, Uddin S, Grivel J-C. Extracellular vesicles-mediated intercellular communication: roles in the tumor microenvironment and anti-cancer drug resistance. Mol Cancer. 2019;18(1):55. - PMC - PubMed
    1. O'Brien K, Breyne K, Ughetto S, Laurent LC, Breakefield XO. RNA delivery by extracellular vesicles in mammalian cells and its applications. Nat Rev Mol Cell Biol. 2020;21(10):585–606. - PMC - PubMed
    1. Lefebvre FA, Lecuyer E. Small luggage for a long journey: transfer of vesicle-enclosed small RNA in interspecies communication. Front Microbiol. 2017;8:377. - PMC - PubMed