

Genic constraint against nonsynonymous variation across the mouse genome
- PMID: 37736706
- PMCID: PMC10514939
- DOI: 10.1186/s12864-023-09637-2
Genic constraint against nonsynonymous variation across the mouse genome
Abstract
Background: Selective constraint, the depletion of variation due to negative selection, provides insights into the functional impact of variants and disease mechanisms. However, its characterization in mice, the most commonly used mammalian model, remains limited. This study aims to quantify mouse gene constraint using a new metric called the nonsynonymous observed expected ratio (NOER) and investigate its relationship with gene function.
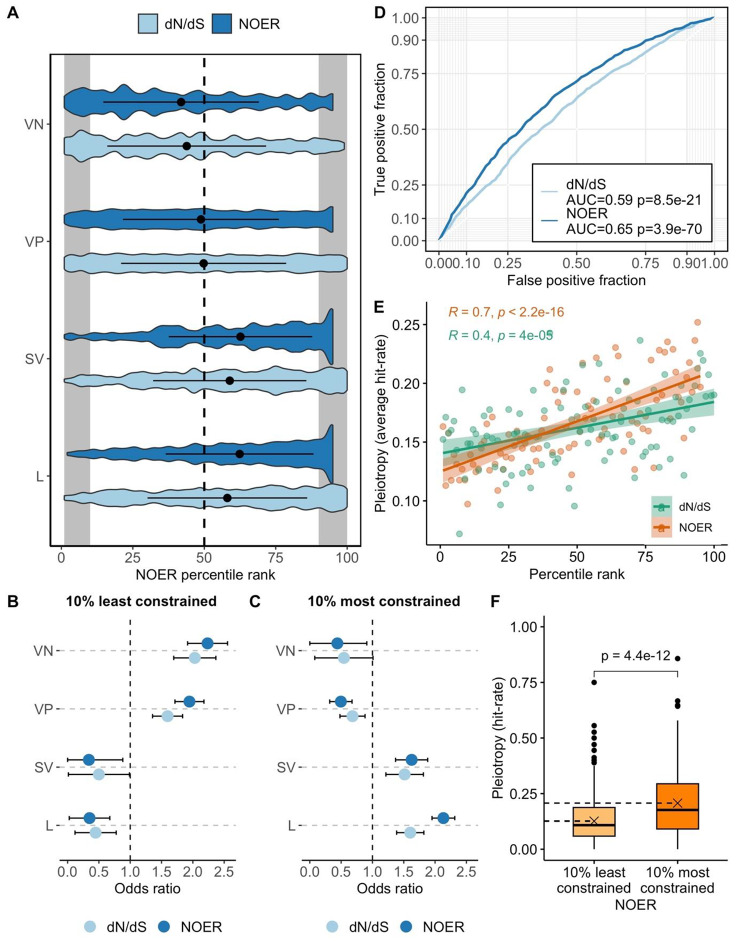
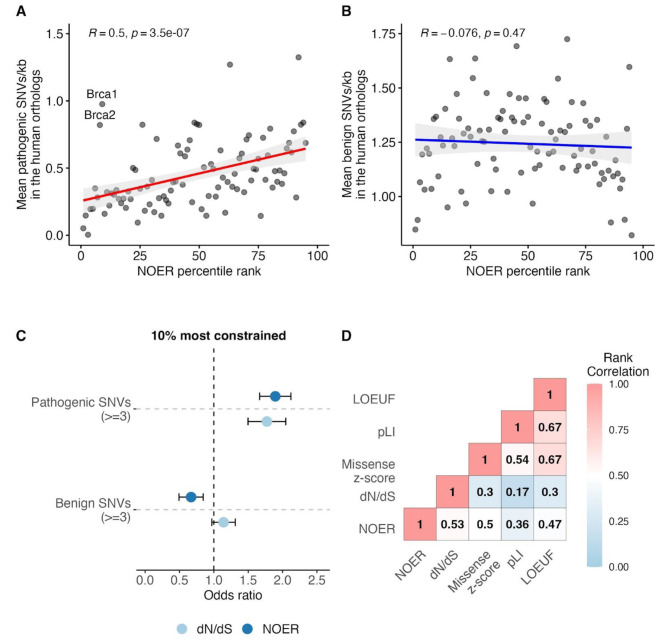
Results: NOER was calculated using whole-genome sequencing data from wild mouse populations (Mus musculus sp and Mus spretus). Positive correlations were observed between mouse gene constraint and the number of associated knockout phenotypes, indicating stronger constraint on pleiotropic genes. Furthermore, mouse gene constraint showed a positive correlation with the number of pathogenic variant sites in their human orthologues, supporting the relevance of mouse models in studying human disease variants.
Conclusions: NOER provides a resource for assessing the fitness consequences of genetic variants in mouse genes and understanding the relationship between gene constraint and function. The study's findings highlight the importance of pleiotropy in selective constraint and support the utility of mouse models in investigating human disease variants. Further research with larger sample sizes can refine constraint estimates in mice and enable more comprehensive comparisons of constraint between mouse and human orthologues.
Keywords: Mouse models; Negative selection; Selective constraint; Synonymous and nonsynonymous mutation.
© 2023. BioMed Central Ltd., part of Springer Nature.
Conflict of interest statement
The authors declare no competing interests.
Figures
Similar articles
-
Selection shapes the landscape of functional variation in wild house mice.BMC Biol. 2021 Nov 19;19(1):239. doi: 10.1186/s12915-021-01165-3. BMC Biol. 2021. PMID: 34794440 Free PMC article.
-
Nonsynonymous, synonymous and nonsense mutations in human cancer-related genes undergo stronger purifying selections than expectation.BMC Cancer. 2019 Apr 16;19(1):359. doi: 10.1186/s12885-019-5572-x. BMC Cancer. 2019. PMID: 30991970 Free PMC article.
-
Nonsynonymous Polymorphism Counts in Bacterial Genomes: a Comparative Examination.Appl Environ Microbiol. 2020 Dec 17;87(1):e02002-20. doi: 10.1128/AEM.02002-20. Print 2020 Dec 17. Appl Environ Microbiol. 2020. PMID: 33097502 Free PMC article.
-
Variation in synonymous substitution rates among mammalian genes and the correlation between synonymous and nonsynonymous divergences.J Mol Evol. 1995 Dec;41(6):717-20. doi: 10.1007/BF00173150. J Mol Evol. 1995. PMID: 8587116 Review.
-
Copy number variants and selective sweeps in natural populations of the house mouse (Mus musculus domesticus).Front Genet. 2014 Jun 3;5:153. doi: 10.3389/fgene.2014.00153. eCollection 2014. Front Genet. 2014. PMID: 24917877 Free PMC article. Review.
References
-
- Bartha I, di Iulio J, Venter JC, Telenti A. Human gene essentiality. Nat Rev Genet. 2018;19:51–62. - PubMed
-
- Subramanian S. High proportions of deleterious polymorphisms in constrained human genes. Mol Biol Evol. 2011;28:49–52. - PubMed
-
- Rosenthal N, Brown S. The mouse ascending: perspectives for human-disease models. Nat Cell Biol. 2007;9:993–9. - PubMed
MeSH terms
LinkOut - more resources
Full Text Sources
