. 2023 Sep 22;23(1):447.
doi: 10.1186/s12870-023-04462-x.

GhIMP10D, an inositol monophosphates family gene, enhances ascorbic acid and antioxidant enzyme activities to confer alkaline tolerance in Gossypium hirsutum L

Affiliations

GhIMP10D, an inositol monophosphates family gene, enhances ascorbic acid and antioxidant enzyme activities to confer alkaline tolerance in Gossypium hirsutum L

Yapeng Fan et al. BMC Plant Biol. .

Abstract

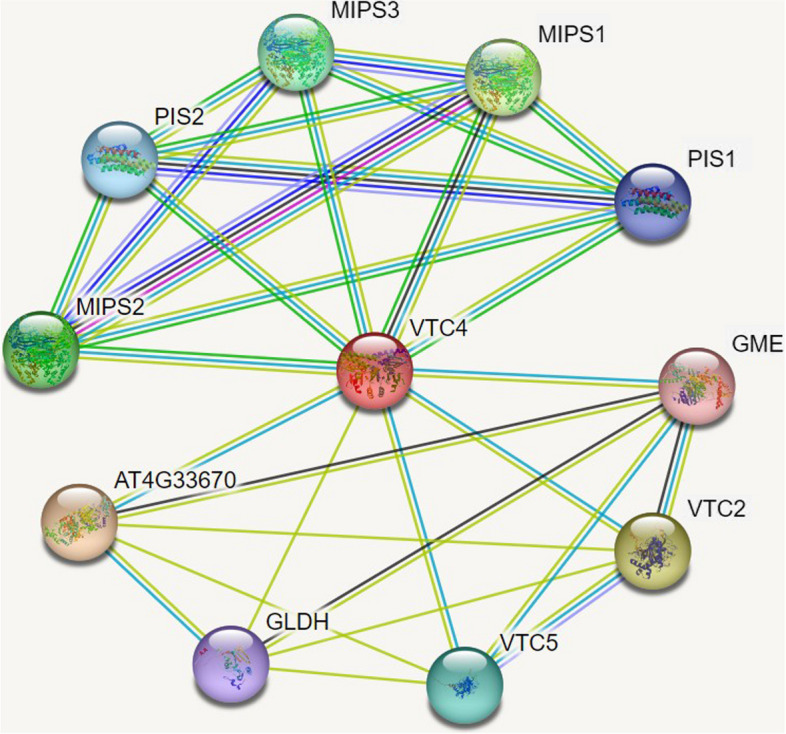
Background: Inositol monophosphates (IMP) are key enzymes in the ascorbic acid (AsA) synthesis pathways, which play vital roles in regulating plant growth and development and stresses tolerance. To date, no comprehensive analysis of the expression profile of IMP genes and their functions under abiotic stress in cotton has been reported.

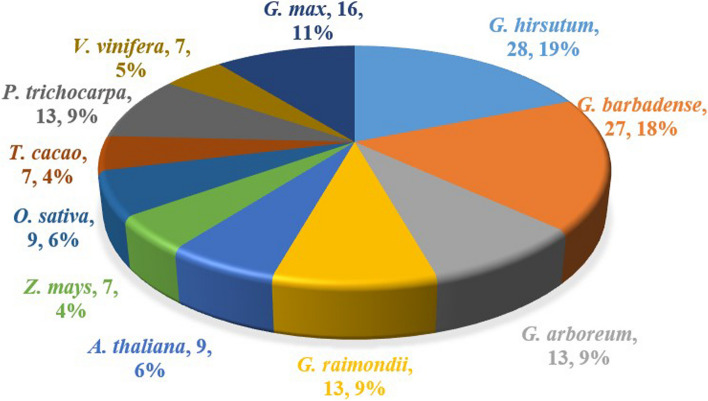
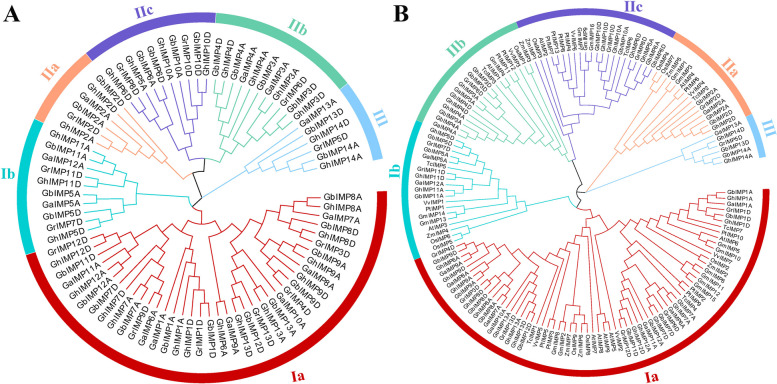
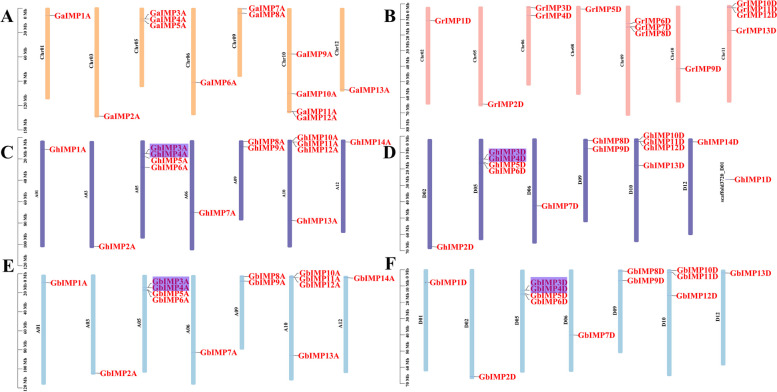
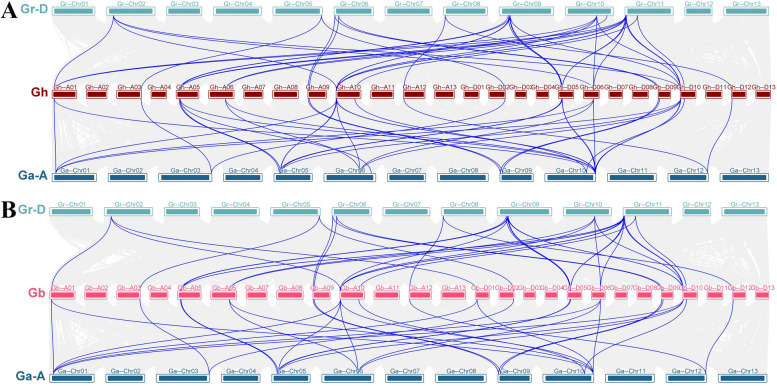
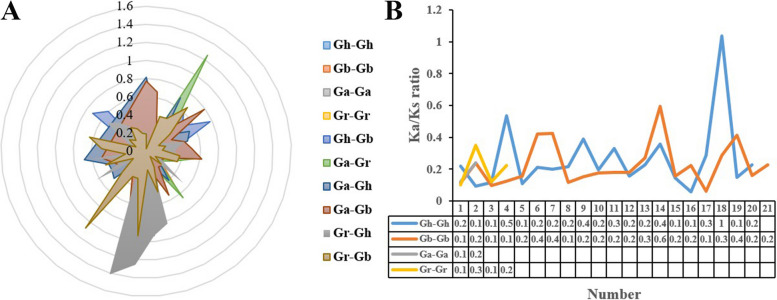
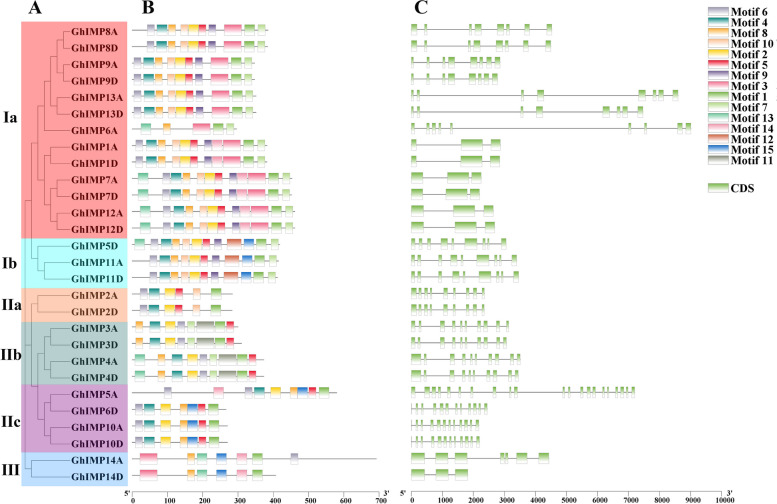
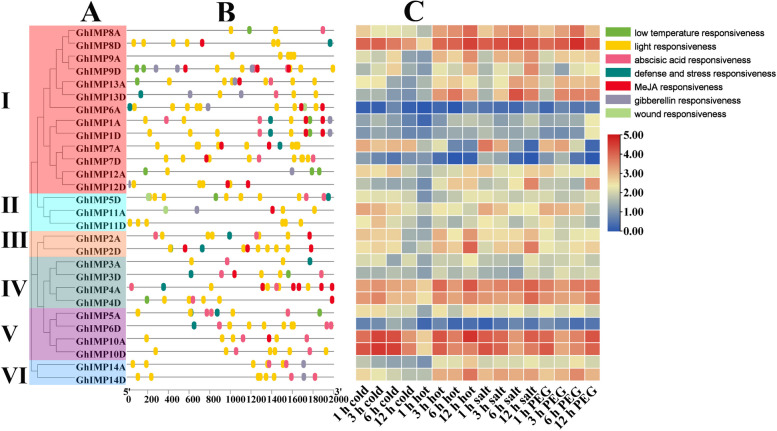
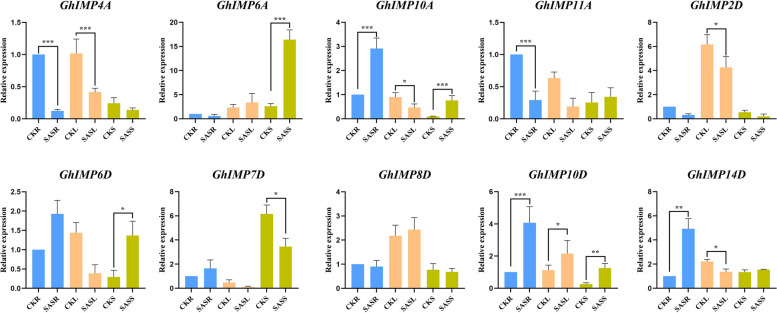
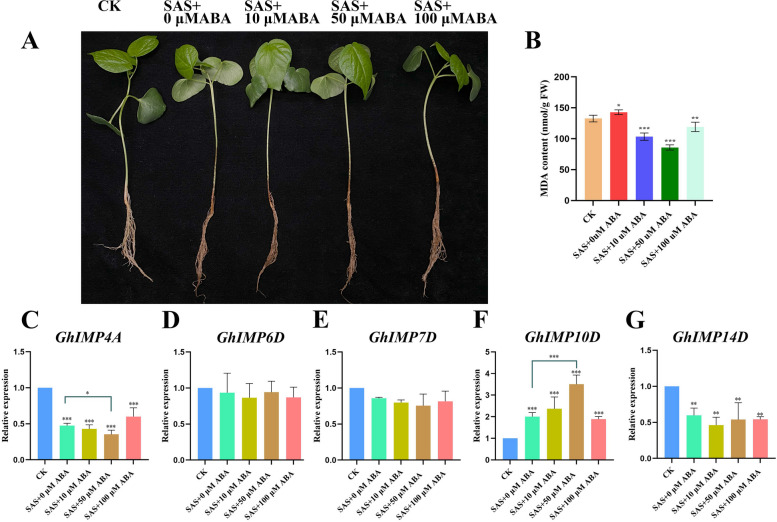
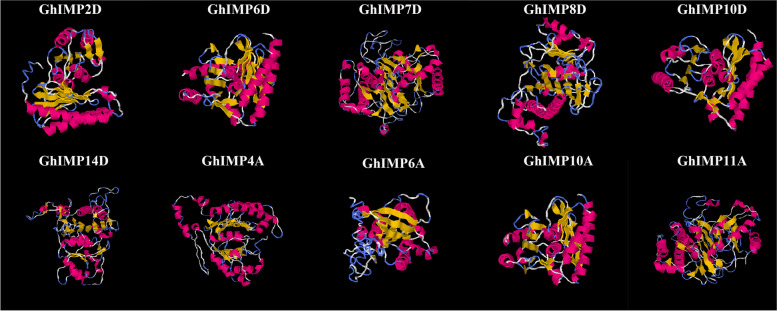
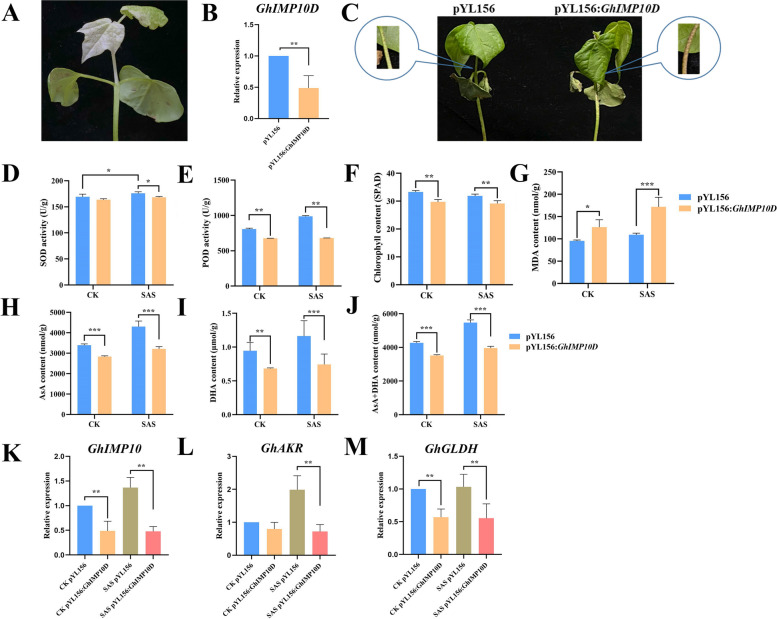
Results: In this study, the genetic characteristics, phylogenetic evolution, cis-acting elements and expression patterns of IMP gene family in cotton were systematically analyzed. A total of 28, 27, 13 and 13 IMP genes were identified in Gossypium hirsutum (G. hirsutum), Gossypium barbadense (G. barbadense), Gossypium arboreum (G. arboreum), and Gossypium raimondii (G. raimondii), respectively. Phylogenetic analysis showed that IMP family genes could cluster into 3 clades. Structure analysis of genes showed that GhIMP genes from the same subgroup had similar genetic structure and exon number. And most GhIMP family members contained hormone-related elements (abscisic acid response element, MeJA response element, gibberellin response element) and stress-related elements (low temperature response element, defense and stress response element, wound response element). After exogenous application of abscisic acid (ABA), some GhIMP genes containing ABA response elements positively responded to alkaline stress, indicating that ABA response elements played an important role in response to alkaline stress. qRT-PCR showed that most of GhIMP genes responded positively to alkaline stress, and GhIMP10D significantly upregulated under alkaline stress, with the highest up-regulated expression level. Virus-induced gene silencing (VIGS) experiment showed that compared with 156 plants, MDA content of pYL156:GhIMP10D plants increased significantly, while POD, SOD, chlorophyII and AsA content decreased significantly.

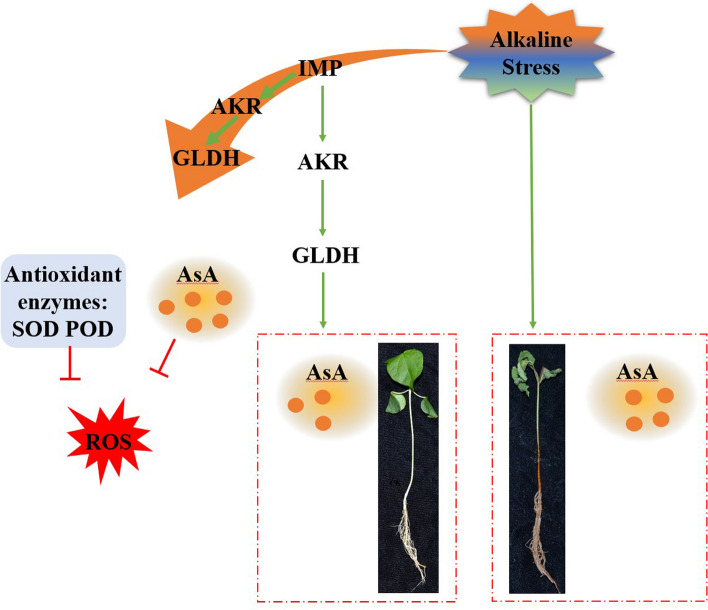
Conclusions: This study provides a thorough overview of the IMP gene family and presents a new perspective on the evolution of this gene family. In particular, some IMP genes may be involved in alkaline stress tolerance regulation, and GhIMP10D showed high expression levels in leaves, stems and roots under alkaline stress, and preliminary functional verification of GhIMP10D gene suggested that it may regulate tolerance to alkaline stress by regulating the activity of antioxidant enzymes and the content of AsA. This study contributes to the subsequent broader discussion of the structure and alkaline resistance of IMP genes in cotton.

Keywords: Alkaline tolerance; Ascorbic acid; Gossypium hirsutum L.; Inositol monophosphates.


Conflict of interest statement

The authors declare no competing interests.

Figures

Fig. 1
Fig. 1
Distribution of IMP genes among four Gossypium species and other 7 species
Fig. 2
Fig. 2
Phylogenetic trees of IMP genes in four Gossypium species and other 7 species. A Phylogenetic tree of the 81 IMP genes from four Gossypium species using MEGA 7 by the Neighbor-Joining (NJ) method. B Phylogenetic tree of the 149 IMP genes from four Gossypium species, A. thaliana, Z. mays, O. sativa, T. cacao, P. trichocarpa, V. vinifera and G. max using MEGA 7 by Maximum Likelihood (ML) method
Fig. 3
Fig. 3
Chromosomal location of IMP genes from four Gossypium species. A Chromosome distribution of IMP genes in G. arboretum. B Chromosome distribution of IMP genes in G. raimondii. C Chromosome distribution of IMP genes in G. hirsutum At sub-genome (GhAt). D Chromosome distribution of IMP genes in G. hirsutum Dt sub-genome (GhDt). E Chromosome distribution of IMP genes in G. barbadense At sub-genome (GbAt). F Chromosome distribution of IMP genes in G. barbadense Dt sub-genome (GbDt). The gene ID on each chromosome corresponds to the approximate location of each IMP gene. The purple shades were identified as tandem duplicated gene pairs
Fig. 4
Fig. 4
Syntenic relationship of duplicated IMP genes pairs from four Gossypium species. Lines with different color indicated different duplicated IMP gene pairs
Fig. 5
Fig. 5
Synteny analyses of IMP genes between two allotetraploid cotton species and two diploid cotton species. Gray lines in the background indicated the collinear blocks among different genomes, blue lines indicated the syntenic IMP gene pairs
Fig. 6
Fig. 6
Schematic diagram of non-synonymous (Ka) to synonymous (Ks) ratio in cotton. A Ka and Ks divergence values in ten different pairs. B Ka and Ks divergence values in Gh-Gh, Gb-Gb, Ga-Ga, Gr–Gr
Fig. 7
Fig. 7
Analysis of phylogenetic tree, conserved protein motifs, and gene structure of GhIMPs. A Phylogenetic tree of GhIMPs. B Conserved motifs of GhIMPs. C Gene structure of GhIMPs. The green box represents the exon, and black lines indicate the introns
Fig. 8
Fig. 8
Gene ontology (GO) annotations of GhIMP genes
Fig. 9
Fig. 9
Cis-acting element analysis and differentially expressed genes (DEGs) analysis of GhIMP genes. A Phylogenetic tree of GhIMPs. B Cis-acting elements in promoters of GhIMPs. C Heatmap of GhIMPs under cold, hot, salt, and PEG stress. The relative expression of heat map was characterized by log2 transformed
Fig. 10
Fig. 10
Expression analysis of GhIMP genes in response to SAS stress after 12 h in leaves, stems and roots using qRT-PCR assays. The mean values were from three independent biological replicates. Statistical analyses were performed by Student’s t-test (*P < 0.05, **P < 0.01 and *** P < 0.001). Notes: CK: ddH2O, SAS: 125 mM NaHCO3, R: Root, S: Stem, L: Leaf
Fig. 11
Fig. 11
Alleviating effect of exogenous ABA on cotton seedings under alkaline stress and expression levels of GhIMP genes contained ABA cis-acting elements. A Phenotypes of cotton seedlings treated with different concentrations of ABA under alkaline stress. B MDA content of cotton seedlings treated with different concentrations of ABA under alkaline stress. C-G The relative expression levels of GhIMP genes contained ABA cis-acting elements. Notes: SAS: 125 mM NaHCO3
Fig. 12
Fig. 12
3D structure of 10 GhIMP proteins. α-helices are indicated by red, β-strands are indicated by yellow, and random coils are indicated by blue
Fig. 13
Fig. 13
Protein interaction network of GhIMP10D. VTC4 is the corresponding name of GhIMP10D protein on String
Fig. 14
Fig. 14
VIGS experiments of the GhIMP10D gene and measurement of physiological indicators. A The true leaves of pYL156: PDS cotton showed bleaching, which proved that the VIGS system was effective. B qRT-PCR analysis of pYL156 and pYL156: GhIMP10D plants. C Phenotypes of pYL156 and pYL156: GhIMP10D cotton seedlings under alkaline stress. D-G Physiological indicators including SOD, POD, chlorophyII and MDA of pYL156 and pYL156: GhIMP10D cotton seedlings under ddH2O and alkaline treatment. H-J AsA, DHA and total AsA contents of pYL156 and pYL156: GhIMP10D cotton seedlings under ddH2O and alkaline treatment. K-M Relative expression of genes associated with the AsA synthesis pathway. Notes: SAS: 125 mM NaHCO3
Fig. 15
Fig. 15
A working model of the function of GhIMP10D modulates AsA and antioxidant enzyme to eliminate ROS under alkaline stress

Similar articles

Cited by

References

    1. Ayyub CM, Ali M, Shaheen MR, Qadri R, Khan I, Jahangir MM, Abbasi KY, Kamal S, Zain M. Enhancing the salt tolerance potential of watermelon (Citrullus lanatus) by exogenous application of salicylic acid. Am J Plant Sci. 2015;6(19):5.
    1. Munns R. Comparative physiology of salt and water stress. Plant Cell Environ. 2002;25(2):239–250. - PubMed
    1. Yang C, Chong J, Li C, Kim C, Shi D, Wang D. Osmotic adjustment and ion balance traits of an alkali resistant halophyte Kochia sieversiana during adaptation to salt and alkali conditions. Plant Soil. 2007;294(1–2):263–276.
    1. An YM, Song LL, Liu YR, Shu YJ, Guo CH. De Novo transcriptional analysis of Alfalfa in response to saline-alkaline stress. Front Plant Sci. 2016;7:931. - PMC - PubMed
    1. Apel K, Hirt H. Reactive oxygen species: metabolism, oxidative stress, and signal transduction. Annu Rev Plant Biol. 2004;55(1):373–399. - PubMed