. 2023 Sep 22;21(1):341.
doi: 10.1186/s12951-023-02086-9.

Engineering exosomes derived from subcutaneous fat MSCs specially promote cartilage repair as miR-199a-3p delivery vehicles in Osteoarthritis

Affiliations

Engineering exosomes derived from subcutaneous fat MSCs specially promote cartilage repair as miR-199a-3p delivery vehicles in Osteoarthritis

Shu Zhao et al. J Nanobiotechnology. .

Abstract

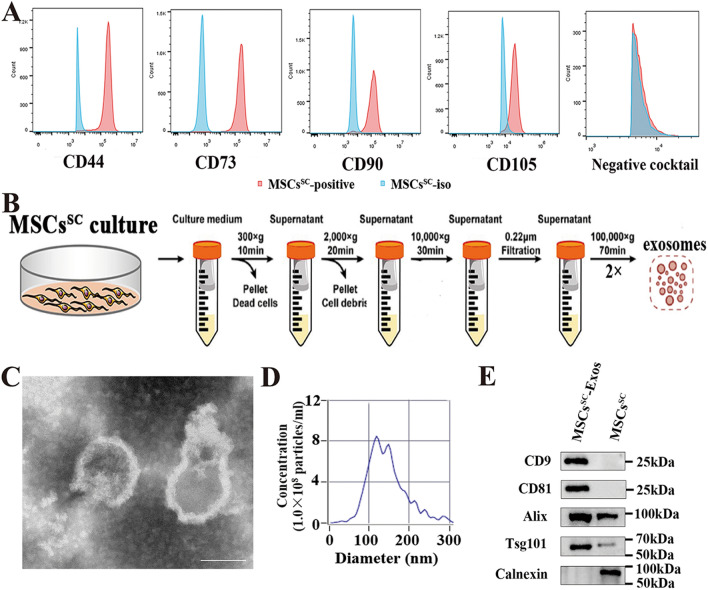
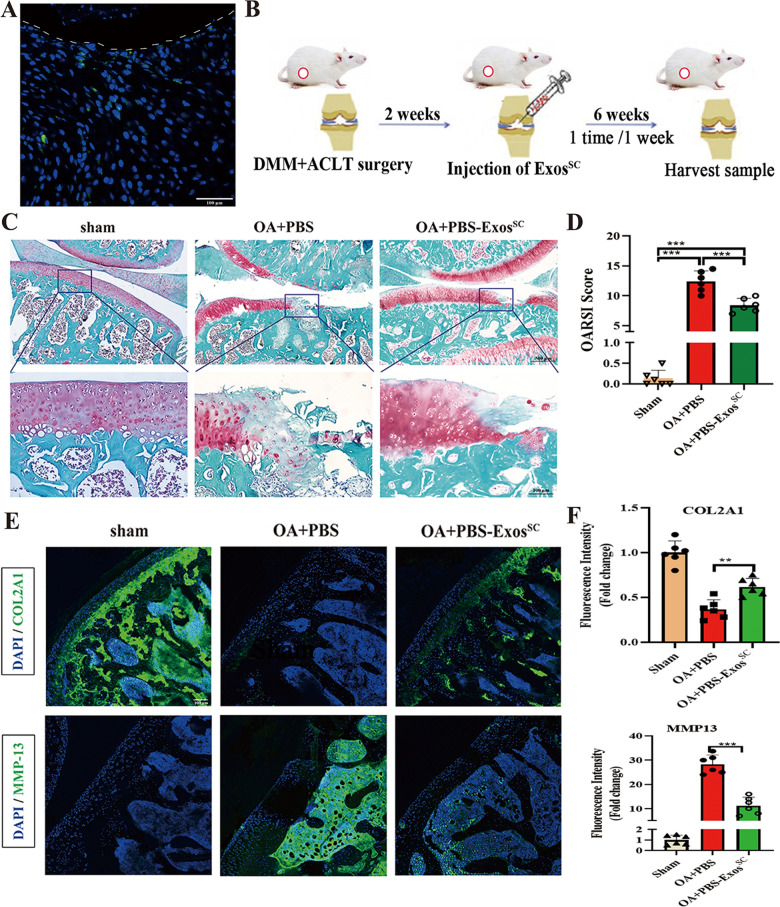
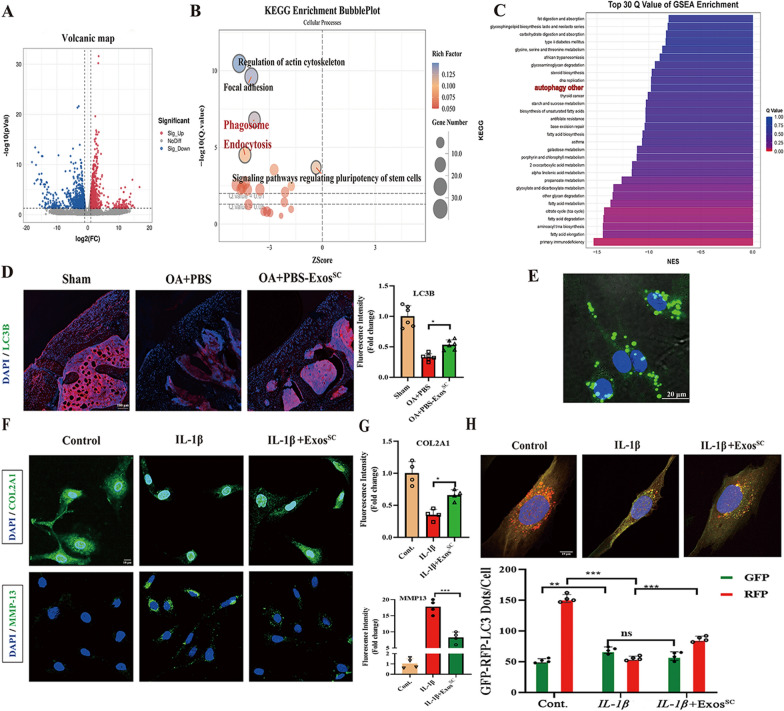
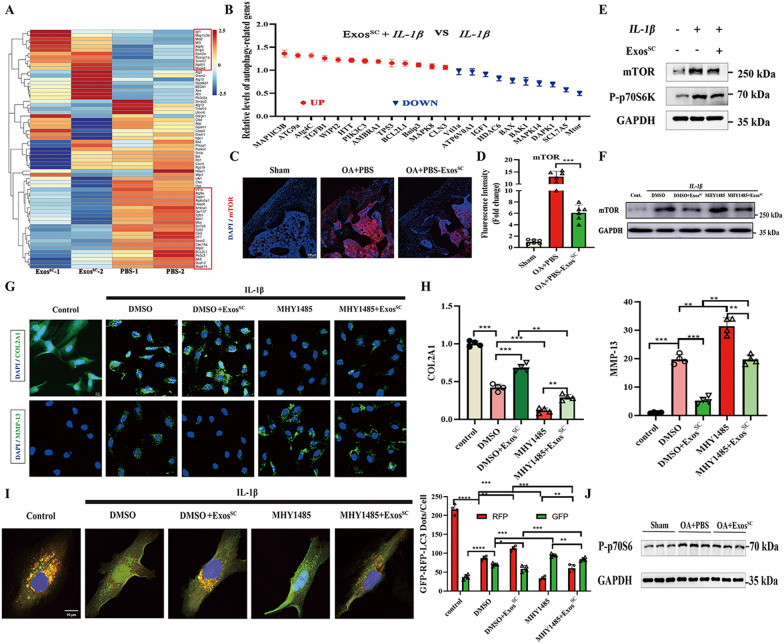
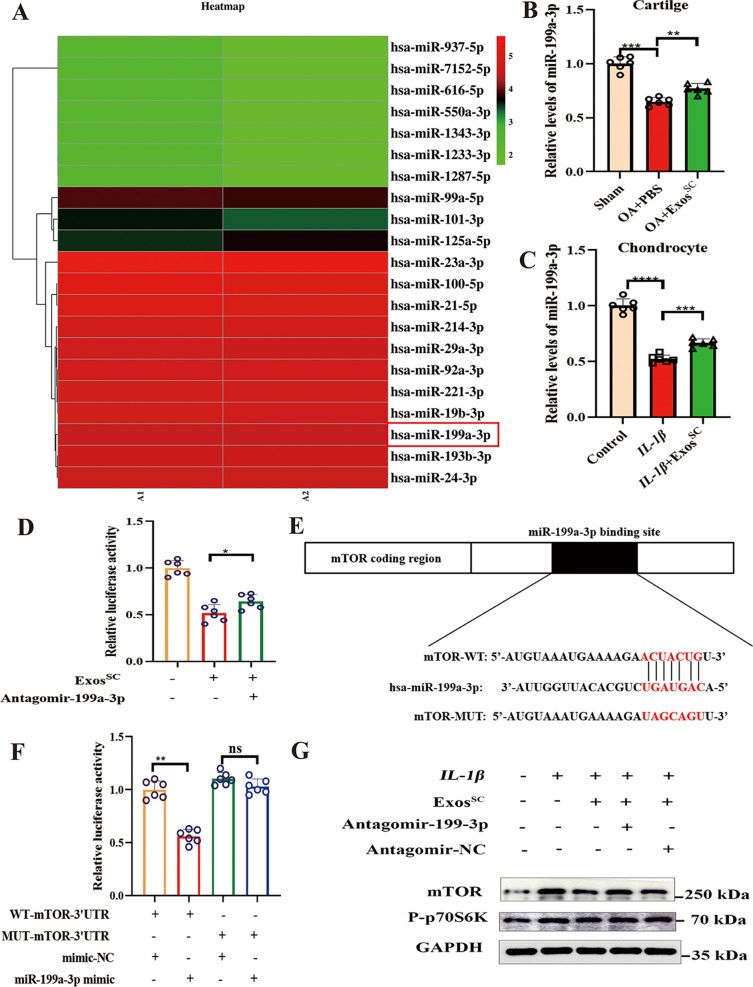
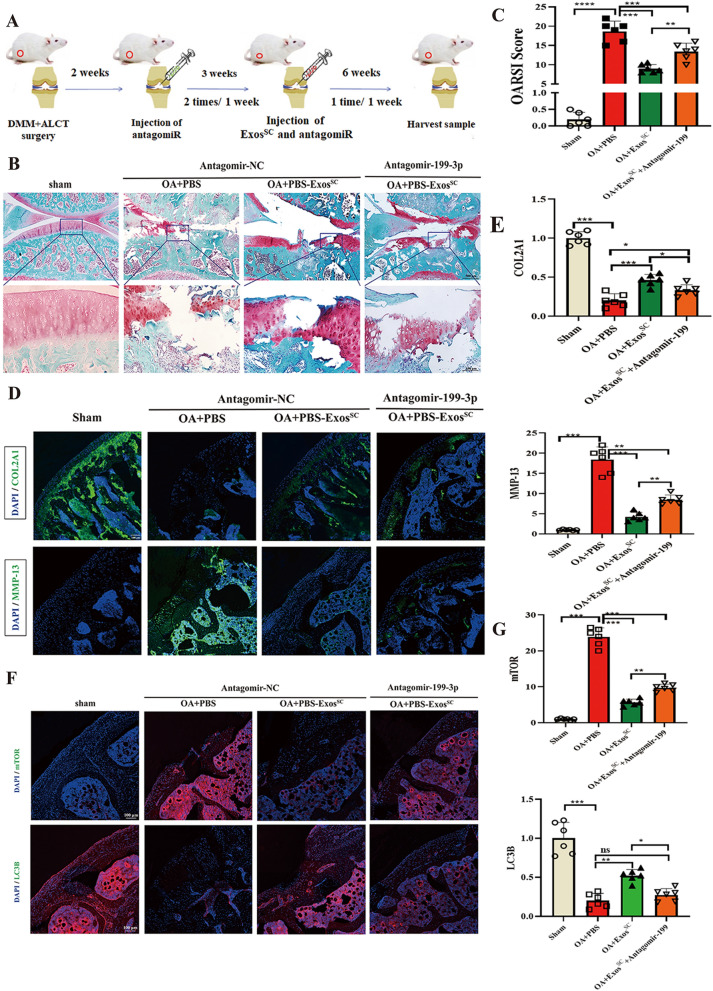
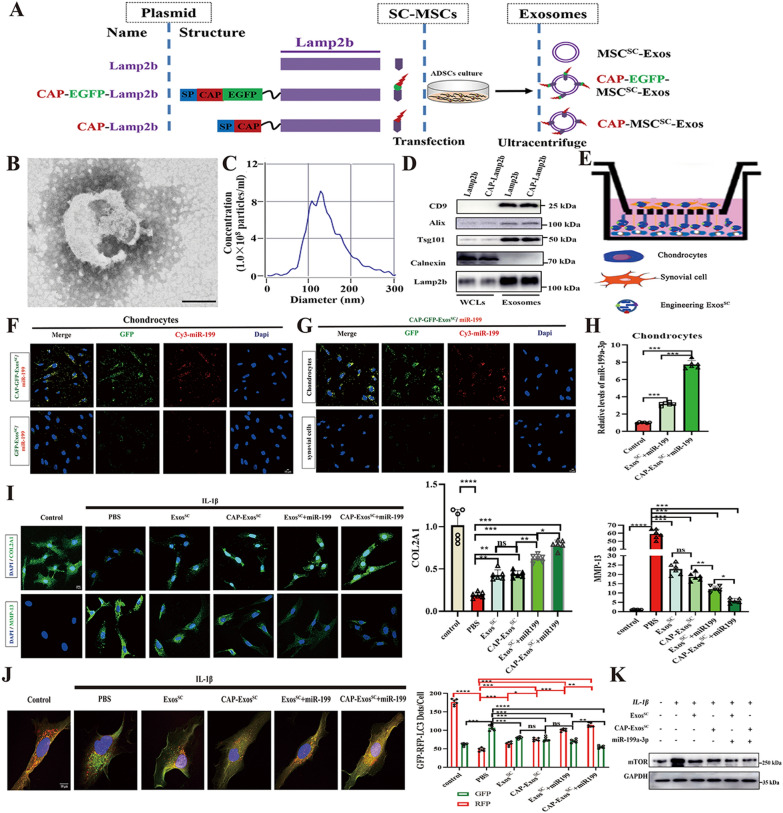
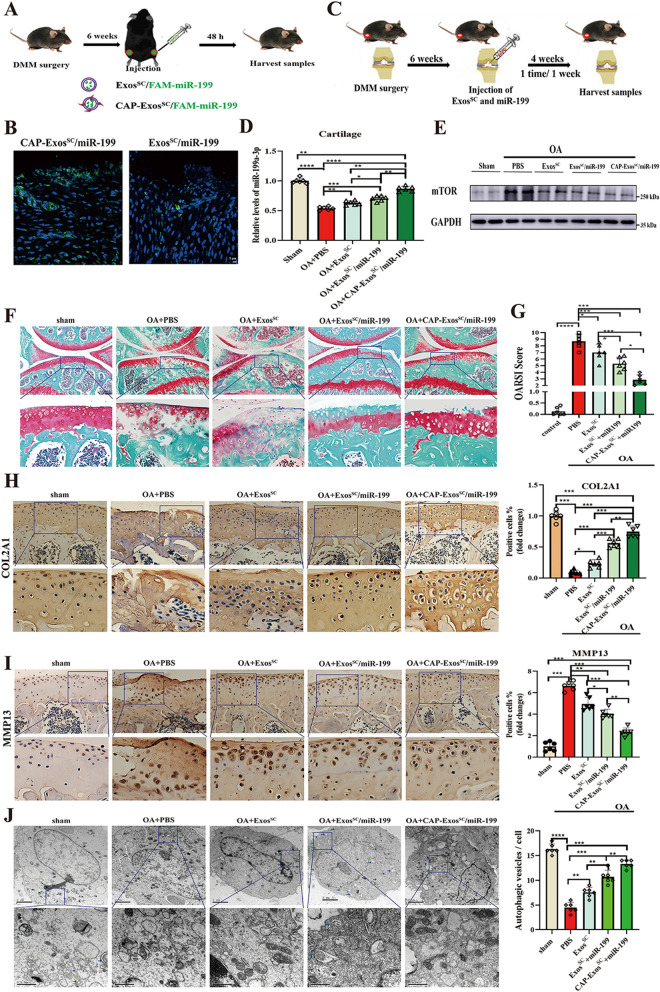
Osteoarthritis (OA) is a degenerative joint disease involving cartilage. Exosomes derived from Mesenchymal stem cells (MSCs) therapy improves articular cartilage repair, but subcutaneous fat (SC) stromal cells derived exosomes (MSCsSC-Exos), especially engineering MSCsSC-Exos for drug delivery have been rarely reported in OA therapy. This objective of this study was to clarify the underlying mechanism of MSCsSC-Exos on cartilage repair and therapy of engineering MSCsSC-Exos for drug delivery in OA. MSCsSC-Exos could ameliorate the pathological severity degree of cartilage via miR-199a-3p, a novel molecular highly enriched in MSCsSC-Exos, which could mediate the mTOR-autophagy pathway in OA rat model. Intra-articular injection of antagomiR-199a-3p dramatically attenuated the protective effect of MSCsSC-Exos-mediated on articular cartilage in vivo. Furthermore, to achieve the superior therapeutic effects of MSCsSC-Exos on injured cartilage, engineering exosomes derived from MSCsSC as the chondrocyte-targeting miR-199a-3p delivery vehicles were investigated in vitro and in vivo. The chondrocyte-binding peptide (CAP) binding MSCsSC-Exos could particularly deliver miR-199a-3p into the chondrocytes in vitro and into deep articular tissues in vivo, then exert the excellent protective effect on injured cartilage in DMM-induced OA mice. As it is feasible to obtain human subcutaneous fat from healthy donors by liposuction operation in clinic, meanwhile engineering MSCsSC-Exos to realize targeted delivery of miR-199a-3p into chondrocytes exerted excellent therapeutic effects in OA animal model in vivo. Through combining MSCsSC-Exos therapy and miRNA therapy via an engineering approach, we develop an efficient MSCsSC-Exos-based strategy for OA therapy and promote the application of targeted-MSCsSC-Exos for drug delivery in the future.

Keywords: Autophagy; Cartilage-targeted; Engineering exosomes; Osteoarthritis; miR-199a-3p.


Conflict of interest statement

The authors declare that they have no competing interests.

Figures

Fig. 1
Fig. 1
Identification of MSCsSC and MSCsSC-Exos. A Flow cytometry analysis of MSCsSC markers in P4-ADSCs, the solid red curves represent measured surface markers and the solid blue curves represent isotype controls. B Schematic illustration of MSCsSC-Exos isolation using differential centrifugation. C Transmission electron microscopy (TEM) analysis for the morphology of MSCsSC-Exos (Scale bar: 100 nm). D Nanoparticle tracking analysis (NTA) for measuring the size distribution and concentration of MSCsSC-Exos. E Western blot analysis of protein markers CD9, CD81, Alix, Tsg101, and Calnexin in MSCsSC-Exos and MSCsSC
Fig. 2
Fig. 2
MSCsSC-Exos treatment repairs the damaged articular cartilage in OA rat model. A Representative image of DiO-labelled MSCsSC-Exos were uptaken by the damaged cartilage. White dotted lines indicate articular surface and the green dots indicate DiO-labelled MSCsSC-Exos. Scale bar: 100 μm. B Schematic diagram of MSCsSC-Exos treatment strategy in OA rats. C Safranin O/fast green staining of cartilage morphology in each group rats, scale bar: 500 μm (up) and 100 μm (down). D The OARSI scoring system quantify the severity of cartilage destruction. n = 6 for each group. E and F The immunofluorescence analysis of COL2A1 and MMP-13 in articular cartilage of OA rat model. n = 6 for each group. Scale bar: 100 μm. * p < 0.05, ** p < 0.01, *** p < 0.001, **** p < 0.001, ns not significant
Fig. 3
Fig. 3
The autophagy level was up-regulated in OA rats treated with MSCsSC-Exos. A RNA-Seq analysis was conducted in total cartilage mRNA of OA rats, which was extracted from control group (PBS-treated, n = 2) and MSCsSC-Exos group (ExosSC-treated, n = 2). Volcanic map of different expression genes (DEGs) between control group and ExosSC group. Red spots represent up-regulated genes and blue spots represent down-regulated genes. B KEGG enrichment for control group and ExosSC group. C GSEA enrichment analysis of control group and ExosSC group. D The immunofluorescence analysis of LC3B in articular cartilage of OA rat model. n = 6 for each group. scale bar: 100 μm. E Representative image of DiO-labelled ExosSC absorbed by rat chondrocytes. Scale bar: 20 μm. F and G The immunofluorescence analysis of COL2A1 and MMP-13 in chondrocytes of OA model. n = 4 for each group. Scale bar: 10 μm. H Rat chondrocytes were infected with RFP-GFP-LC3 adenovirus and effects of ExosSC on RFP-GFP- LC3 puncta. The numbers of RFP- and GFP-LC3 dots per cell were counted. n = 4 for each group. Scale bar: 10 μm. * p < 0.05, ** p < 0.01, *** p < 0.001, **** p < 0.001, ns not significant
Fig. 4
Fig. 4
MSCsSC-Exos up regulated the autophagy process via inhibiting the mTOR expression. A Heatmap showing the hierarchical cluster of differential expression genes in OA cartilage treated with MSCsSC-Exos or PBS. B Relative expression levels of the autophagy-related genes in primary chondrocytes treated with IL-1β and MSCsSC-Exos by qRT-PCR. C, D The immunofluorescence analysis of mTOR in articular cartilage of OA rat model. n = 6 for each group. Scale bar: 100 μm. E Protein levels of mTOR and P-p70s6 were examined in chondrocytes treated with IL-1β and MSCsSC-Exos by western blotting. F Protein level of mTOR was examined by western blotting in chondrocytes treated with IL-1β, MSCsSC-Exos and MHY1485. G and H The immunofluorescence analysis of COL2A1 and MMP-13 in chondrocytes of OA chondrocytes treated with MHY1485. n = 4 for each group. Scale bar: 10 μm. I Rat chondrocytes were infected with RFP-GFP-LC3 adenovirus and effects of MHY1485 on RFP-GFP- LC3 puncta. The numbers of RFP- and GFP-LC3 dots per cell were counted. n = 4 for each group. Scale bar: 10 μm. J Protein levels of P-p70s6 were examined in articular cartilage in OA rat model by western blotting. * p < 0.05, ** p < 0.01, *** p < 0.001, **** p < 0.001, ns not significant
Fig. 5
Fig. 5
miR-199a-3p transferred by MSCsSC-Exos decrease the expression of mTOR in OA model. A Heatmap showing the hierarchical cluster of differential miRNA expression in MSCsSC-Exos. B The relative expression of miR-199a-3p on OA cartilage with MSCsSC-Exos treatment was detected by RT-PCR. C The relative expression of miR-199a-3p on chondrocytes with MSCsSC-Exos treatment was detected by qRT-PCR. D The effects of MSCsSC-Exos and antagomir-199a-3p on the luciferase activity of the IL-1β-induced chondrocytes. E Schematic representation of a predicted binding site of miR-199a-3p in the 3ʹUTR of mTOR mRNA, and the mutant mTOR 3ʹUTR. F The luciferase activity was determined using the dual-luciferase reporter system. G Protein levels of mTOR and P-p70s6 were examined by western blotting. * p < 0.05, ** p < 0.01, *** p < 0.001, **** p < 0.001, ns not significant
Fig. 6
Fig. 6
Antagomir-199a-3p abrogates MSCsSC-Exos therapeutic effect on damaged cartilage in OA model. A Schematic diagram of antagomiR-199a-3p and MSCsSC-Exos treatment strategy in OA rats. B Safranin O/fast green staining of cartilage morphology in each group rats, scale bar: 500 μm (up) and 100 μm (down). C The OARSI scoring system quantify the severity of cartilage destruction. n = 6 for each group. D and E The immunofluorescence analysis of COL2A1 and MMP-13 in articular cartilage in OA rat model. n = 6 for each group. Scale bar: 100 μm. F and G The immunofluorescence analysis of mTOR and LC3B in articular cartilage in OA rat model. n = 6 for each group. Scale bar: 100 μm. * p < 0.05, ** p < 0.01, *** p < 0.001, **** p < 0.001, ns not significant
Fig. 7
Fig. 7
A Schematic diagram of the plasmid constructs containing Lamp2b, CAP-EGFP-Lamp2b and CAP-Lamp2b, and the engineering exosomes derived from MSCsSC. B Transmission electron microscopy (TEM) analysis for the morphology of CAP-MSCsSC-Exos (Scale bar: 100 nm). C Nanoparticle tracking analysis (NTA) for measuring the size distribution and concentration of CAP-MSCsSC-Exos. D Western blot analysis of protein markers CD9, CD81, Alix, Tsg101, and Calnexin in whole cell lysates (WCLs) and purified exosomes including CAP-MSCsSC-Exos and MSCsSC-Exos. E Schematic illustration of rat chondrocytes and synovial cells co-culture assays. F Efficient delivery of miR-199a-3p into chondrocytes by CAP-EGFP-MSCsSC-Exos. Scale bar: 10 μm. G Specific delivery to chondrocytes instead of synovial cells by CAP-EGFP-MSCsSC-Exos. Scale bar: 10 μm. H The relative expression of miR-199a-3p in chondrocytes treated with different MSCsSC-Exos delivery systems was detected by RT-PCR. I The immunofluorescence analysis of COL2A1 and MMP-13 in chondrocytes of OA model treated with different MSCsSC-Exos delivery systems. n = 6 for each group. Scale bar: 10 μm. J Rat chondrocytes were infected with RFP-GFP-LC3 adenovirus and effects of different MSCsSC-Exos delivery systems on RFP-GFP- LC3 puncta. The numbers of RFP- and GFP-LC3 dots per cell were counted. n = 6 for each group. Scale bar: 10 μm. K Protein level of mTOR in chondrocytes of OA model treated with different MSCsSC-Exos delivery systems was examined by western blotting. * p < 0.05, ** p < 0.01, *** p < 0.001, **** p < 0.001, ns not significant
Fig. 8
Fig. 8
A Schematic illustration of the animal experimental procedure. MSCsSC-Exos or CAP-MSCsSC-Exos loading with FAM-miR-199a-3p were intra-articular injected into DMM-induced mice, and the joint samples were collected after 48 h. B Fluorescent images of cartilage tissues treated with MSCsSC-Exos or CAP-MSCsSC-Exos loading with FAM-miR-199a-3p. scale bar: 5 μm. C Schematic diagram of different MSCsSC-Exos delivery systems treatment strategy in DMM-induced OA mice. D The relative expression of miR-199a-3p in cartilage tissues treated with different MSCsSC-Exos delivery systems was detected by RT-PCR in DMM-induced OA mice. E Protein level of mTOR in cartilage tissues treated with different MSCsSC-Exos delivery systems was examined by western blotting in DMM-induced OA mice. F Safranin O/fast green staining of cartilage morphology in each group mice, scale bar: 500 μm (up) and 100 μm (down).G The OARSI scoring system quantify the severity of cartilage destruction. n = 6 for each group. H and I The immunohistochemistry analysis of COL2A1 and MMP13 in articular cartilage of OA mice model. n = 6 for each group. Scale bar: 50 μm. J Transmission electron microscopy (TEM) image of autophagic vesicles in cartilage of OA mice. The white arrow indicates the cell bilayer membrane structure of autophagic vesicles. Scale bar: 0.5 μm. n = 6. * p < 0.05, ** p < 0.01, *** p < 0.001, **** p < 0.001, ns not significant

Similar articles

Cited by

References

    1. van der Kraan PM, van den Berg WB. Chondrocyte hypertrophy and osteoarthritis: role in initiation and progression of cartilage degeneration? Osteoarthritis Cartilage. 2012;20:223–232. - PubMed
    1. Gao S, Zhao P, Lin C, Sun Y, Wang Y, Zhou Z, Yang D, Wang X, Xu H, Zhou F, et al. Differentiation of human adipose-derived stem cells into neuron-like cells which are compatible with photocurable three-dimensional scaffolds. Tissue Eng Part A. 2014;20:1271–1284. - PMC - PubMed
    1. Suri S, Walsh DA. Osteochondral alterations in osteoarthritis. Bone. 2012;51:204–211. - PubMed
    1. Liu-Bryan R, Terkeltaub R. Emerging regulators of the inflammatory process in osteoarthritis. Nat Rev Rheumatol. 2015;11:35–44. - PMC - PubMed
    1. Robinson WH, Lepus CM, Wang Q, Raghu H, Mao R, Lindstrom TM, Sokolove J. Low-grade inflammation as a key mediator of the pathogenesis of osteoarthritis. Nat Rev Rheumatol. 2016;12:580–592. - PMC - PubMed