

Microbial growth under drought is confined to distinct taxa and modified by potential future climate conditions
- PMID: 37736743
- PMCID: PMC10516970
- DOI: 10.1038/s41467-023-41524-y
Microbial growth under drought is confined to distinct taxa and modified by potential future climate conditions
Abstract
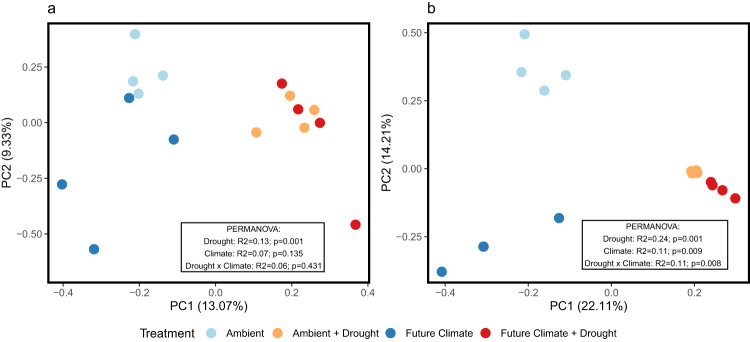
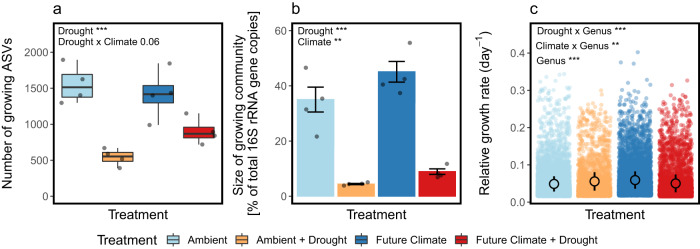
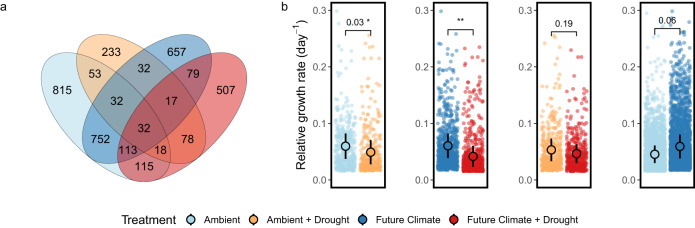
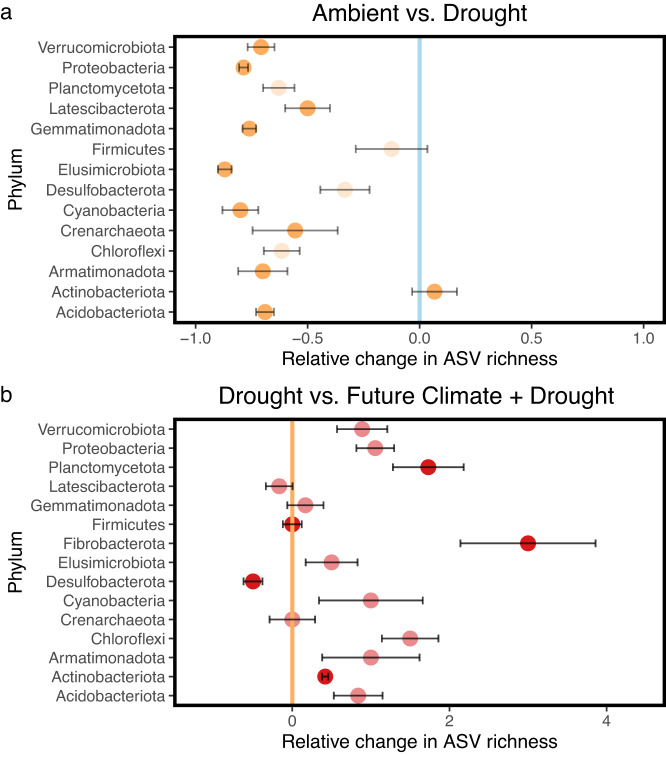
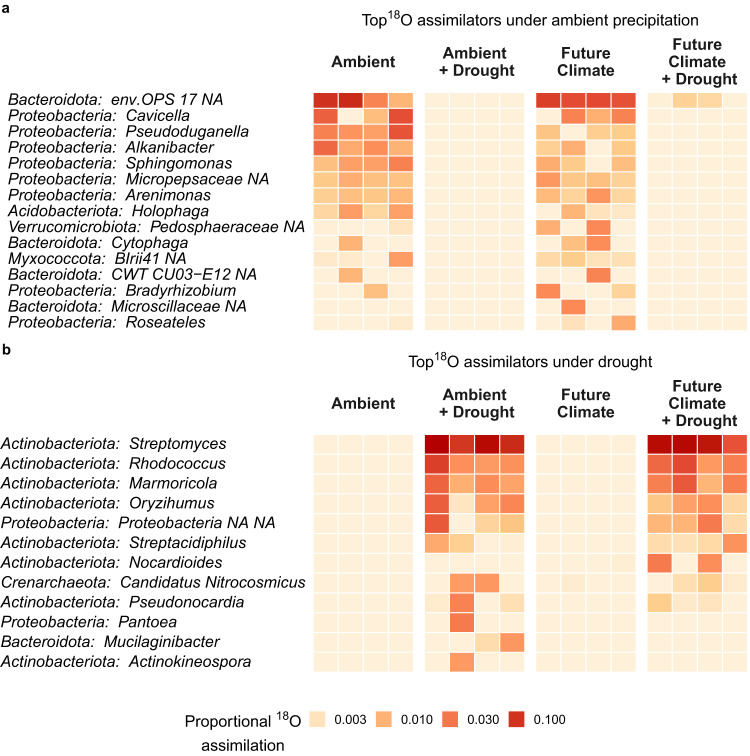
Climate change increases the frequency and intensity of drought events, affecting soil functions including carbon sequestration and nutrient cycling, which are driven by growing microorganisms. Yet we know little about microbial responses to drought due to methodological limitations. Here, we estimate microbial growth rates in montane grassland soils exposed to ambient conditions, drought, and potential future climate conditions (i.e., soils exposed to 6 years of elevated temperatures and elevated CO2 levels). For this purpose, we combined 18O-water vapor equilibration with quantitative stable isotope probing (termed 'vapor-qSIP') to measure taxon-specific microbial growth in dry soils. In our experiments, drought caused >90% of bacterial and archaeal taxa to stop dividing and reduced the growth rates of persisting ones. Under drought, growing taxa accounted for only 4% of the total community as compared to 35% in the controls. Drought-tolerant communities were dominated by specialized members of the Actinobacteriota, particularly the genus Streptomyces. Six years of pre-exposure to future climate conditions (3 °C warming and + 300 ppm atmospheric CO2) alleviated drought effects on microbial growth, through more drought-tolerant taxa across major phyla, accounting for 9% of the total community. Our results provide insights into the response of active microbes to drought today and in a future climate, and highlight the importance of studying drought in combination with future climate conditions to capture interactive effects and improve predictions of future soil-climate feedbacks.
© 2023. Springer Nature Limited.
Conflict of interest statement
The authors declare no competing interests.
Figures
Similar articles
-
Contrasting drivers of belowground nitrogen cycling in a montane grassland exposed to a multifactorial global change experiment with elevated CO2 , warming, and drought.Glob Chang Biol. 2022 Apr;28(7):2425-2441. doi: 10.1111/gcb.16035. Epub 2022 Jan 10. Glob Chang Biol. 2022. PMID: 34908205 Free PMC article.
-
Accumulation of soil carbon under elevated CO2 unaffected by warming and drought.Glob Chang Biol. 2019 Sep;25(9):2970-2977. doi: 10.1111/gcb.14699. Epub 2019 Jun 24. Glob Chang Biol. 2019. PMID: 31095816
-
Changes in the microbial community structure of bacteria, archaea and fungi in response to elevated CO(2) and warming in an Australian native grassland soil.Environ Microbiol. 2012 Dec;14(12):3081-96. doi: 10.1111/j.1462-2920.2012.02855.x. Epub 2012 Oct 8. Environ Microbiol. 2012. PMID: 23039205
-
Effects of water deficit stress on agronomic and physiological responses of rice and greenhouse gas emission from rice soil under elevated atmospheric CO2.Sci Total Environ. 2019 Feb 10;650(Pt 2):2032-2050. doi: 10.1016/j.scitotenv.2018.09.332. Epub 2018 Sep 29. Sci Total Environ. 2019. PMID: 30290346 Review.
-
Microbial drought resistance may destabilize soil carbon.Trends Microbiol. 2023 Aug;31(8):780-787. doi: 10.1016/j.tim.2023.03.002. Epub 2023 Apr 12. Trends Microbiol. 2023. PMID: 37059647 Review.
Cited by
-
Asymmetric winter warming reduces microbial carbon use efficiency and growth more than symmetric year-round warming in alpine soils.Proc Natl Acad Sci U S A. 2024 Oct 22;121(43):e2401523121. doi: 10.1073/pnas.2401523121. Epub 2024 Oct 14. Proc Natl Acad Sci U S A. 2024. PMID: 39401358 Free PMC article.
-
Harnessing co-evolutionary interactions between plants and Streptomyces to combat drought stress.Nat Plants. 2024 Aug;10(8):1159-1171. doi: 10.1038/s41477-024-01749-1. Epub 2024 Jul 24. Nat Plants. 2024. PMID: 39048724 Review.
-
The role of the plant microbiome for forestry, agriculture and urban greenspace in times of environmental change.Microb Biotechnol. 2024 Jun;17(6):e14482. doi: 10.1111/1751-7915.14482. Microb Biotechnol. 2024. PMID: 38858806 Free PMC article. Review.
-
Individual Versus Combined Effects of Warming, Elevated CO2 and Drought on Grassland Water Uptake and Fine Root Traits.Plant Cell Environ. 2025 Mar;48(3):2083-2098. doi: 10.1111/pce.15274. Epub 2024 Nov 18. Plant Cell Environ. 2025. PMID: 39552504 Free PMC article.
-
Codon bias, nucleotide selection, and genome size predict in situ bacterial growth rate and transcription in rewetted soil.Proc Natl Acad Sci U S A. 2025 Jan 21;122(3):e2413032122. doi: 10.1073/pnas.2413032122. Epub 2025 Jan 13. Proc Natl Acad Sci U S A. 2025. PMID: 39805015 Free PMC article.
References
-
- Cook BI, Mankin JS, Anchukaitis KJ. Climate change and drought: from past to future. Curr. Clim. Change Rep. 2018;4:164–179. doi: 10.1007/s40641-018-0093-2. - DOI
-
- Impacts of 1.5 °C Global Warming on Natural and Human Systems. in Global Warming of 1.5 °C: IPCC Special Report on Impacts of Global Warming of 1.5 °C above Pre-industrial Levels in Context of Strengthening Response to Climate Change, Sustainable Development, and Efforts to Eradicate Poverty (ed. Intergovernmental Panel on Climate Change (IPCC)) 175–312 (Cambridge University Press, 2022). 10.1017/9781009157940.005.
Publication types
MeSH terms
Substances
LinkOut - more resources
Full Text Sources
