

Detection and Quantitative Assessment of Arthroscopically Proven Long Biceps Tendon Pathologies Using T2 Mapping
- PMID: 37736979
- PMCID: PMC10514832
- DOI: 10.3390/tomography9050126
Detection and Quantitative Assessment of Arthroscopically Proven Long Biceps Tendon Pathologies Using T2 Mapping
Abstract
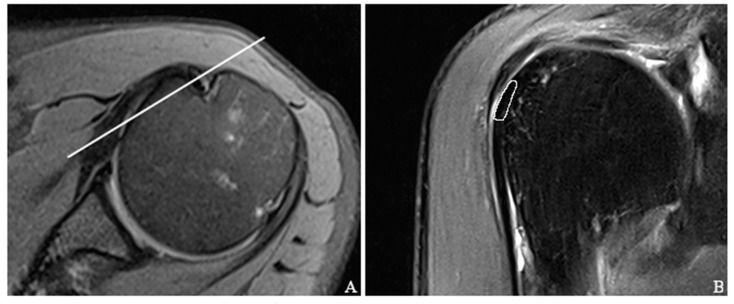
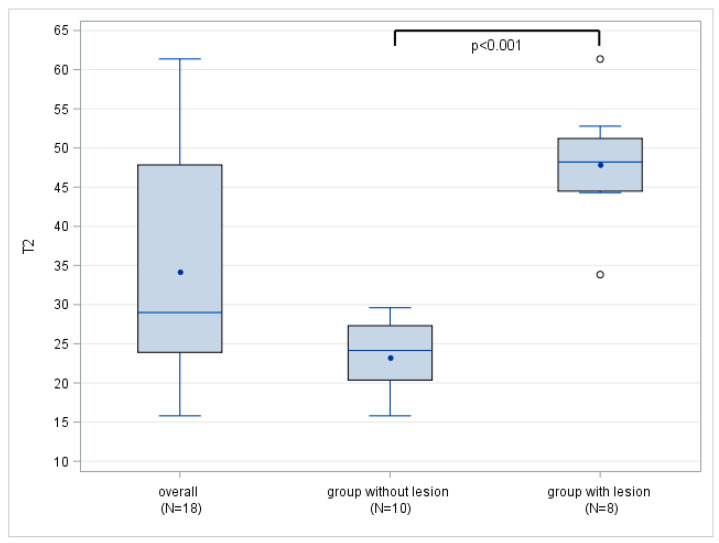
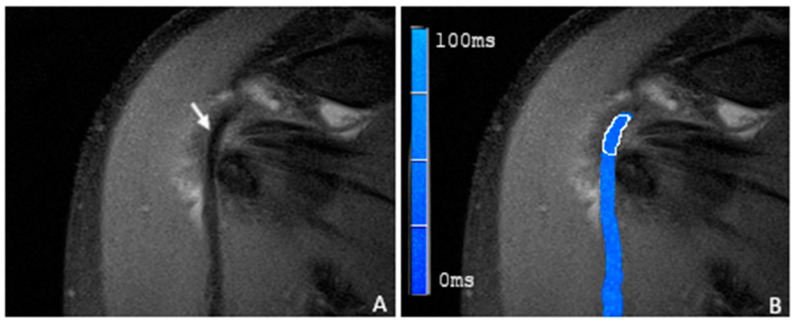
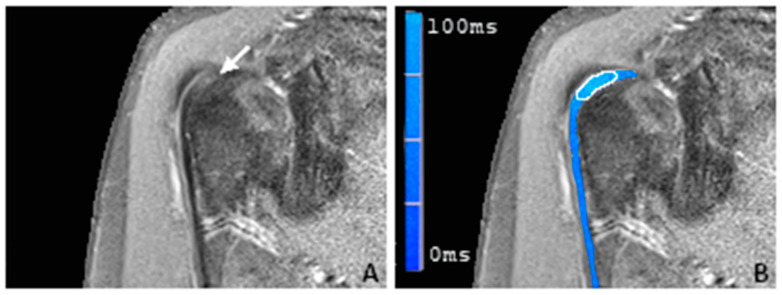
This study evaluates how far T2 mapping can identify arthroscopically confirmed pathologies in the long biceps tendon (LBT) and quantify the T2 values in healthy and pathological tendon substance. This study comprised eighteen patients experiencing serious shoulder discomfort, all of whom underwent magnetic resonance imaging, including T2 mapping sequences, followed by shoulder joint arthroscopy. Regions of interest were meticulously positioned on their respective T2 maps, capturing the sulcal portion of the LBT and allowing for the quantification of the average T2 values. Subsequent analyses included the calculation of diagnostic cut-off values, sensitivities, and specificities for the detection of tendon pathologies, and the calculation of inter-reader correlation coefficients (ICCs) involving two independent radiologists. The average T2 value for healthy subjects was measured at 23.3 ± 4.6 ms, while patients with tendinopathy displayed a markedly higher value, at 47.9 ± 7.8 ms. Of note, the maximum T2 value identified in healthy tendons (29.6 ms) proved to be lower than the minimal value measured in pathological tendons (33.8 ms), resulting in a sensitivity and specificity of 100% (95% confidence interval 63.1-100) across all cut-off values ranging from 29.6 to 33.8 ms. The ICCs were found to range from 0.93 to 0.99. In conclusion, T2 mapping is able to assess and quantify healthy LBTs and can distinguish them from tendon pathology. T2 mapping may provide information on the (ultra-)structural integrity of tendinous tissue, facilitating early diagnosis, prompt therapeutic intervention, and quantitative monitoring after conservative or surgical treatments of LBT.
Keywords: T2 mapping; arthroscopy; long biceps tendon; tendinopathy.
Conflict of interest statement
The authors declare no conflict of interest.
Figures
Similar articles
-
3-T T2 mapping magnetic resonance imaging for biochemical assessment of normal and damaged glenoid cartilage: a prospective arthroscopy-controlled study.Sci Rep. 2020 Sep 1;10(1):14396. doi: 10.1038/s41598-020-71311-4. Sci Rep. 2020. PMID: 32873848 Free PMC article.
-
3-Tesla T2 Mapping Magnetic Resonance Imaging for Evaluation of SLAP Lesions in Patients with Shoulder Pain: An Arthroscopy-Controlled Study.J Clin Med. 2023 Apr 25;12(9):3109. doi: 10.3390/jcm12093109. J Clin Med. 2023. PMID: 37176550 Free PMC article.
-
Quantitative MRI characterization of arthroscopically verified supraspinatus pathology: comparison of tendon tears, tendinosis and asymptomatic supraspinatus tendons with T2 mapping.Knee Surg Sports Traumatol Arthrosc. 2016 Jul;24(7):2216-24. doi: 10.1007/s00167-015-3547-2. Epub 2015 Mar 5. Knee Surg Sports Traumatol Arthrosc. 2016. PMID: 25739912
-
Accuracy of examination of the long head of the biceps tendon in the clinical setting: A systematic review.J Rehabil Med. 2019 Jul 8;51(7):479-491. doi: 10.2340/16501977-2563. J Rehabil Med. 2019. PMID: 31243466
-
How Accurate Are We in Detecting Biceps Tendinopathy?Clin Sports Med. 2016 Jan;35(1):47-55. doi: 10.1016/j.csm.2015.08.002. Epub 2015 Sep 28. Clin Sports Med. 2016. PMID: 26614468 Review.
Cited by
-
Advances in Musculoskeletal Imaging and Their Applications.J Clin Med. 2023 Oct 18;12(20):6585. doi: 10.3390/jcm12206585. J Clin Med. 2023. PMID: 37892722 Free PMC article.
References
Publication types
MeSH terms
LinkOut - more resources
Full Text Sources
