. 2023 Oct 13;133(9):758-771.
doi: 10.1161/CIRCRESAHA.123.322516. Epub 2023 Sep 22.

PPP1R12C Promotes Atrial Hypocontractility in Atrial Fibrillation

Affiliations

PPP1R12C Promotes Atrial Hypocontractility in Atrial Fibrillation

Srikanth Perike et al. Circ Res. .

Abstract

Background: Atrial fibrillation (AF)-the most common sustained cardiac arrhythmia-increases thromboembolic stroke risk 5-fold. Although atrial hypocontractility contributes to stroke risk in AF, the molecular mechanisms reducing myofilament contractile function remain unknown. We tested the hypothesis that increased expression of PPP1R12C (protein phosphatase 1 regulatory subunit 12C)-the PP1 (protein phosphatase 1) regulatory subunit targeting MLC2a (atrial myosin light chain 2)-causes hypophosphorylation of MLC2a and results in atrial hypocontractility.

Methods: Right atrial appendage tissues were isolated from human patients with AF versus sinus rhythm controls. Western blots, coimmunoprecipitation, and phosphorylation studies were performed to examine how the PP1c (PP1 catalytic subunit)-PPP1R12C interaction causes MLC2a dephosphorylation. In vitro studies of pharmacological MRCK (myotonic dystrophy kinase-related Cdc42-binding kinase) inhibitor (BDP5290) in atrial HL-1 cells were performed to evaluate PP1 holoenzyme activity on MLC2a. Cardiac-specific lentiviral PPP1R12C overexpression was performed in mice to evaluate atrial remodeling with atrial cell shortening assays, echocardiography, and AF inducibility with electrophysiology studies.

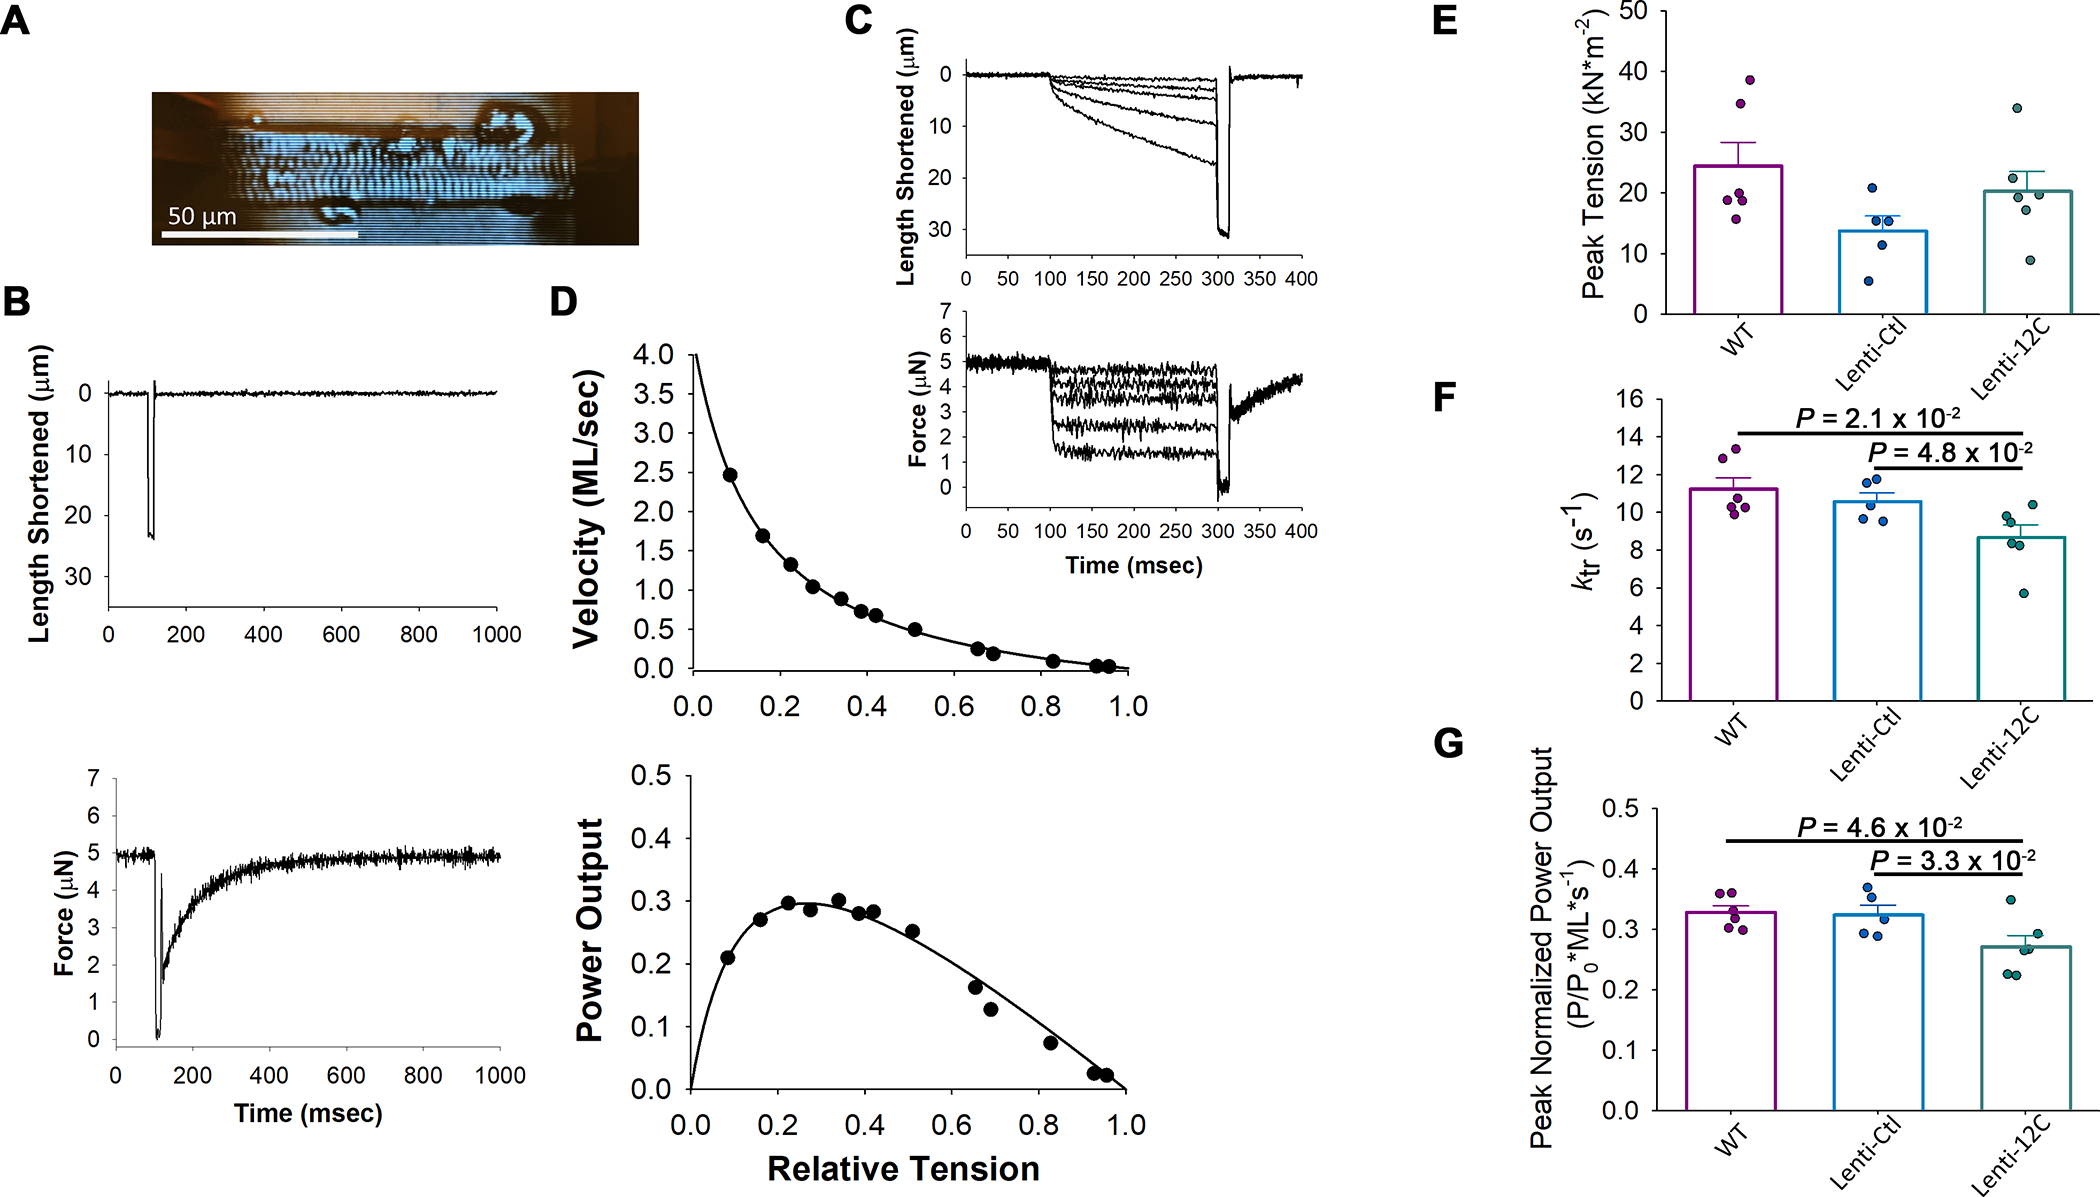
Results: In human patients with AF, PPP1R12C expression was increased 2-fold versus sinus rhythm controls (P=2.0×10⁻²; n=12 and 12 in each group) with >40% reduction in MLC2a phosphorylation (P=1.4×10⁻⁶; n=12 and 12 in each group). PPP1R12C-PP1c binding and PPP1R12C-MLC2a binding were significantly increased in AF (P=2.9×10⁻² and 6.7×10⁻³, respectively; n=8 and 8 in each group). In vitro studies utilizing drug BDP5290, which inhibits T560-PPP1R12C phosphorylation, demonstrated increased PPP1R12C binding with both PP1c and MLC2a and dephosphorylation of MLC2a. Mice treated with lentiviral PPP1R12C vector demonstrated a 150% increase in left atrial size versus controls (P=5.0×10⁻⁶; n=12, 8, and 12), with reduced atrial strain and atrial ejection fraction. Pacing-induced AF in mice treated with lentiviral PPP1R12C vector was significantly higher than in controls (P=1.8×10⁻² and 4.1×10⁻², respectively; n=6, 6, and 5).

Conclusions: Patients with AF exhibit increased levels of PPP1R12C protein compared with controls. PPP1R12C overexpression in mice increases PP1c targeting to MLC2a and causes MLC2a dephosphorylation, which reduces atrial contractility and increases AF inducibility. These findings suggest that PP1 regulation of sarcomere function at MLC2a is a key determinant of atrial contractility in AF.

Keywords: arrhythmias, cardiac; atrial fibrillation; myosin light chains; protein phosphatase 1; stroke volume.


Conflict of interest statement

Disclosures None.

Figures

Figure 1.
Figure 1.. Increased PPP1R12C expression in human AF is associated with reduced MLC2a phosphorylation.
A, Representative Western blot comparing the expression of PPP1R12C in human atrial tissues with SR or cAF. B, Quantification of PPP1R12C protein abundance. n=12 in each group. C, Representative Western blot and phosphorylation assays comparing the phosphorylation and abundance of MLC2a in cAF and SR tissues. D, Quantification of fold change in phosphorylation of MLC2a. n=12 in each group. E, Western blot comparing the expression of PP1c in human atrial tissues with SR or cAF. F, Quantification of PP1c abundance in AF versus SR atrial tissues. n=12 in each group. Data represent mean±SD. Data were determined to have a non-parametric distribution by the Shapiro-Wilk test, and were analyzed using the Mann-Whitney test. AU indicates arbitrary units; cAF, chronic atrial fibrillation; MLC2a, myosin light chain 2a; PP1c, protein phosphatase 1 catalytic subunit; PPP1R12C, protein phosphatase 1 regulatory subunit 12C; SR, sinus rhythm.
Figure 2.
Figure 2.. Enhanced PPP1R12C binding to PP1c and MLC2a in cAF versus SR.
A, Representative co-immunoprecipitation assay comparing PPP1R12C and PP1c binding in human cAF and SR atrial tissues. B, Quantification of PPP1R12C-PP1c protein binding. C, Representative co-immunoprecipitation assay showing PPP1R12C-MLC2a binding in human cAF and SR. D, Quantification of PPP1R12C-MLC2a binding. Data represent mean±SD. Data were determined to have a parametric distribution by the Shapiro-Wilk test, and were analyzed using unpaired 2-tailed Student’s t-test. cAF indicates chronic atrial fibrillation; IB, immunoblot; IgG, immunoglobulin G antibody control; IP, immunoprecipitate; MLC2a, myosin light chain 2a; NSB, non-specific binding negative control; PP1c, protein phosphatase 1 catalytic subunit; PPP1R12C, protein phosphatase 1 regulatory subunit 12C; SR, sinus rhythm.
Figure 3.
Figure 3.. Dephosphorylation of T560-PPP1R12C promotes binding to PP1c and MLC2a.
A, Co-IP studies demonstrating how the MRCK-inhibiting drug BDP5290 increases binding between PPP1R12C and PP1c versus DMSO control. B, Quantification of protein binding between PPP1R12C and PP1c in HL-1 cells. n = 8,8,9 in each group. C, Co-IP studies demonstrating that BDP5290 increases binding between PPP1R12C and MLC2a in atrial HL-1 cells. D, Quantification of protein binding between PPP1R12C and MLC2a. n = 6 per group. E, Phosphorylation assay showing the effects of BDP5290 on MLC2a phosphorylation in treated atrial HL-1 cells. F, Quantification of phosphorylation normalized to DMSO negative controls. n = 11 per group. Data represent mean±SD. A Shapiro-Wilk test determined that data distribution is non-parametric for Fig. 3A–B, and a Mann-Whitney and Kruskal-Wallis test were performed. Shapiro-Wilk tests for Fig. 3C–F showed a parametric distribution, and comparisons were analyzed using an unpaired 2-tailed Student’s t-test and ANOVA. AU indicates arbitrary unit; BDP, drug BDP5290; DMSO, dimethylsulfoxide; MLC2a, myosin light chain 2a; P, co-IP pulldown lane; PP1c, protein phosphatase 1 catalytic subunit; PPP1R12C, protein phosphatase 1 regulatory subunit 12C.
Figure 4.
Figure 4.. PPP1R12C protein expression is inversely proportional to MLC2a phosphorylation in mice.
A, Representative Western blot showing increased PPP1R12C abundance in mouse hearts transfected with lentiviral PPP1R12C-GFP construct (Lenti-12C) versus untreated wild-type (WT) and Lentiviral (Lenti-Ctl) controls. B, Quantification of PPP1R12C expression in WT versus Lenti-12C mice. n = 6,7,10 in each group. C, Quantification of MLC2a phosphorylation among the three mouse models. n = 9,5,8 in each group. Data represent mean±SD. Data for Fig. 4B were determined to have a parametric distribution and an unpaired 2-tail Student’s t-test and ANOVA were used for statistical comparison. Fig. 4C had a non-parametric distribution and data were compared with the Mann-Whitney and Kruskal-Wallis tests. Lenti-12C indicates lentiviral PPP1R12C-treated mice; Lenti-Ctl, lentiviral control mice without PPP1R12C gene insert; MLC2a, atrial myosin light chain 2; PPP1R12C, protein phosphatase 1 regulatory subunit 12C; WT, wild-type control mice.
Figure 5.
Figure 5.. Reduced cell shortening in atrial cells overexpressing PPP1R12C protein.
A, Representative tracings of contraction amplitude in cells isolated from wild type, Lenti-Ctl, and Lenti-12C mice. B, Quantification of contraction amplitude among the three mouse groups. Comparisons of paced cell parameters measured include: C, cell contraction duration ; D, relaxation time ; E, time to peak amplitude ; F, sarcomere length (μm); G, peak-to-peak time . Data represent mean±SD; comparisons between groups were evaluated with Student’s t-test and among groups with one-way ANOVA for data with parametric distribution (Fig. 5C,F), and were evaluated with Mann-Whitney and Kruskal-Wallis tests for data with non-parametric distribution (Fig. 5B, D, E, G). n=15 per group. AU indicates arbitrary units; Lenti-12C, experimental mice treated with lentiviral PPP1R12C insert; Lenti-Ctl, control mice treated with lentivirus without PPP1R12C insert; msec, milliseconds; sec, seconds; WT, wild type mice.
Figure 6.
Figure 6.. Contractile properties of mouse permeabilized atrial cardiac myocyte preparations.
A, Photomicrograph of a mouse permeabilized atrial cardiac myocyte preparation. B, Representative motor position (i.e., muscle preparation length (ML)) and force trace during a slack-re-stretch maneuver during maximal Ca2+ activation of an atrial cardiac myocyte preparation. The rate constant of force development (ktr) was calculated from a single exponential fit to the force development trace. C, Representative ML and force traces during a series of isotonic contractions (i.e., force clamps) during maximal Ca2+ activation of a mouse permeabilized atrial cardiac myocyte preparation. D, Representative force-velocity and power-load curves during maximal Ca2+ activation of a mouse permeabilized atrial cardiac myocyte preparation. E-G. Summary of peak tension, ktr values, and peak normalized power output in permeabilized atrial cardiac myocyte preparation from the three mouse groups. Both ktr and peak normalized power output were decreased in atrial myofilaments from Lenti-12C mouse hearts compared to WT and Lenti-Ctl mouse hearts. Data represent mean ± SE and comparisons between groups were evaluated by one-way ANOVA and passed normality and equal variance tests. Statistically significant differences between groups were determined by post-hoc analysis using a Student Newman Keuls test.
Figure 7.
Figure 7.. Increased PPP1R12C expression causes atrial enlargement and atrial hypocontractility.
A, Echocardiographic measurements of medio-lateral diameter of the left atrium during diastole. B-C, Representative echocardiogram images of the left atrial walls during systole (B) and diastole (C). D, Quantification of left atrial ejection fraction. E, Quantification of left atrial strain. F, Quantification of left ventricular ejection fraction. G, Plot of left atrial ejection fraction (y-axis) versus left ventricular ejection fraction (x-axis). Data are plotted with error bars indicating SD; the Shapiro-Wilk test determined parametric distribution of the data and comparisons among groups were evaluated with Student’s t-test and one-way ANOVA. n = 12,8,12 for panels A-C; n = 5,5,5 in each group for panels D-G. MLDd indicates medio-lateral diameter of the left atrium during diastole; PPP1R12C, protein phosphatase 1 regulatory subunit 12C; Lenti-12C, lentiviral PPP1R12C-treated mice; Lenti-Ctl, lentiviral control mice without PPP1R12C gene insert; WT, wild-type control mice.
Figure 8.
Figure 8.. Overexpression of PPP1R12C increases pacing-induced atrial fibrillation.
A, Representative surface electrocardiograms in mice receiving trans-esophageal atrial pacing. Lenti-12C mice are prone to pacing-induced AF. B, Quantification of AF burden among the three groups. Data are plotted with error bars indicating SD. Data were determined to have a parametric distribution by the Shapiro-Wilk test, and Student’s t-test was used to compare differences between groups and one-way ANOVA was used among groups. AF indicates atrial fibrillation; PPP1R12C, protein phosphatase 1 regulatory subunit 12C; Lenti-12C, lentiviral PPP1R12C-treated mice; Lenti-Ctl, lentiviral control mice without PPP1R12C gene insert; WT indicates wild-type control mice.

Update of

References

    1. Hart RG. Atrial fibrillation and stroke prevention. N Engl J Med. 2003;349:1015–1016. doi: 10.1056/NEJMp038123 - DOI - PubMed
    1. Page RL. Clinical practice. Newly diagnosed atrial fibrillation. N Engl J Med. 2004;351:2408–2416. doi: 10.1056/NEJMcp041956 - DOI - PubMed
    1. Savage N Physiology: Beating stroke. Nature. 2013;493:S12–13. doi: 10.1038/493S12a - DOI - PubMed
    1. Healey JS, Connolly SJ, Gold MR, Israel CW, Van Gelder IC, Capucci A, Lau CP, Fain E, Yang S, Bailleul C, et al. Subclinical atrial fibrillation and the risk of stroke. N Engl J Med. 2012;366:120–129. doi: 10.1056/NEJMoa1105575 - DOI - PubMed
    1. Lamas G How much atrial fibrillation is too much atrial fibrillation? N Engl J Med. 2012;366:178–180. doi: 10.1056/NEJMe1111948 - DOI - PubMed

Publication types

Substances