. 2023 Sep 22;14(1):5908.
doi: 10.1038/s41467-023-41540-y.

Circadian clock disruption promotes the degeneration of dopaminergic neurons in male Drosophila

Affiliations

Circadian clock disruption promotes the degeneration of dopaminergic neurons in male Drosophila

Michaëla Majcin Dorcikova et al. Nat Commun. .

Abstract

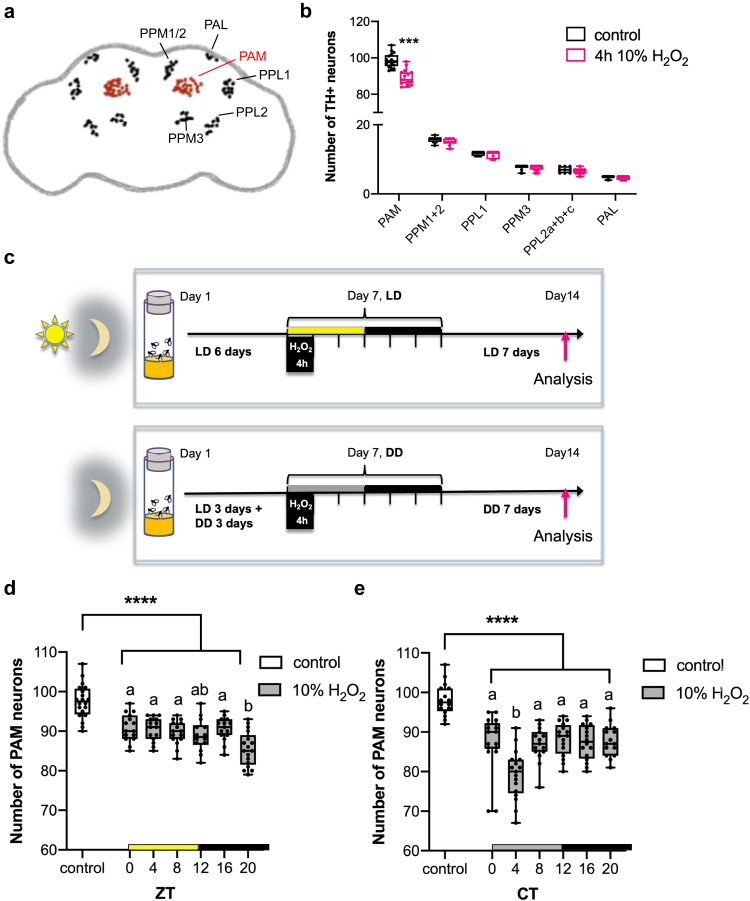
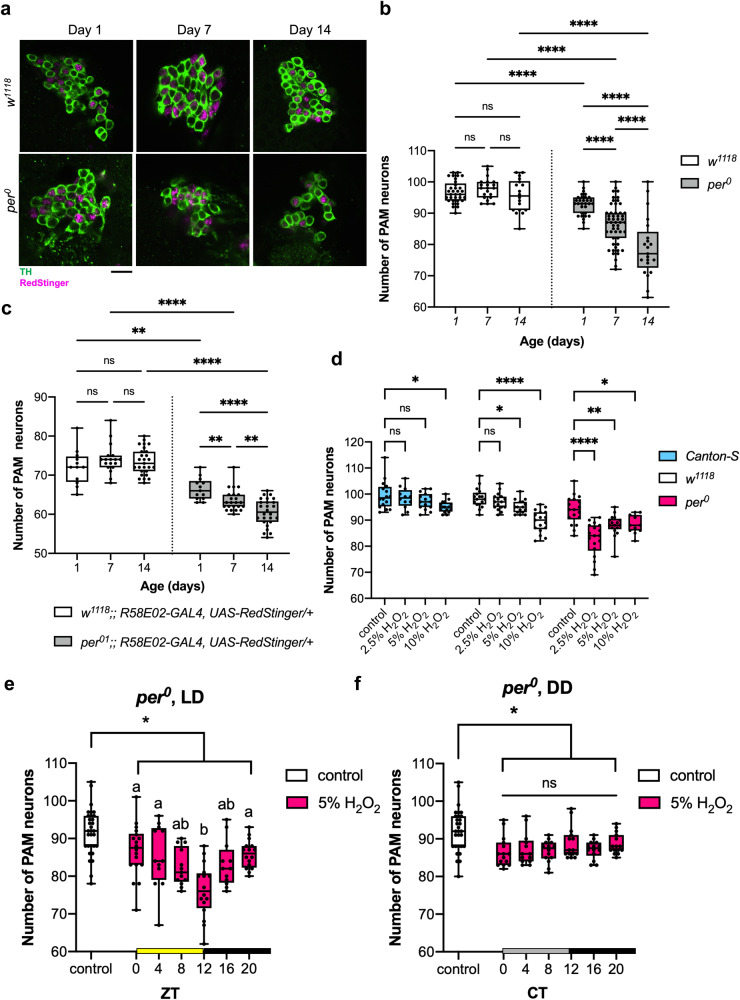
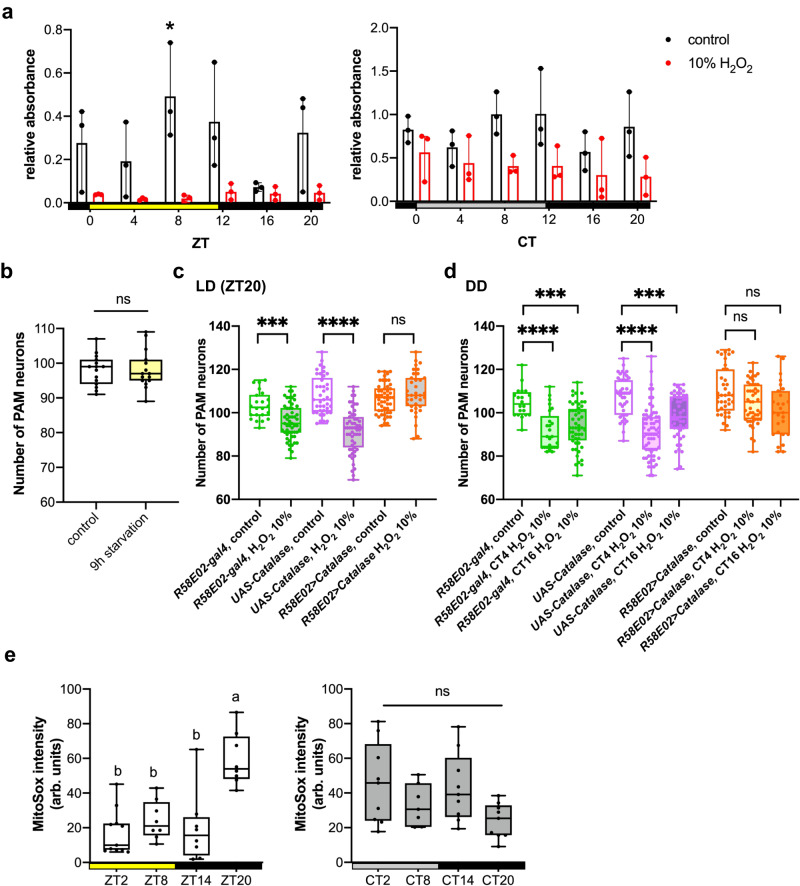
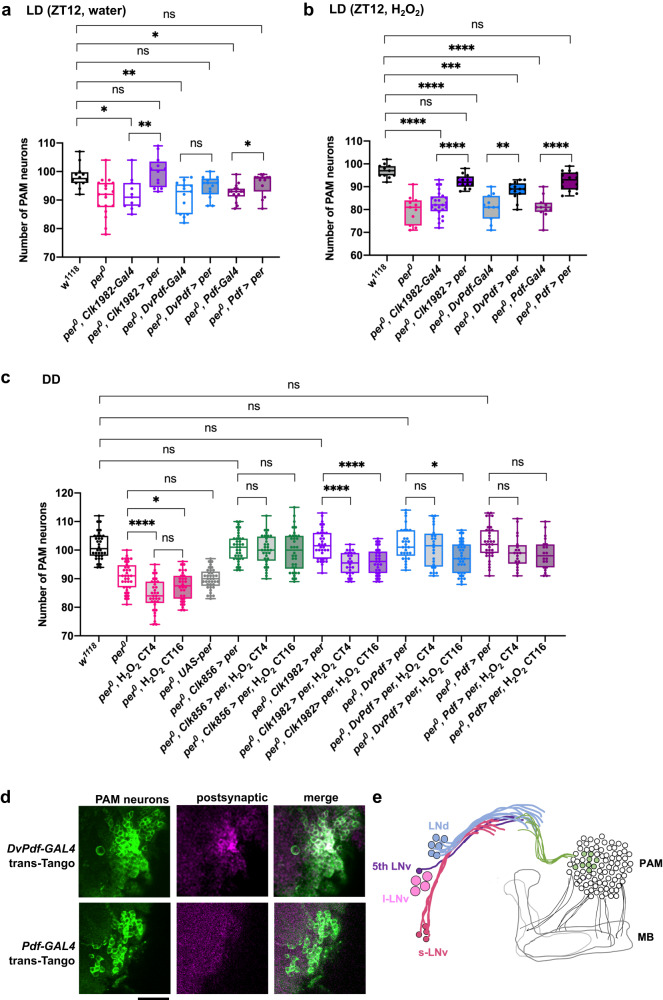
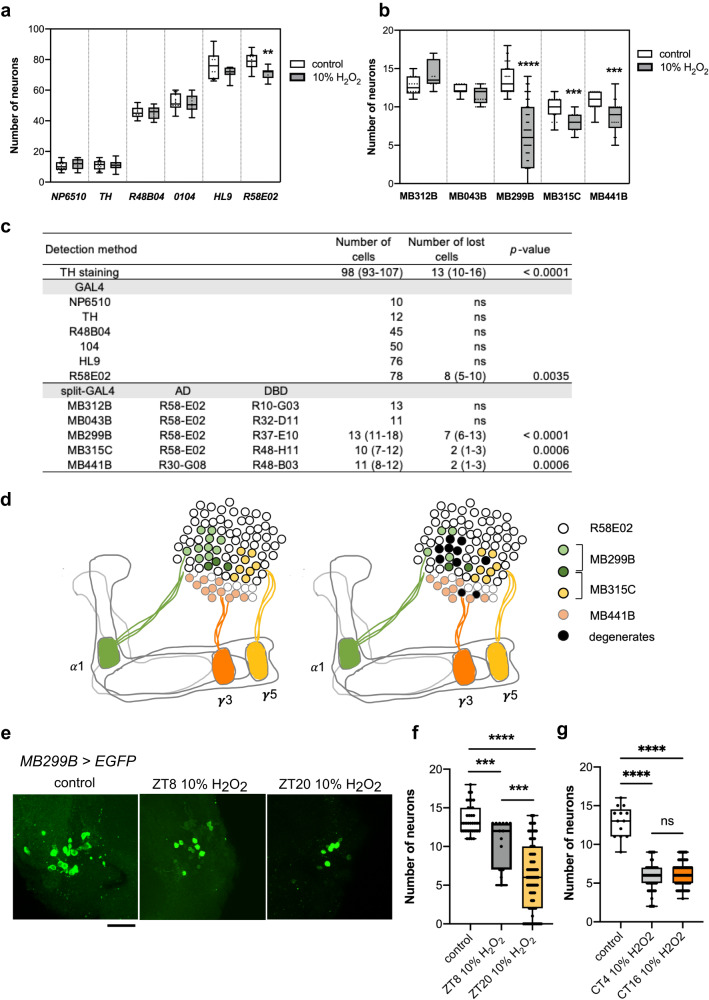
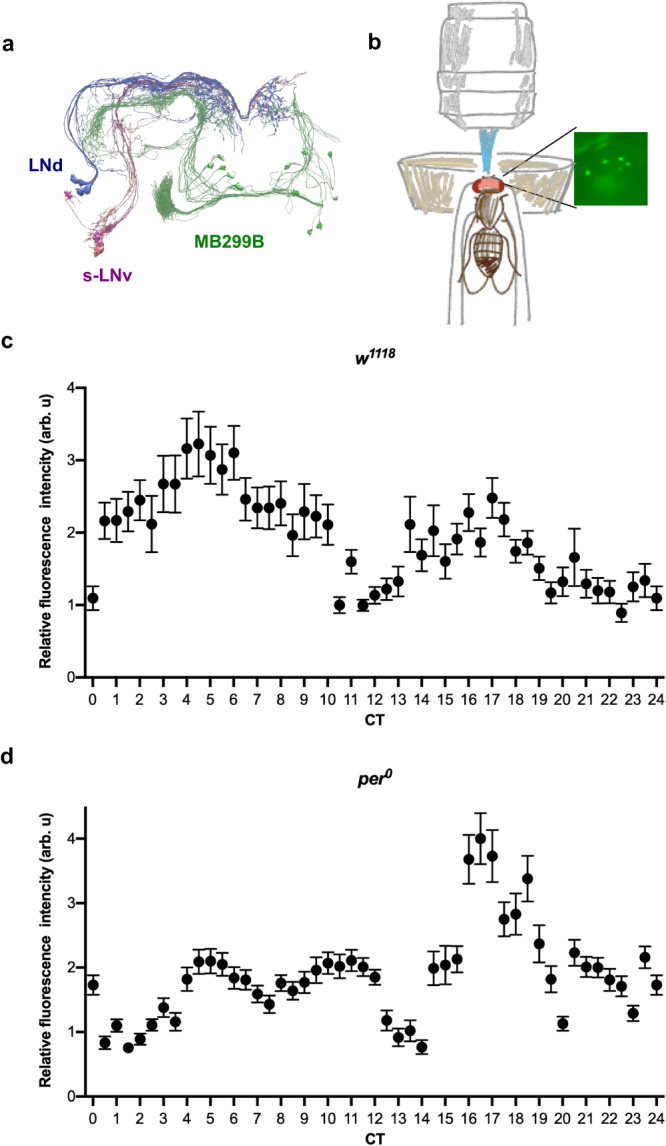
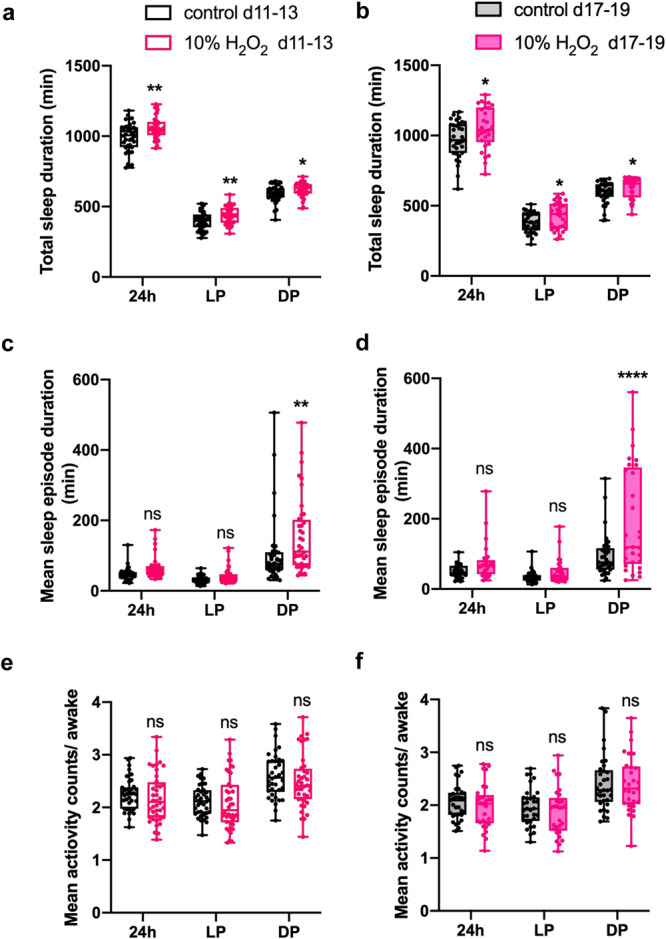
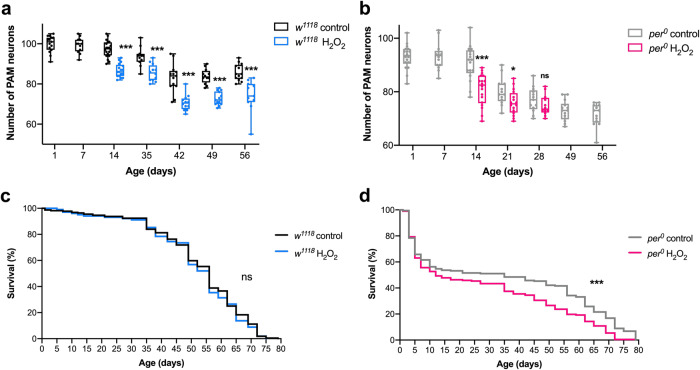
Sleep and circadian rhythm disruptions are frequent comorbidities of Parkinson's disease (PD), a disorder characterized by the progressive loss of dopaminergic (DA) neurons in the substantia nigra. However, the causal role of circadian clocks in the degenerative process remains uncertain. We demonstrated here that circadian clocks regulate the rhythmicity and magnitude of the vulnerability of DA neurons to oxidative stress in male Drosophila. Circadian pacemaker neurons are presynaptic to a subset of DA neurons and rhythmically modulate their susceptibility to degeneration. The arrhythmic period (per) gene null mutation exacerbates the age-dependent loss of DA neurons and, in combination with brief oxidative stress, causes premature animal death. These findings suggest that circadian clock disruption promotes dopaminergic neurodegeneration.


Conflict of interest statement

The authors declare no competing interests.

Figures

Fig. 1
Fig. 1. Rhythmic vulnerability of PAM neurons to oxidative stress.
a A schematic of the cell bodies of DA neuron clusters in the adult fly brain. PAM protocerebral anterior medial, PAL protocerebral anterior lateral, PPL1 and 2 protocerebral posterior lateral 1 and 2, PPM1, 2, and 3 protocerebral posterior medial 1, 2, and 3. b DA neuron counts in w1118 flies per hemisphere in each cluster 7 days after a 4-h 10% H2O2 treatment performed at ZT20. The control group was treated with water only. DA neurons were detected by anti-TH immunostaining. Neurodegeneration was observed only in the PAM cluster following the H2O2 treatment (n = 18 hemispheres analyzed for both groups). ***p < 0.0001 (two-tailed t-test, comparing the control and H2O2-treated groups). In box plots in this and all following figures, box boundaries are the 25th and 75th percentiles, the horizontal line across the box is the median, and the whiskers indicate the minimum and maximum values. The dots represent all data points. c A schematic of the circadian H2O2 treatment protocol. d, e Quantification of the number of PAM neurons after the 4-h 10% H2O2 treatment performed at different times in LD (control, n = 20; ZT0, 4, 8 and 16 n = 15 each; ZT12, n = 14; ZT16, n = 17 hemispheres) (d) or DD (control, n = 16; CT0, n = 18, CT4, n = 17; CT8 and 20, n = 15 each; CT12 and 16, n = 16 each) (e). The x-axis indicates the times when H2O2 was applied. The control group was treated with water only at ZT20 in LD (d) and CT20 in DD (e). At all time points, PAM neuron counts in the H2O2 treatment group are significantly smaller than those in the control group. ****p < 0.0001 (one-way ANOVA with Tukey’s post hoc test). Within the H2O2-treated group, flies treated at ZT20 in LD (d) and CT4 in DD (e) showed significantly greater cell loss than the treatment at any other time. Different lowercase letters represent statistical significance by one-way ANOVA with Tukey’s HSD post hoc test. Source data are provided as a Source Data file.
Fig. 2
Fig. 2. The clock gene per controls the magnitude and rhythms of the vulnerability of PAM neurons to oxidative stress.
a Representative maximum-projection images of PAM neurons in w1118 and per0 flies at indicated ages. PAM neurons were visualized by anti-TH antibodies (green) and RedStinger driven by the R58E02 driver (magenta). Approximately half of the neurons in the PAM cluster are visible. Scale bar, 20 µm. b, c The number of PAM neurons detected by anti-TH immunostaining (w1118 day1, n = 33; day7, n = 21; day14, n = 18 hemispheres. per0 day1, n = 31; day7, n = 52; day14, n = 21.) (b) and by the expression of R58E02-driven RedStinger (w1118 day1, n = 12; day7, n = 17; day14, n = 27 hemispheres. per0 day1, n = 13; day7, n = 23; day14, n = 26.) (c). per0 flies display developmental and age-dependent loss of PAM neurons. **p < 0.01 and ****p < 0.0001 (two-tailed t-test or two-tailed Mann–Whitney U test). d PAM neuron counts in Canton-S, w1118, and per0 were assessed by anti-TH staining 7 days after the treatment with different concentrations of H2O2. Treatment was performed from ZT1 for 4 h. (Canton-S control, n = 16, 2.5% H2O2, n = 12; 5%, n = 15; 10%, n = 16 hemispheres. w1118 control, n = 17; 2.5%, n = 16; 5%, n = 16; 10%, n = 17. per0 control, n = 18; 2.5%, n = 18; 5%, n = 17; 10%, n = 11.) per0 flies display increased PAM neuron susceptibility compared to control genotypes. *p < 0.05, ***p < 0.001, and ****p < 0.0001 (one-way ANOVA with Dunnett’s multiple comparisons test). e, f PAM neuron counts in per0 flies after a 4-h 5% H2O2 treatment were performed at different time points in LD (control, n = 31; ZT0, n = 18; ZT4, n = 12; ZT8, n = 13; ZT12, n = 16; ZT16, n = 12; ZT20, n = 16 hemispheres) (e) or DD (control, n = 30; CT0, n = 15; CT4, n = 13; CT8, n = 14; CT12, n = 15; CT16, n = 14; CT20, n = 15 hemispheres) (f). The x-axis indicates the time points when H2O2 was applied. The control group was treated with water only at ZT0 in LD (e) and CT0 in DD (f). At all time points, PAM neuron counts in the H2O2 treatment group were significantly smaller than those in the control group. *p < 0.05 (one-way ANOVA with Tukey’s HSD post hoc test). Within the H2O2-treated group, flies treated at ZT12 in LD (e) displayed a significantly greater cell loss than at any other time point. No difference was observed between time points in DD (f). Different lowercase letters represent statistical significance by one-way ANOVA with Tukey’s post hoc test. Source data are provided as a Source Data file.
Fig. 3
Fig. 3. Oxidative stress elicited by H2O2 ingestion but neither feeding rhythms nor dehydration causes circadian vulnerability of PAM neurons.
a Feeding patterns of w1118 flies in LD (left) and DD (right). Flies were fed for 4 h with 10% H2O2 solution containing blue dye. The control solution contained only water and blue food dye. n = 15–25 flies. The x-axis indicates the time points when the flies started to be fed. The y-axis represents the relative absorbance per ten flies. The dots represent the values of three independent experiments. Feeding levels in the control group at ZT8 were significantly higher than at other time points in LD. *p < 0.05 in any pairwise comparison (ANOVA with Tukey’s post hoc test). Error bars indicate the range. No significant difference was observed between time points in all other groups. b PAM neuron counts after 9 h of food and water deprivation, started at ZT15. The control group was deprived of food and water for 5 h, followed by 4 h of water access. n = 15 hemispheres for both groups. No significant difference between groups (t-test). c, d Catalase was expressed in PAM neurons with the R58E02 driver, and its effect on H2O2-induced PAM neuron loss was assessed by anti-TH immunostaining in LD (c) and DD (d). Catalase expression prevented PAM neuron loss following a 4-h 10% H2O2 treatment performed at ZT20 (c), as well as at CT4 and CT16 (d). The control group was treated with water at the same time point. ***p < 0.001 (p = 0.0004 in (c); p = 0.0004 between R58E02 control and CT16 H2O2, p = 0.0006 UAS-Catalase control vs. CT16 H2O2 in (d)) and ****p < 0.0001 (Kruskal–Wallis test with Dunn’s multiple comparisons test). In (c), R58E02 control, n = 22; H2O2, n = 54 hemispheres. UAS-Catalase control, n = 41; H2O2, n = 55. R58E02>Catalase, n = 50; H2O2, n = 37. In (d), R58E02 control, n = 20; CT4 H2O2, n = 25; CT16 H2O2 n = 52 hemispheres. UAS-Catalase control, n = 43; CT4 H2O2, n = 68; CT16 H2O2, n = 49. R58E02>Catalase control, n = 39; CT4 H2O2, n = 47; CT16 H2O2, n = 27. e ROS levels within the PAM neurons were measured using MitoSOX red in flies expressing EGFP with the R58E02 driver in LD (left) and DD (right). ZT2, n = 11; ZT 8, 14 and 20; 8 flies. CT2, 14 and 20, n = 9; CT8, n = 7. ROS levels are significantly elevated at ZT20 in LD but do not differ among time points in DD (ANOVA with Tukey’s post hoc test). Source data are provided as a Source Data file.
Fig. 4
Fig. 4. PER expression in clock neurons preserves PAM neurons.
ac Genetic rescue of per in clock neurons in per0 mutants. PAM neurons were counted using anti-TH staining 7 days after a control treatment with water (a) and after a 4-h treatment with 2.5% H2O2 performed at ZT12 in LD (b). In (c), the control group was treated with water at CT16, and 2.5% H2O2 treatment was performed at CT4 and CT16. Genotypes are indicated on the x-axis. a > b represents that UAS-transgene b is driven by the GAL4 driver a. n = 11–24 hemispheres (see Source Data for individual sample numbers). Rescue genotypes significantly improve the preservation of PAM neurons after the H2O2 treatment. *p < 0.05, **p < 0.01, ***p < 0.001, and ****p < 0.0001 (one-way ANOVA with Dunnett’s multiple comparisons test, or Kruskal–Wallis test with Dunn’s multiple comparisons test). All the rescue genotypes in (c) exhibit a significantly higher number of PAM neurons compared to per0 (****p < 0.0001 for each pairwise comparison, not shown in the figure for clarity). n = 11–19 (a), n = 11–24 (b), and n = 20–39 hemispheres (c). d trans-Tango experiments using DvPdf-GAL4 and Pdf-GAL4 combined with TH immunostaining (green). Several postsynaptic targets of DvPdf neurons (magenta) were identified as PAM neurons, whereas no postsynaptic signal of Pdf neurons was found within the PAM cluster. Presynaptic signals by DvPdf-GAL4 and Pdf-GAL are not visible in these pictures. Two independent experiments. Scale bar, 20 µm. e A schematic representation of the trans-Tango labeling results. Projections of the l-LNvs are not shown for clarity. DvPdf-GAL4- positive but Pdf-GAL4-negative neurons, i.e., LNds, are presynaptic to a subset of PAM neurons. Source data are provided as a Source Data file.
Fig. 5
Fig. 5. Identification of the vulnerable subpopulations of PAM neurons.
a, b Quantification of the number of neurons labeled by GFP driven with different PAM neuron drivers, 7 days after a 4-h 10% H2O2 treatment at ZT20. The controls were treated with water only. a UAS-EGFP was driven with classical GAL4 drivers as indicated in the x-axis. Among the drivers tested, only the R58E02-labeled neurons include a subpopulation vulnerable to oxidative insults. **p = 0.035 (two-tailed t-test). n = 7–25 hemispheres (see Source Data for individual sample numbers). b PAM subpopulations were labeled with split-GAL4 drivers. Neurons labeled by MB299B, MB441B, and MB315C contain vulnerable PAM subpopulations. ***p < 0.001 (p = 0.0009 MB441B control vs. H2O2; p = 0.0004 MB315C control vs. H2O2) and ****p < 0.0001 (two-tailed t-test). n = 8–98 hemispheres (see Source Data for individual sample numbers). c Summary of the results from (a) and (b). The mean number of cells labeled by the given driver and of cells lost following the H2O2 treatment are shown. The numbers in the brackets indicate the range of values. AD activation domain, DBD DNA-binding domain. d Schematic representation of PAM subpopulations vulnerable to oxidative stress. PAM-α1, -γ5, and -γ3 neurons are labeled by MB299B, MB315C, and MB441B, respectively, with three PAM-α1 neurons co-expressing MB299B and MB315C (left). H2O2 treatment selectively degenerates approximately half of the PAM-α1 neurons and a few cells each from the PAM-γ5 and -γ3 subgroups (right). e, f 4-h 10% H2O2 treatment was performed at ZT8 and ZT20, and the number of MB299B-positive neurons was quantified 7 days post-treatment. e Representative confocal images of MB299B>EGFP neurons. Scale bar, 20 µm. f Both experimental groups have significantly fewer remaining neurons than the control group treated with water only at ZT20. H2O2 treatment at ZT20 caused a greater loss of neurons than at ZT8. *** p < 0.001 (p = 0.0001 control vs. ZT8 H2O2; p = 0.0003 ZT8 vs. ZT20 H2O2) and **** p < 0.0001 (two-tailed t-test). Control, n = 37; ZT20 H2O2, n = 98, ZT8 H2O2, n = 14 hemispheres. g In DD, 10% H2O2 treatment performed at CT4 and CT16 both led to a significant loss of MB299B neurons compared to the water-only control treatment at CT4. ****p < 0.0001 (two-tailed Mann–Whitney test). The number of remaining MB299B neurons was similar between CT4 and CT16 treatments. Control, n = 13; CT4 H2O2, n = 55, CT16 H2O2, n = 71 hemispheres. Source data are provided as a Source Data file.
Fig. 6
Fig. 6. MB299B neurons display Ca2+rhythms.
a Projections of the LNds contact dendritic arbors of MB299B neurons. Image created using the hemibrain connectome data via the NeuPrint tool. b Illustration of the method for live GCaMP imaging. c, d MB299B > GCaMP7s fluorescence levels in MB299B neurons throughout 24 h on the first day in DD following LD-entrainment in w1118 (c) and per0 (d). Relative fluorescence intensity (mean ± SEM) was determined from three independent experiments. In (c), the analysis included an average of 79 (53–146 cells) cells per timepoint from 5–10 w1118 flies (see Source Data for individual sample numbers per timepoint). In (d), an average of 76 (44–131) cells per timepoint from 5–10 per0 flies were analyzed (see Source Data for individual sample numbers per timepoint). Source data are provided as a Source Data file.
Fig. 7
Fig. 7. A single short-term H2O2 treatment increases nighttime sleep.
Seven-day-old w1118 flies were treated with 10% H2O2 or water for 4 h starting at ZT20 in LD and then placed in the activity monitor. The sleep and activity of flies from age day 11 to 13 (d11-13) (control, n = 38; H2O2, n = 40 flies) and day 17 to 19 (d17-19) (control, n = 33; H2O2, n = 29 flies) were analyzed. a, b Total sleep duration over 24 h (24h), during daytime (light period, LP) and the night (dark period, DP) in water-only control and H2O2-treated flies from day 11 to 13 (a) and day 17 to 19 (b). H2O2-treated flies show an increase in total sleep in both age groups. *p < 0.05 and **p < 0.01 (two-way ANOVA with Šídák’s multiple comparisons test). c, d Mean sleep episode duration from day 11 to 13 (c) and day 17 to 19 (d). H2O2-treated flies show an increase in nighttime sleep episode duration in both age groups. **p < 0.01 and ****p < 0.0001 (two-way ANOVA with Šídák’s multiple comparisons test). e, f Mean activity counts during the wake period from day 11 to 13 (e) and day 17 to 19 (f). No significant difference was observed between the control and treated groups (two-way ANOVA with Šídák’s multiple comparisons test). Source data are provided as a Source Data file.
Fig. 8
Fig. 8. A single short-term H2O2 treatment causes premature death in per0 flies.
PAM neuron counts and survival of w1118 and per0 flies following a 4-h exposure to 10% H2O2 at ZT20 when flies were 7 days old. a, b PAM neuron counts across aging in w1118 (a) and per0 (b). PAM neuron loss was observed as early as day 14 in both genotypes compared to control groups treated with water only. Neurodegeneration progresses with age but is not accelerated in H2O2-treated flies. *p = 0.02 and ***p < 0.001 (two-tailed t-test). n = 12–20 hemispheres (see Source Data for individual sample numbers). Since H2O2-per0 flies exhibited a high mortality rate after 28 days, PAM neurons of this group were not examined thereafter. c, d % of surviving flies in w1118 (c) and per0 (d). H2O2 treatment did not affect the survival of w1118 flies, whereas H2O2-treated per0 flies had significantly reduced lifespans compared to the water-treated control group. ***p = 0.0002 (Log-rank test). In (c), n = 3 independent experiments for both control and H2O2 treatment, with a total of n = 324 w1118 flies for control and n = 262 for H2O2 treatment. In (d), n = 3 independent experiments for both the control and the H2O2-treated groups, with a total of n = 190 per0 flies for the control and n = 203 for the H2O2-treated group. Source data are provided as a Source Data file.

Similar articles

Cited by

References

    1. Fifel K, Videnovic A. Circadian and sleep dysfunctions in neurodegenerative disorders—an update. Front. Neurosci. 2021;14:627330. - PMC - PubMed
    1. Shulman JM, De Jager PL, Feany MB. Parkinson’s disease: genetics and pathogenesis. Annu. Rev. Pathol. 2011;6:193–222. - PubMed
    1. Leng Y, et al. Association of circadian abnormalities in older adults with an increased risk of developing Parkinson disease. JAMA Neurol. 2020;77:1270–1278. - PMC - PubMed
    1. Liu W-W, et al. BMAL1 regulation of microglia-mediated neuroinflammation in MPTP-induced Parkinson’s disease mouse model. FASEB J. 2020;34:6570–6581. - PubMed
    1. French IT, Muthusamy KA. A review of sleep and its disorders in patients with Parkinson’s disease in relation to various brain structures. Front. Aging Neurosci. 2016;8:114. - PMC - PubMed

Publication types

LinkOut - more resources