. 2023 Sep 22;14(1):5913.
doi: 10.1038/s41467-023-41663-2.

Hypoxanthine phosphoribosyl transferase 1 metabolizes temozolomide to activate AMPK for driving chemoresistance of glioblastomas

Affiliations

Hypoxanthine phosphoribosyl transferase 1 metabolizes temozolomide to activate AMPK for driving chemoresistance of glioblastomas

Jianxing Yin et al. Nat Commun. .

Abstract

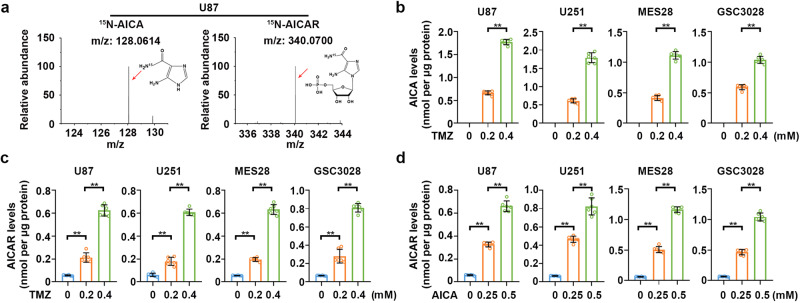
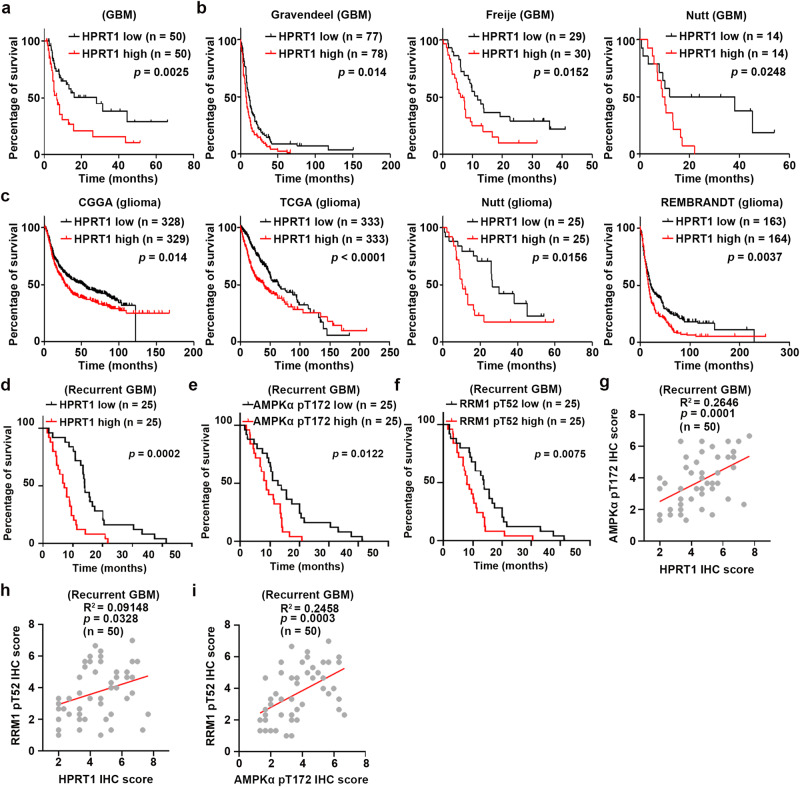
Temozolomide (TMZ) is a standard treatment for glioblastoma (GBM) patients. However, TMZ has moderate therapeutic effects due to chemoresistance of GBM cells through less clarified mechanisms. Here, we demonstrate that TMZ-derived 5-aminoimidazole-4-carboxamide (AICA) is converted to AICA ribosyl-5-phosphate (AICAR) in GBM cells. This conversion is catalyzed by hypoxanthine phosphoribosyl transferase 1 (HPRT1), which is highly expressed in human GBMs. As the bona fide activator of AMP-activated protein kinase (AMPK), TMZ-derived AICAR activates AMPK to phosphorylate threonine 52 (T52) of RRM1, the catalytic subunit of ribonucleotide reductase (RNR), leading to RNR activation and increased production of dNTPs to fuel the repairment of TMZ-induced-DNA damage. RRM1 T52A expression, genetic interruption of HPRT1-mediated AICAR production, or administration of 6-mercaptopurine (6-MP), a clinically approved inhibitor of HPRT1, blocks TMZ-induced AMPK activation and sensitizes brain tumor cells to TMZ treatment in mice. In addition, HPRT1 expression levels are positively correlated with poor prognosis in GBM patients who received TMZ treatment. These results uncover a critical bifunctional role of TMZ in GBM treatment that leads to chemoresistance. Our findings underscore the potential of combined administration of clinically available 6-MP to overcome TMZ chemoresistance and improve GBM treatment.


Conflict of interest statement

The authors declare no competing interests.

Figures

Fig. 1
Fig. 1. AICAR derived from AICA is a bona fide metabolic product of TMZ.
a Representative tandem mass spectra of 15N-AICA and 15N-AICAR. b Cells were treated with the indicated dose of TMZ for 2 h. Intracellular AICA levels were measured by HPLC-MS. Data represent the mean ± SD from sextuplicate experiments. **P < 0.001. U87, 0.2 vs. 0.4 mM, P  =  4.02e-12; U251, 0.2 vs. 0.4 mM, P  =  2.5e-09; MES28, 0.2 vs. 0.4 mM, P  =  4.56e-10; GSC3028, 0.2 vs. 0.4 mM, P  =  2.86e-08. c Cells were treated with the indicated dose of TMZ for 2 h. Intracellular AICAR levels were measured by HPLC-MS. Data represent the mean ± SD from sextuplicate experiments. **P < 0.001. U87, 0 vs. 0.2 mM, P  =  3.51e-06; 0.2 vs. 0.4 mM, P = 2.16e-08; U251, 0 vs. 0.2 mM, P  =  1.93e-05; 0.2 vs. 0.4 mM, P = 5.2e-10; MES28, 0 vs. 0.2 mM, P  =  1.56e-09; 0.2 vs. 0.4 mM, P = 5.18e-10; GSC3028, 0 vs. 0.2 mM, P  =  3.93e-05; 0.2 vs. 0.4 mM, P = 4.38e-08. d Cells were treated with the indicated dose of AICA for 2 h. Intracellular AICAR was measured by HPLC-MS. Data represent the mean ± SD from sextuplicate experiments. **P < 0.001. U87, 0 vs. 0.25 mM, P  =  2.77e-11; 0.25 vs. 0.5 mM, P = 1.79e-08; U251, 0 vs. 0.25 mM, P  =  5.11e-11; 0.25 vs. 0.5 mM, P = 4.5e-06; MES28, 0 vs. 0.25 mM, P  =  9.92e-10; 0.25 vs. 0.5 mM, P = 3.95e-10; GSC3028, 0 vs. 0.25 mM, P  =  7.52e-10; 0.25 vs. 0.5 mM, P = 6.09e-09. Statistics: bd unpaired Student’s t-test for two-group comparison. Source data are provided as a Source Data file.
Fig. 2
Fig. 2. TMZ-derived AICA activates AMPK.
Immunoblot analyses were performed with the indicated antibodies. Three biological repeats were repeated independently with similar results. a Cells were treated with the indicated dose of TMZ for 2 h. b Cells were treated with the indicated dose of AICA for 2 h. c Cells were treated with 0.25 mM of AICA for the indicated time course. Source data are provided as a Source Data file.
Fig. 3
Fig. 3. HPRT1 converts TMZ-derived AICA to AICAR.
a Cells were treated with 0.2 mM of 15N-TMZ for 2 h. Intracellular 15N-AICA were measured by HPLC-MS. Data represent the mean ± SD from sextuplicate experiments. **P < 0.001. U87, Control vs. HPRT1 shRNA, P = 5.27e-10; WT vs. D138N, P = 1.63e-09; WT vs. K166A, P = 1.95e-09; MES28, Control vs. HPRT1 shRNA, P = 2.98e-11; WT vs. D138N, P = 2.61e-12; WT vs. K166A, P = 1.96e-12. b Cells were treated with 0.2 mM of 15N-TMZ for 2 h. Intracellular 15N-AICAR levels were measured by HPLC-MS. Data represent the mean ± SD from sextuplicate experiments. **P < 0.001. U87, Control vs. HPRT1 shRNA, P = 4.75e-08; WT vs. D138N, P = 1.18e-10; WT vs. K166A, P = 1.32e-10; MES28, Control vs. HPRT1 shRNA, P = 1.61e-09; WT vs. D138N, P = 1.67e-08; WT vs. K166A, P = 1.31e-08. c Representative chromatograms of products of the HPRT1 kinase assay. d Michaelis-Menten curve of HPRT1 for AICA. Reactions were performed by mixing purified active HPRT1 and AICA. Data represent the mean ± SD from sextuplicate experiments. e and f Cells with or without shRNA-mediated HPRT1 depletion were treated with or without 0.2 mM of TMZ (e) or 0.25 of mM AICA for 2 h (f), respectively. Immunoblot analyses were performed with the indicated antibodies. Three biological repeats were repeated independently with similar results. g HPRT1-depleted cells with reconstituted expression of WT Flag-HPRT1, Flag-HPRT1 D138N, or Flag-HPRT1 K166A were treated with or without 0.2 mM of TMZ for 2 h. Immunoblot analyses were performed with the indicated antibodies. Three biological repeats were repeated independently with similar results. Statistics: a, b unpaired Student’s t-test for two-group comparison. Source data are provided as a Source Data file.
Fig. 4
Fig. 4. TMZ-activated AMPK phosphorylates RRM1 at T52.
ae, gi Immunoprecipitation and immunoblot analyses were performed with the indicated antibodies. ai Three biological repeats were repeated independently with similar results. a Cells pretreated with or without 0.25 mM of AICA were treated with or without 0.2 mM of TMZ for the indicated time points. b Cells pretreated with or without 0.25 mM of A769662 were treated with or without 0.2 mM of TMZ for the indicated time points. c Cells were treated with or without 0.2 mM of TMZ for 2 h. d In vitro phosphorylation and SDS-PAGE analysis and autoradiography were performed by mixing purified WT His-RRM1 or His-RRM1 T52A protein with active AMPK in the presence of [γ-32P]ATP. e Bacterially purified WT His-RRM1 or His-RRM1 T52A was incubated with or without active AMPK in the presence or absence of ATP. f Stoichiometry of RRM1 phosphorylation by AMPK. Bacterially purified His-RRM1 was incubated with active AMPK in the presence of [γ-32P]ATP. The radioactive intensity of incorporated 32P was measured and the incorporation of 32P into RRM1 was calculated. Data represent the mean ± SD of triplicate samples. g The indicated cells expressing WT Flag-RRM1 or Flag-RRM1 T52A were treated with the indicated dose of TMZ for 2 h. h AMPKα1/2 double knockout (DKO) U87 cells expressing WT Flag-RRM1 or Flag-RRM1 T52A were treated with or without 0.2 mM of TMZ for 2 h. C1 and C2, two clones of AMPKα1/2 DKO U87 cells. i The indicated cells with or without HPRT1 depletion were transfected with vectors expressing WT Flag-RRM1 or Flag-RRM1 T52A. The cells were further treated with 0.2 mM of TMZ for 2 h.
Fig. 5
Fig. 5. TMZ-mediated RRM1 T52 phosphorylation promotes DNA damage repair.
a and b WT His-RRM1 or His-RRM1 T52A mutant proteins were mixed with His-RRM2 and incubated with active AMPK in the presence of ATP for 20 min followed by HPLC-MS analysis. (a) Ribonucleotide reductase (RNR) activity was measured according to dCDP production. (b) Kd was calculated. Data represent the mean ± SD from sextuplicate experiments. **P < 0.001. a WT + AMPK vs. T52A + AMPK, P = 2.91e-08; b His-RRM1 WT vs. His-RRM1 WT + AMPK, P = 3.73e-05; His-RRM1 WT + AMPK vs. His-RRM1 T52A + AMPK, P = 0.00032. c Cells with or without HPRT1 depletion were transfected with Flag-RRM1 and treated with or without 0.2 mM of TMZ for 2 h. RNR activity was measured according to dCDP production. Immunoblotting analysis was performed to confirm the AMPK-mediated phosphorylation status of RRM1. Data represent the mean ± SD from sextuplicate experiments. **P < 0.001. U87, Flag-RRM1 + TMZ vs. Flag-RRM1 + TMZ + HPRT1 shRNA, P = 3.18e-08; MES28, Flag-RRM1 + TMZ vs. Flag-RRM1 + TMZ + HPRT1 shRNA, P = 1.56e-11. d Cells with or without HPRT1 depletion were treated with or without 0.2 mM of TMZ, respectively, for 24 h. The rate of apoptotic cells was examined by FACS. Data represent the mean ± SD from sextuplicate experiments. **P < 0.001. U87, TMZ vs. HPRT1 shRNA + TMZ, P = 1.12e-08; MES28, TMZ vs. HPRT1 shRNA + TMZ, P = 1.29e-06. e RRM1-depleted cells with reconstituted expression of Flag-RRM1 WT or Flag-RRM1 T52A were treated with or without 0.2 mM of TMZ, respectively, for 24 h. The rate of apoptotic cells was examined by FACS. Data represent the mean ± SD from sextuplicate experiments. **P < 0.001. U87, Flag-RRM1 WT + TMZ vs. Flag-RRM1 T52A + TMZ, P = 3.68e-05; MES28, Flag-RRM1 WT + TMZ vs. Flag-RRM1 T52A + TMZ, P = 4.7e-09. Statistics: ae unpaired Student’s t-test for two-group comparison. Source data are provided as a Source Data file.
Fig. 6
Fig. 6. Inhibition of HPRT1-mediated RRM1 T52 phosphorylation sensitizes brain tumors to TMZ treatment.
a Luciferase-expressing MES28 and U87 cells with or without HPRT1 depletion were intracranially injected into nude mice (n = 10 for each group). Shown are luminescence intensity of tumors in representative mice at the indicated time points. b The survival time of the indicated groups of mice was recorded. **P < 0.001. MES28, Control shRNA+TMZ vs. HPRT1 shRNA+TMZ, P = 1.97e-05; U87, Control shRNA+TMZ vs. HPRT1 shRNA+TMZ, P = 2.81e-05. c and d Representative IHC images of ACC1 pS79 (c) and γ-H2AX (d) were shown. Scale bars, 60 μm. n = 10 for each group. e Representative TUNEL images were shown. Scale bars, 60 μm. n = 10 for each group. f Luciferase-expressing MES28 and U87 cells with RRM1 depletion and reconstituted expression of WT Flag-RRM1 or the Flag-RRM1 T52A mutant were intracranially injected into nude mice (n = 10 for each group). Shown are luminescence intensity of tumors in representative mice at the indicated time points. g The survival time of the indicated groups of mice was recorded. **P < 0.001. MES28, Flag-RRM1 WT + TMZ vs. Flag-RRM1 T52A + TMZ, P = 4.42e-05; U87, Flag-RRM1 WT + TMZ vs. Flag-RRM1 T52A + TMZ, P = 0.00025. h Representative IHC images of RRM1 pT52 were shown. Scale bars, 60 μm. n = 10 for each group. i Representative TUNEL images were shown. Scale bars, 60 μm. n = 10 for each group. Statistics: b, g Log-rank test for two-group comparison. b Control shRNA + TMZ vs. HPRT1 shRNA + TMZ, g Flag-RRM1 WT + TMZ vs. Flag-RRM1 T52A + TMZ. Source data are provided as a Source Data file.
Fig. 7
Fig. 7. Combined treatment with 6-MP and TMZ blocks TMZ-induced DNA damage repair and synergistically inhibits brain tumor growth.
a and b Cells were treated with 0.2 mM of 15N-TMZ together with the indicated concentration of 6-MP for 2 h. Intracellular 15N-AICA (a) and 15N-AICAR levels (b) were measured by HPLC-MS. Data represent the mean ± SD from sextuplicate experiments. **P < 0.001. c Synergistic effect of TMZ with 6-MP on U87 (gray circle), and MES28 (orange circle). CI (combination index) value was calculated. d Luciferase-expressing MES28 and U87 cells were intracranially injected into nude mice (n = 10 for each group). Shown are luminescence intensity of tumors in representative mice at the indicated time points. e The survival time of the indicated groups of mice was recorded. **P < 0.001. fh, Representative IHC images of ACC1 pS79 (f), RRM1 pT52 (g), and γ-H2AX (h) were shown. Scale bars, 60 μm. n = 10 for each group. i Representative TUNEL images were shown. Scale bars, 60 μm. n = 10 for each group. Statistics: a, b unpaired Student’s t-test for two-group comparison. e Log-rank test for two-group comparison (TMZ vs. TMZ + 6-MP). Source data are provided as a Source Data file.
Fig. 8
Fig. 8. HPRT1 expression predicts poor prognosis of GBM patients.
a and b Kaplan–Meier survival analysis based on HPRT1 expression from collected primary GBM samples (a) and the indicated GBM datasets (b). c Kaplan–Meier survival analysis based on HPRT1 expression from the indicated glioma datasets. df Kaplan–Meier survival analysis based on HPRT1 (d), AMPK pT172 (e), and RRM1 pT52 (f) expression from collected recurrent GBM samples. gi The Pearson correlation test was used to analyze the correlation among HPRT1, AMPK pT172, and RRM1 pT52. Statistics: af Log-rank test for two-group comparison. Source data are provided as a Source Data file.

Similar articles

Cited by

References

    1. Stupp R, et al. Effects of radiotherapy with concomitant and adjuvant temozolomide versus radiotherapy alone on survival in glioblastoma in a randomised phase III study: 5-year analysis of the EORTC-NCIC trial. Lancet Oncol. 2009;10:459–466. - PubMed
    1. Stupp R, et al. Radiotherapy plus concomitant and adjuvant temozolomide for glioblastoma. N Engl. J. Med. 2005;352:987–996. - PubMed
    1. Stevens MF, et al. Antitumor imidazotetrazines. 1. Synthesis and chemistry of 8-carbamoyl-3-(2-chloroethyl)imidazo[5,1-d]−1,2,3,5-tetrazin-4(3 H)-one, a novel broad-spectrum antitumor agent. J. Med. Chem. 1984;27:196–201. - PubMed
    1. Alexander BM, Pinnell N, Wen PY, D’Andrea A. Targeting DNA repair and the cell cycle in glioblastoma. J. Neurooncol. 2012;107:463–477. - PubMed
    1. Gerson SL. Clinical relevance of MGMT in the treatment of cancer. J. Clin. Oncol. 2002;20:2388–2399. - PubMed

Publication types