

Texture feature analysis of MRI-ADC images to differentiate glioma grades using machine learning techniques
- PMID: 37737249
- PMCID: PMC10517003
- DOI: 10.1038/s41598-023-41353-5
Texture feature analysis of MRI-ADC images to differentiate glioma grades using machine learning techniques
Abstract
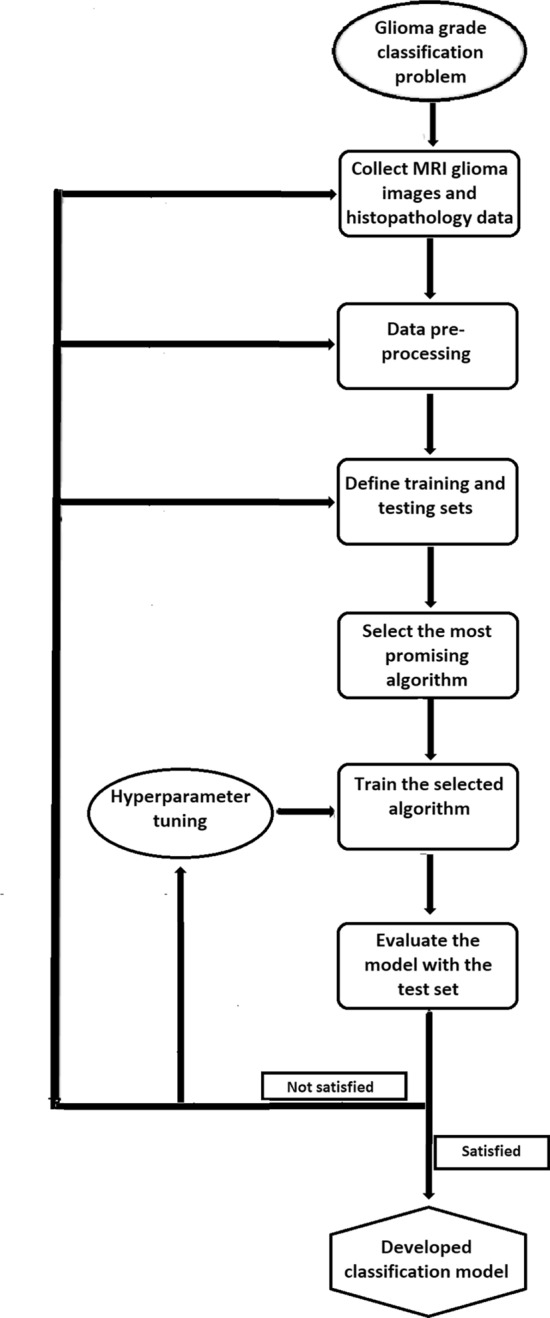
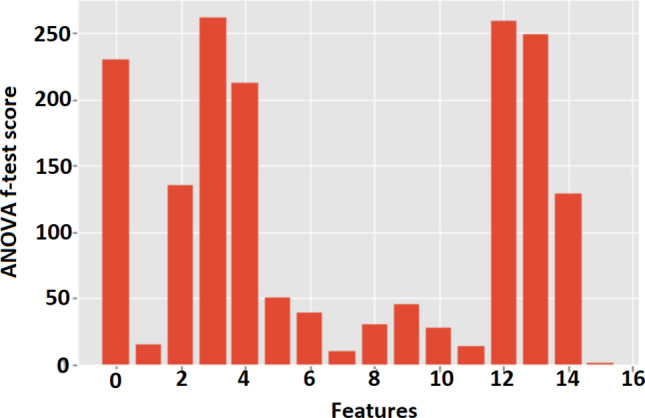
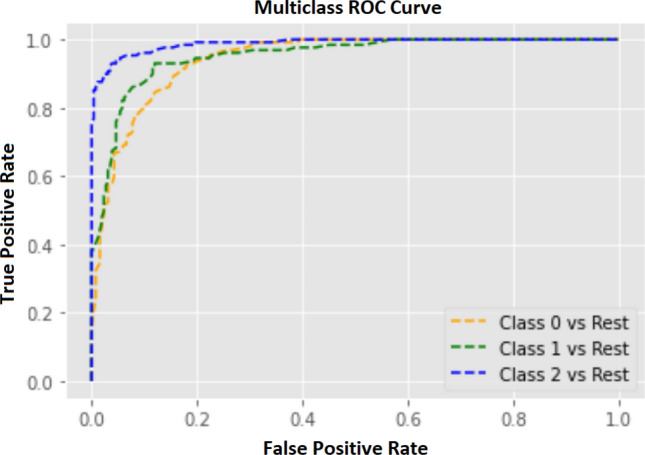
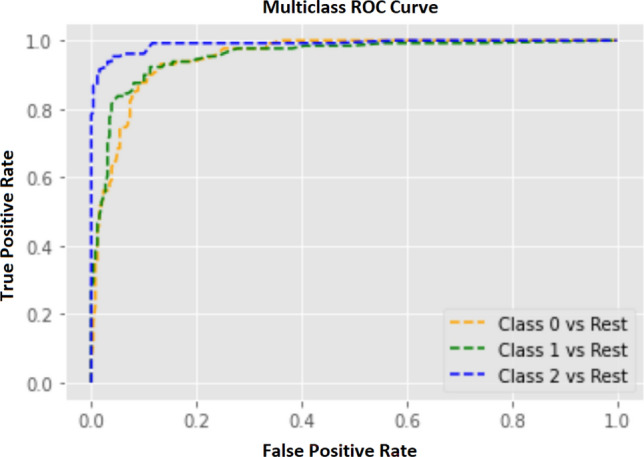
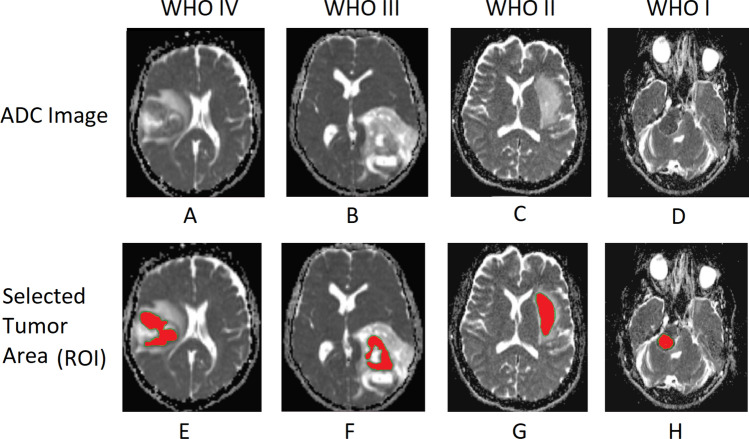
Apparent diffusion coefficient (ADC) of magnetic resonance imaging (MRI) is an indispensable imaging technique in clinical neuroimaging that quantitatively assesses the diffusivity of water molecules within tissues using diffusion-weighted imaging (DWI). This study focuses on developing a robust machine learning (ML) model to predict the aggressiveness of gliomas according to World Health Organization (WHO) grading by analyzing patients' demographics, higher-order moments, and grey level co-occurrence matrix (GLCM) texture features of ADC. A population of 722 labeled MRI-ADC brain image slices from 88 human subjects was selected, where gliomas are labeled as glioblastoma multiforme (WHO-IV), high-grade glioma (WHO-III), and low-grade glioma (WHO I-II). Images were acquired using 3T-MR systems and a region of interest (ROI) was delineated manually over tumor areas. Skewness, kurtosis, and statistical texture features of GLCM (mean, variance, energy, entropy, contrast, homogeneity, correlation, prominence, and shade) were calculated using ADC values within ROI. The ANOVA f-test was utilized to select the best features to train an ML model. The data set was split into training (70%) and testing (30%) sets. The train set was fed into several ML algorithms and selected most promising ML algorithm using K-fold cross-validation. The hyper-parameters of the selected algorithm were optimized using random grid search technique. Finally, the performance of the developed model was assessed by calculating accuracy, precision, recall, and F1 values reported for the test set. According to the ANOVA f-test, three attributes; patient gender (1.48), GLCM energy (9.48), and correlation (13.86) that performed minimum scores were excluded from the dataset. Among the tested algorithms, the random forest classifier(0.8772 ± 0.0237) performed the highest mean-cross-validation score and selected to build the ML model which was able to predict tumor categories with an accuracy of 88.14% over the test set. The study concludes that the developed ML model using the above features except for patient gender, GLCM energy, and correlation, has high prediction accuracy in glioma grading. Therefore, the outcomes of this study enable to development of advanced tumor classification applications that assist in the decision-making process in a real-time clinical environment.
© 2023. Springer Nature Limited.
Conflict of interest statement
The authors declare no competing interests.
Figures

Similar articles
-
Feature extraction from MRI ADC images for brain tumor classification using machine learning techniques.Biomed Eng Online. 2022 Aug 1;21(1):52. doi: 10.1186/s12938-022-01022-6. Biomed Eng Online. 2022. PMID: 35915448 Free PMC article.
-
Voxel-based clustered imaging by multiparameter diffusion tensor images for glioma grading.Neuroimage Clin. 2014 Aug 7;5:396-407. doi: 10.1016/j.nicl.2014.08.001. eCollection 2014. Neuroimage Clin. 2014. PMID: 25180159 Free PMC article.
-
Radiomics-Based Machine Learning Classification for Glioma Grading Using Diffusion- and Perfusion-Weighted Magnetic Resonance Imaging.J Comput Assist Tomogr. 2021 Jul-Aug 01;45(4):606-613. doi: 10.1097/RCT.0000000000001180. J Comput Assist Tomogr. 2021. PMID: 34270479
-
Diffusion- and perfusion-weighted MRI radiomics model may predict isocitrate dehydrogenase (IDH) mutation and tumor aggressiveness in diffuse lower grade glioma.Eur Radiol. 2020 Apr;30(4):2142-2151. doi: 10.1007/s00330-019-06548-3. Epub 2019 Dec 11. Eur Radiol. 2020. PMID: 31828414
-
Machine learning applications to neuroimaging for glioma detection and classification: An artificial intelligence augmented systematic review.J Clin Neurosci. 2021 Jul;89:177-198. doi: 10.1016/j.jocn.2021.04.043. Epub 2021 May 13. J Clin Neurosci. 2021. PMID: 34119265
Cited by
-
A Combined Approach Using T2*-Weighted Dynamic Susceptibility Contrast MRI Perfusion Parameters and Radiomics to Differentiate Between Radionecrosis and Glioma Progression: A Proof-of-Concept Study.Life (Basel). 2025 Apr 5;15(4):606. doi: 10.3390/life15040606. Life (Basel). 2025. PMID: 40283161 Free PMC article.
-
Stochastic differential equation modeling approach for grading astrocytomas on brain MRI images.Sci Rep. 2025 Jul 2;15(1):22835. doi: 10.1038/s41598-025-06144-0. Sci Rep. 2025. PMID: 40596507 Free PMC article.
-
Predicting the molecular subtypes of 2021 WHO grade 4 glioma by a multiparametric MRI-based machine learning model.BMC Cancer. 2025 Jul 14;25(1):1171. doi: 10.1186/s12885-025-14529-7. BMC Cancer. 2025. PMID: 40660102 Free PMC article.
-
Feasibility study of computed tomography texture analysis for evaluation of canine primary adrenal gland tumors.Front Vet Sci. 2023 Aug 30;10:1126165. doi: 10.3389/fvets.2023.1126165. eCollection 2023. Front Vet Sci. 2023. PMID: 37711438 Free PMC article.
-
Radiomics-based prediction of pathological subtypes in peripheral neuroblastic tumors using 123I-MIBG SPECT/CT imaging: an observational study.Eur J Pediatr. 2025 Jun 7;184(7):399. doi: 10.1007/s00431-025-06233-2. Eur J Pediatr. 2025. PMID: 40481978
References
-
- Goodenberger ML, Jenkins RB. Genetics of adult glioma. Cancer Genet. 2012;205:613–621. - PubMed
-
- Tessamma, T. & Ananda Resmi, S. Texture Description of Low Grade and High Grade Glioma Using Statistical Features in Brain MRIS (ACEEE, 2010).
-
- Zuckerkandl, E. & Pauling, L. Evolutionary divergence and convergence in proteins. In: Evolving Genes and Proteins. 97–166 (Elsevier, 1965).
Publication types
MeSH terms
LinkOut - more resources
Full Text Sources
Medical
